

Pneumonia-Associated Hospitalizations, New York City, 2001-2014
- PMID: 30188808
- PMCID: PMC6134561
- DOI: 10.1177/0033354918792009
Pneumonia-Associated Hospitalizations, New York City, 2001-2014
Abstract
Objectives: Death certificate data indicate that the age-adjusted death rate for pneumonia and influenza is higher in New York City than in the United States. Most pneumonia and influenza deaths are attributed to pneumonia rather than influenza. Because most pneumonia deaths occur in hospitals, we analyzed hospital discharge data to provide insight into the burden of pneumonia in New York City.
Methods: We analyzed data for New York City residents discharged from New York State hospitals with a principal diagnosis of pneumonia, or a secondary diagnosis of pneumonia if the principal diagnosis was respiratory failure or sepsis, during 2001-2014. We calculated mean annual age-adjusted pneumonia-associated hospitalization rates per 100 000 population and 95% confidence intervals (CIs). We examined data on pneumonia-associated hospitalizations by sociodemographic characteristics and colisted conditions.
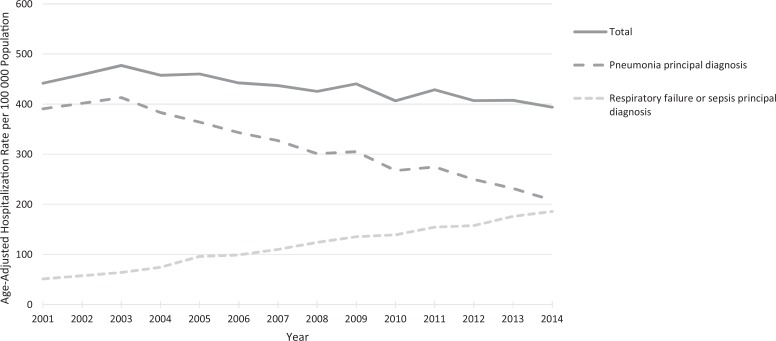
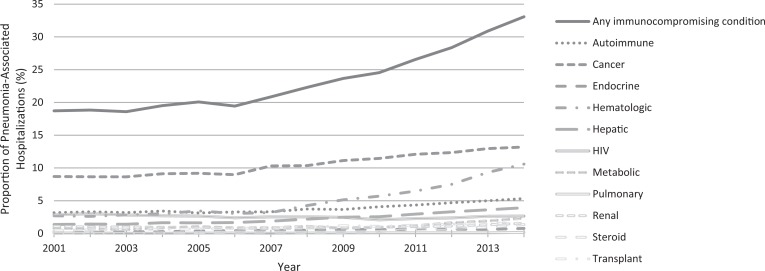
Results: During 2001-2014, a total of 495 225 patients residing in New York City were hospitalized for pneumonia, corresponding to a mean annual age-adjusted pneumonia-associated hospitalization rate of 433.8 per 100 000 population (95% CI, 429.3-438.3). The proportion of pneumonia-associated hospitalizations with in-hospital death was 12.0%. The mean annual age-adjusted pneumonia-associated hospitalization rate per 100 000 population increased as area-based poverty level increased, whereas the percentage of pneumonia-associated hospitalizations with in-hospital deaths decreased with increasing area-based poverty level. The proportion of pneumonia-associated hospitalizations that colisted an immunocompromising condition increased from 18.7% in 2001 to 33.1% in 2014.
Conclusion: Sociodemographic factors and immune status appear to play a role in the epidemiology of pneumonia-associated hospitalizations in New York City. Further study of pneumonia-associated hospitalizations in at-risk populations may lead to targeted interventions.
Keywords: epidemiology; hospitalization; pneumonia.
Conflict of interest statement
Figures
References
-
- World Health Organization. Pneumonia. 2016. http://www.who.int/mediacentre/factsheets/fs331/en . Accessed July 20, 2018.
-
- Centers for Disease Control and Prevention. Pneumonia. Page updated August 2017 https://www.cdc.gov/pneumonia. Accessed July 20, 2018.
-
- Ruiz M, Ewig S, Marcos MA, et al. Etiology of community-acquired pneumonia: impact of age, comorbidity, and severity. Am J Respir Crit Care Med. 1999;160(2):397–405. - PubMed
-
- National Center for Health Statistics. Health, United States, 2015: with special feature on racial and ethnic health disparities. Updated June 2017 https://www.cdc.gov/nchs/data/hus/hus15.pdf#019. Accessed July 20, 2018. - PubMed
Publication types
MeSH terms
LinkOut - more resources
Full Text Sources
Other Literature Sources
Medical
