

Relationships between histogram analysis of ADC values and complex 18F-FDG-PET parameters in head and neck squamous cell carcinoma
- PMID: 30188926
- PMCID: PMC6126801
- DOI: 10.1371/journal.pone.0202897
Relationships between histogram analysis of ADC values and complex 18F-FDG-PET parameters in head and neck squamous cell carcinoma
Abstract
Purpose: Histogram analysis is an emergent imaging technique to further analyze radiological images and to obtain imaging biomarker. In head and neck cancer, MRI and PET are routinely used in clinical practice. The aim of this study was to analyze associations between histogram based ADC parameters and complex FDG-PET derived parameters in head and neck squamous cell carcinoma (HNSCC).
Methods: 34 patients (26% female, mean age, 56.7 ± 10.2 years) with primary HNSCC were prospectively included into the study. ADC histogram parameters were calculated by inhouse made matlab software using a whole lesion measurement. For each tumor, maximum and mean standardized uptake values (SUVmax, SUVmean), Total Lesion Glycolysis (TLG) and Metabolic Tumor Volume (MTV) were determined on PET-images. Spearman's correlation coefficient (ρ) was used to analyze associations between investigated parameters. Benjamini-Hochberg correction was used to adjust for multiple testing. Mann-Whitney test was used for group discrimination. P-values < 0.05 were taken to indicate statistical significance.
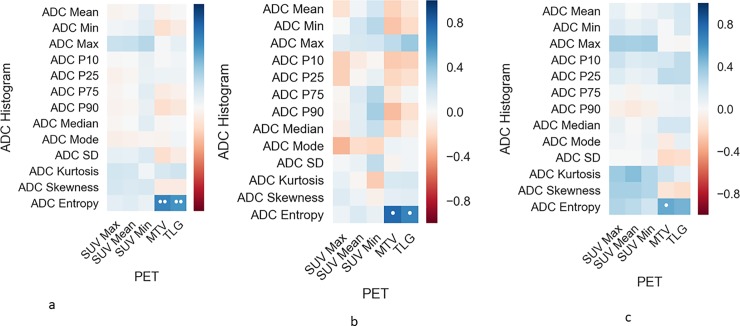
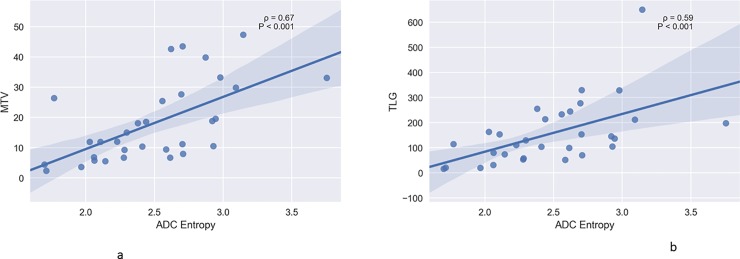
Results: The correlation analysis in the whole tumor group revealed a statistically significant correlation between entropy and MTV as well as TLG (ρ = 0.67, P<0.0001 and ρ = 0.61, P = 0.0002 respectively). There were statistically significant differences between T1/2 and T3/4 tumors in the following parameters: entropy (2.07 ± 0.36 vs 2.61 ± 0.43, P = 0.007), SUVmax (10.79 ± 4.13 vs 17.93 ± 5.89, P = 0.007), SUVmean (6.39 ± 2.48 vs 9.81 ± 4.49, P = 0.01), SUVmin (4.09 ± 1.57 vs 6.34 ± 2.59, P = 0.03), MTV (9.50 ± 7.92 vs 20.36 ± 13.30, P = 0.02), TGU (55.97 ± 39.09 vs 212.3 ± 186.3, P = 0.002).
Conclusion: This study showed that entropy derived from ADC maps is strongly associated with MTV and TLG in HNSCC. Entropy, SUVmax, SUVmean, TLG and MTV were statistically significant higher in T3/4 tumors in comparison to T1/2 carcinomas.
Conflict of interest statement
The authors have declared that no competing interests exist.
Figures


References
-
- Surov A, Meyer HJ, Wienke A. Correlation between apparent diffusion coefficient (ADC) and cellularity is different in several tumors: a meta-analysis. Oncotarget. 2017;8(35):59492–9. doi: 10.18632/oncotarget.17752 - DOI - PMC - PubMed
-
- Surov A, Meyer HJ, Wienke A. Associations between apparent diffusion coefficient (ADC) and KI 67 in different tumors: a meta-analysis. Part 1: ADCmean. Oncotarget. 2017;8(43):75434–44. doi: 10.18632/oncotarget.20406 - DOI - PMC - PubMed
-
- van der Hoorn A, van Laar PJ, Holtman GA, Westerlaan HE. Diagnostic accuracy of magnetic resonance imaging techniques for treatment response evaluation in patients with head and neck tumors, a systematic review and meta-analysis. PLoS One. 2017;12(5):e0177986 10.1371/journal.pone.0177986 - DOI - PMC - PubMed
MeSH terms
Substances
LinkOut - more resources
Full Text Sources
Other Literature Sources
Medical
