

Diagnostics for Pleiotropy in Mendelian Randomization Studies: Global and Individual Tests for Direct Effects
- PMID: 30188971
- PMCID: PMC6269243
- DOI: 10.1093/aje/kwy177
Diagnostics for Pleiotropy in Mendelian Randomization Studies: Global and Individual Tests for Direct Effects
Abstract
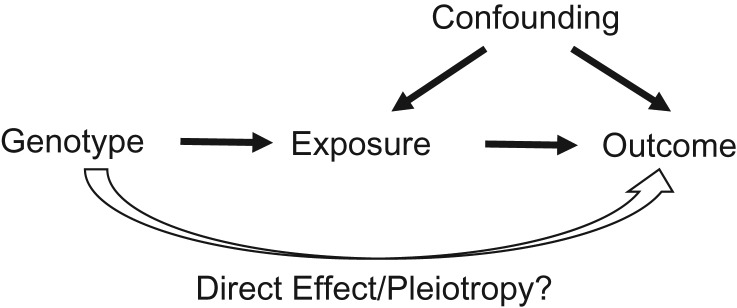
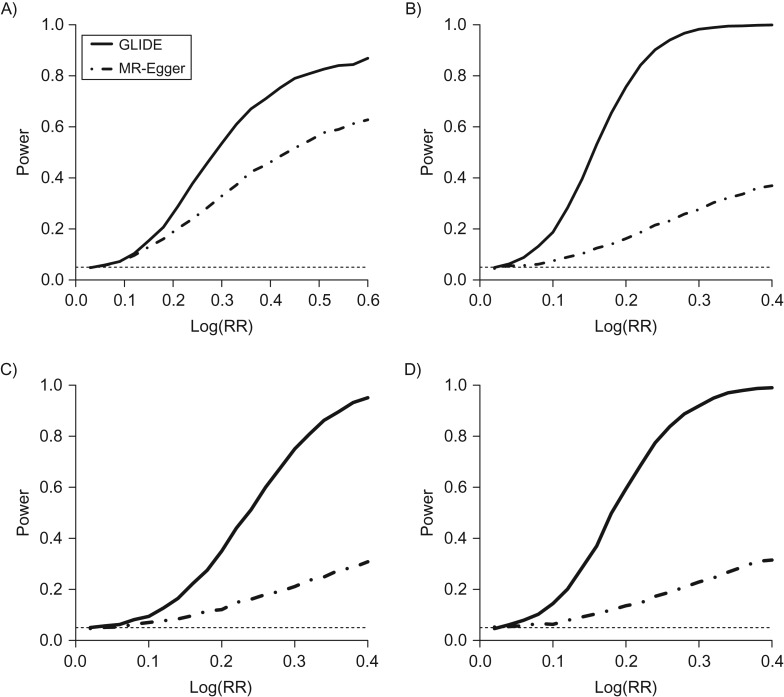
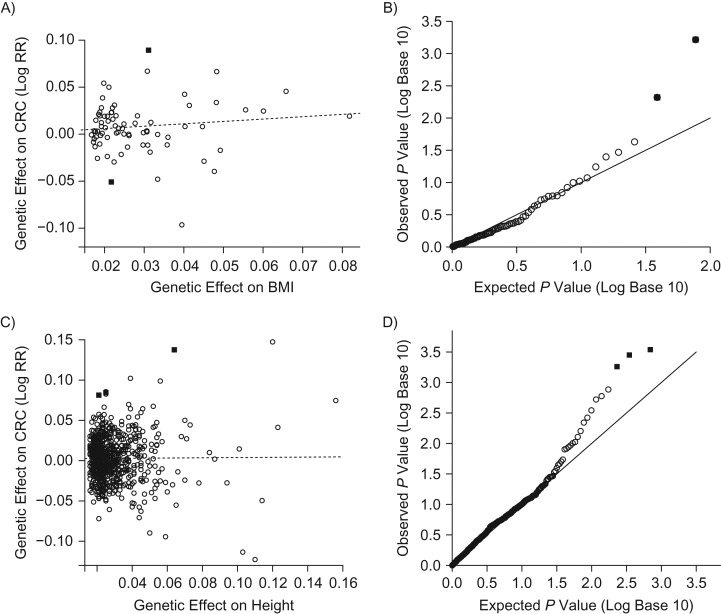
Diagnosing pleiotropy is critical for assessing the validity of Mendelian randomization (MR) analyses. The popular MR-Egger method evaluates whether there is evidence of bias-generating pleiotropy among a set of candidate genetic instrumental variables. In this article, we propose a statistical method-global and individual tests for direct effects (GLIDE)-for systematically evaluating pleiotropy among the set of genetic variants (e.g., single nucleotide polymorphisms (SNPs)) used for MR. As a global test, simulation experiments suggest that GLIDE is nearly uniformly more powerful than the MR-Egger method. As a sensitivity analysis, GLIDE is capable of detecting outliers in individual variant-level pleiotropy, in order to obtain a refined set of genetic instrumental variables. We used GLIDE to analyze both body mass index and height for associations with colorectal cancer risk in data from the Genetics and Epidemiology of Colorectal Cancer Consortium and the Colon Cancer Family Registry (multiple studies). Among the body mass index-associated SNPs and the height-associated SNPs, several individual variants showed evidence of pleiotropy. Removal of these potentially pleiotropic SNPs resulted in attenuation of respective estimates of the causal effects. In summary, the proposed GLIDE method is useful for sensitivity analyses and improves the validity of MR.
Figures
Comment in
-
Invited Commentary: Detecting Individual and Global Horizontal Pleiotropy in Mendelian Randomization-A Job for the Humble Heterogeneity Statistic?Am J Epidemiol. 2018 Dec 1;187(12):2681-2685. doi: 10.1093/aje/kwy185. Am J Epidemiol. 2018. PMID: 30188969 Free PMC article.
Similar articles
-
Extending the MR-Egger method for multivariable Mendelian randomization to correct for both measured and unmeasured pleiotropy.Stat Med. 2017 Dec 20;36(29):4705-4718. doi: 10.1002/sim.7492. Epub 2017 Sep 27. Stat Med. 2017. PMID: 28960498 Free PMC article.
-
Mendelian randomization with invalid instruments: effect estimation and bias detection through Egger regression.Int J Epidemiol. 2015 Apr;44(2):512-25. doi: 10.1093/ije/dyv080. Epub 2015 Jun 6. Int J Epidemiol. 2015. PMID: 26050253 Free PMC article.
-
Causal associations between liver traits and Colorectal cancer: a Mendelian randomization study.BMC Med Genomics. 2023 Dec 6;16(1):316. doi: 10.1186/s12920-023-01755-w. BMC Med Genomics. 2023. PMID: 38057864 Free PMC article.
-
Polygenic Mendelian Randomization.Cold Spring Harb Perspect Med. 2021 Feb 1;11(2):a039586. doi: 10.1101/cshperspect.a039586. Cold Spring Harb Perspect Med. 2021. PMID: 32229610 Free PMC article. Review.
-
Evaluating the potential role of pleiotropy in Mendelian randomization studies.Hum Mol Genet. 2018 Aug 1;27(R2):R195-R208. doi: 10.1093/hmg/ddy163. Hum Mol Genet. 2018. PMID: 29771313 Free PMC article. Review.
Cited by
-
Germline-somatic JAK2 interactions are associated with clonal expansion in myelofibrosis.Nat Commun. 2022 Sep 8;13(1):5284. doi: 10.1038/s41467-022-32986-7. Nat Commun. 2022. PMID: 36075929 Free PMC article.
-
Incident disease associations with mosaic chromosomal alterations on autosomes, X and Y chromosomes: insights from a phenome-wide association study in the UK Biobank.Cell Biosci. 2021 Jul 23;11(1):143. doi: 10.1186/s13578-021-00651-z. Cell Biosci. 2021. PMID: 34301302 Free PMC article.
-
Phenotypic insights into genetic risk factors for immune-related adverse events in cancer immunotherapy.Cancer Immunol Immunother. 2024 Nov 2;74(1):1. doi: 10.1007/s00262-024-03854-8. Cancer Immunol Immunother. 2024. PMID: 39487892 Free PMC article.
-
Testing and controlling for horizontal pleiotropy with probabilistic Mendelian randomization in transcriptome-wide association studies.Nat Commun. 2020 Jul 31;11(1):3861. doi: 10.1038/s41467-020-17668-6. Nat Commun. 2020. PMID: 32737316 Free PMC article.
-
Comparisons of simple and complex methods for quantifying exposure to individual point source air pollution emissions.J Expo Sci Environ Epidemiol. 2021 Jul;31(4):654-663. doi: 10.1038/s41370-020-0219-1. Epub 2020 Mar 17. J Expo Sci Environ Epidemiol. 2021. PMID: 32203059 Free PMC article.
References
-
- Katan MB. Apolipoprotein E isoforms, serum cholesterol, and cancer. Lancet. 1986;1(8479):507–508. - PubMed
-
- Smith GD, Ebrahim S. ‘Mendelian randomization’: can genetic epidemiology contribute to understanding environmental determinants of disease? Int J Epidemiol. 2003;32(1):1–22. - PubMed
-
- Thomas DC, Conti DV. Commentary: the concept of ‘Mendelian randomization’. Int J Epidemiol. 2004;33(1):21–25. - PubMed
-
- Didelez V, Sheehan N. Mendelian randomisation as an instrumental variable approach to causal inference. Stat Methods Med Res. 2007;16(4):309–330. - PubMed
-
- Nitsch D, Molokhia M, Smeeth L, et al. . Limits to causal inference based on Mendelian randomization: a comparison with randomized controlled trials. Am J Epidemiol. 2006;163(5):397–403. - PubMed
Publication types
MeSH terms
Grants and funding
- MC_UU_00011/2/MRC_/Medical Research Council/United Kingdom
- P01 CA053996/CA/NCI NIH HHS/United States
- U01 CA074794/CA/NCI NIH HHS/United States
- U01 CA167551/CA/NCI NIH HHS/United States
- R00 CA215314/CA/NCI NIH HHS/United States
- S10 OD020069/OD/NIH HHS/United States
- R01 CA222833/CA/NCI NIH HHS/United States
- U01 CA137088/CA/NCI NIH HHS/United States
- MC_UU_00011/1/MRC_/Medical Research Council/United Kingdom
- U24 CA074794/CA/NCI NIH HHS/United States
- R01 CA189532/CA/NCI NIH HHS/United States
- R01 HL114901/HL/NHLBI NIH HHS/United States
LinkOut - more resources
Full Text Sources
Other Literature Sources
Research Materials
