

Variability in the Vestibulo-Ocular Reflex and Vestibular Perception
- PMID: 30189227
- PMCID: PMC6684204
- DOI: 10.1016/j.neuroscience.2018.08.025
Variability in the Vestibulo-Ocular Reflex and Vestibular Perception
Abstract
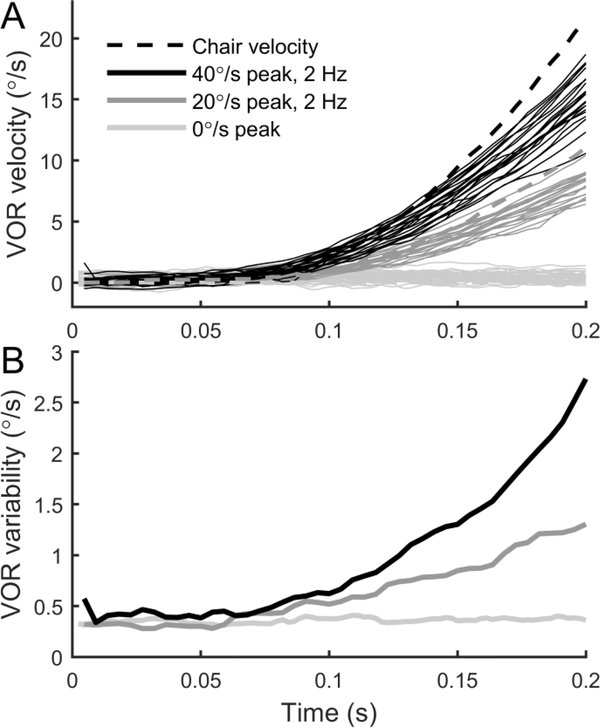
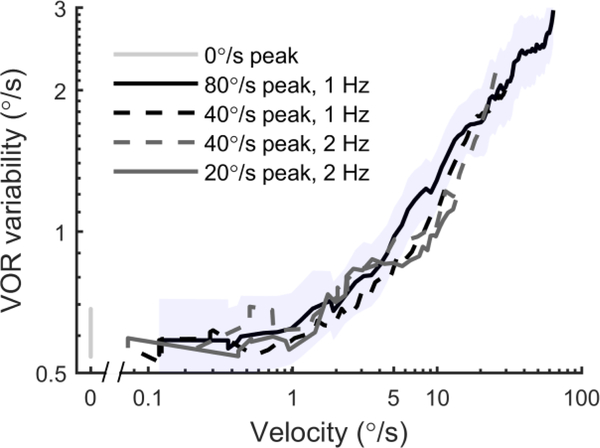
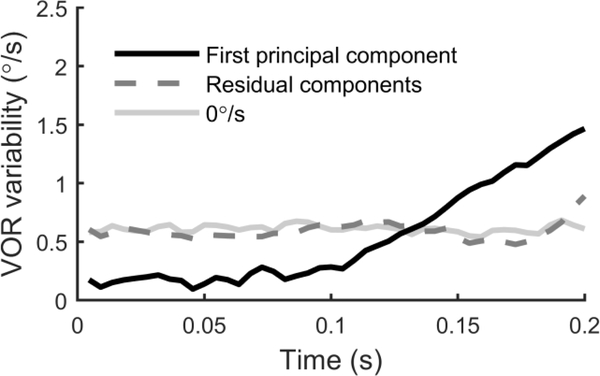
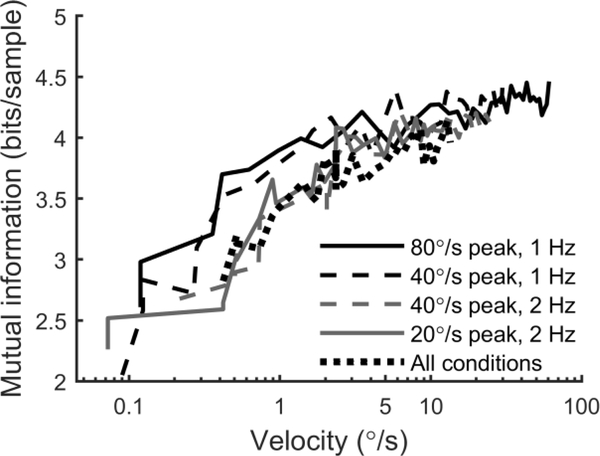
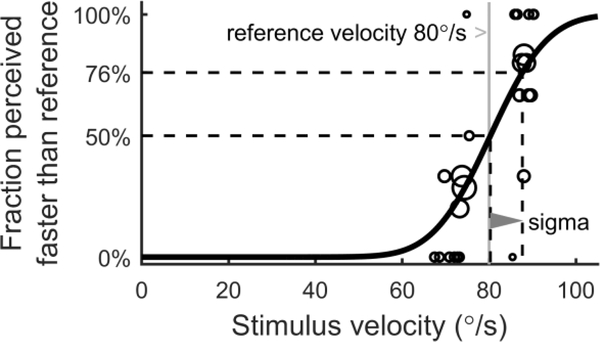
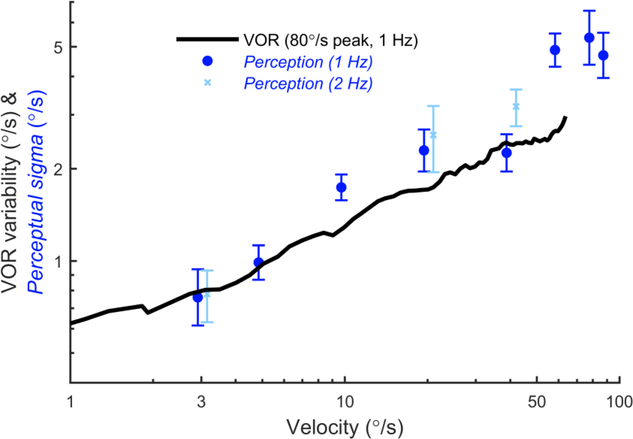
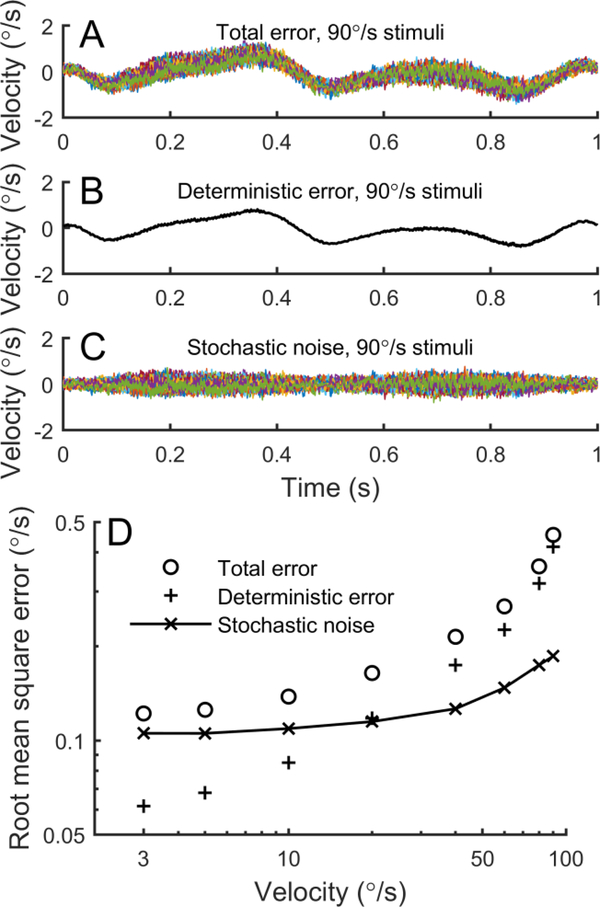
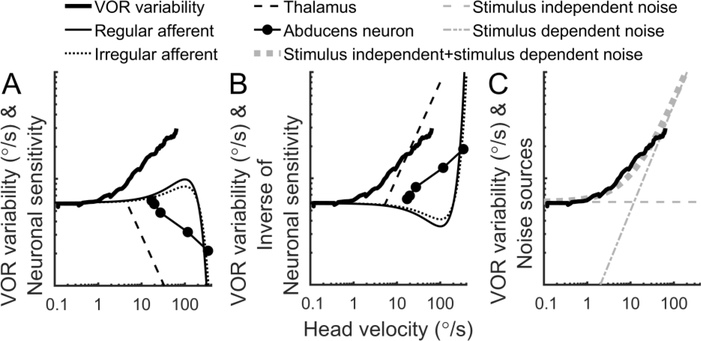
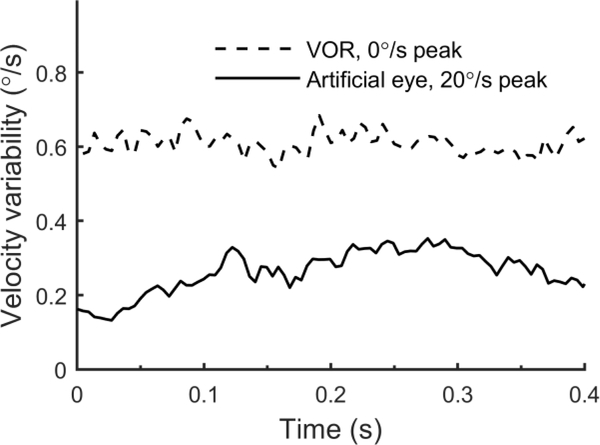
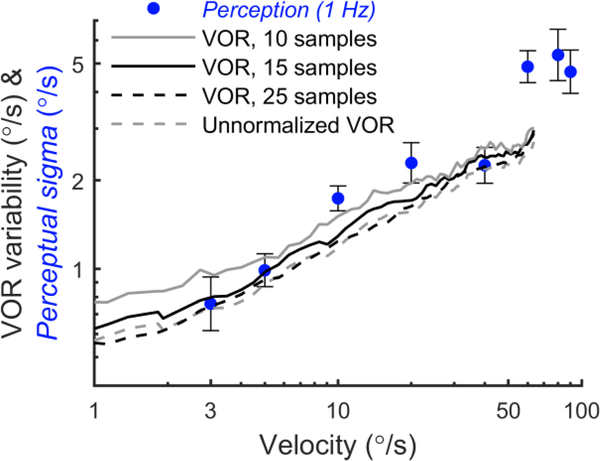
The vestibular system enables humans to estimate self-motion, stabilize gaze and maintain posture, but these behaviors are impacted by neural noise at all levels of processing (e.g., sensory, central, motor). Despite its essential importance, the behavioral impact of noise in human vestibular pathways is not completely understood. Here, we characterize the vestibular imprecision that results from neural noise by measuring trial-to-trial vestibulo-ocular reflex (VOR) variability and perceptual just-noticeable differences (JNDs) in the same human subjects as a function of stimulus intensity. We used head-centered yaw rotations about an Earth-vertical axis over a broad range of motion velocities (0-65°/s for VOR variability and 3-90°/s peak velocity for JNDs). We found that VOR variability increased from approximately 0.6°/s at a chair velocity of 1°/s to approximately 3°/s at 65°/s; it exhibited a stimulus-independent range below roughly 1°/s. Perceptual imprecision ("sigma") increased from 0.76°/s at 3°/s to 4.7°/s at 90°/s. Using stimuli that manipulated the relationship between velocity, displacement and acceleration, we found that velocity was the salient cue for VOR variability for our motion stimuli. VOR and perceptual imprecision both increased with stimulus intensity and were broadly similar over a range of stimulus velocities, consistent with a common noise source that affects motor and perceptual pathways. This contrasts with differing perceptual and motor stimulus-dependent imprecision in visual studies. Either stimulus-dependent noise or non-linear signal processing could explain our results, but we argue that afferent non-linearities alone are unlikely to be the source of the observed behavioral stimulus-dependent imprecision.
Keywords: just-noticeable difference; noise; vestibular; vestibulo-ocular reflex.
Copyright © 2018 IBRO. Published by Elsevier Ltd. All rights reserved.
Figures
Similar articles
-
Asymmetry of ocular motor and perceptual vestibular processing in humans with unilateral vestibular deafferentation.J Vestib Res. 2000;10(6):259-69. J Vestib Res. 2000. PMID: 11455107 Clinical Trial.
-
Visual contributions to human self-motion perception during horizontal body rotation.Arch Ital Biol. 2000 Apr;138(2):139-66. Arch Ital Biol. 2000. PMID: 10782255
-
Three-dimensional organization of otolith-ocular reflexes in rhesus monkeys. II. Inertial detection of angular velocity.J Neurophysiol. 1996 Jun;75(6):2425-40. doi: 10.1152/jn.1996.75.6.2425. J Neurophysiol. 1996. PMID: 8793754
-
Vestibular Precision at the Level of Perception, Eye Movements, Posture, and Neurons.Neuroscience. 2021 Aug 1;468:282-320. doi: 10.1016/j.neuroscience.2021.05.028. Epub 2021 Jun 2. Neuroscience. 2021. PMID: 34087393 Free PMC article. Review.
-
Anticipatory eye movements stabilize gaze during self-generated head movements.Ann N Y Acad Sci. 2011 Sep;1233:219-25. doi: 10.1111/j.1749-6632.2011.06165.x. Ann N Y Acad Sci. 2011. PMID: 21950997 Free PMC article. Review.
Cited by
-
The motor vertical in the absence of gravicentric cues.NPJ Microgravity. 2020 Mar 3;6:8. doi: 10.1038/s41526-020-0098-8. eCollection 2020. NPJ Microgravity. 2020. PMID: 32195319 Free PMC article.
-
Your Vestibular Thresholds May Be Lower Than You Think: Cognitive Biases in Vestibular Psychophysics.Am J Audiol. 2023 Nov;32(3S):730-738. doi: 10.1044/2023_AJA-22-00186. Epub 2023 Apr 21. Am J Audiol. 2023. PMID: 37084775 Free PMC article.
-
Postural impairments in unilateral and bilateral vestibulopathy.Front Neurol. 2024 Feb 21;15:1324868. doi: 10.3389/fneur.2024.1324868. eCollection 2024. Front Neurol. 2024. PMID: 38450076 Free PMC article.
-
The velocity storage time constant: Balancing between accuracy and precision.Prog Brain Res. 2019;248:269-276. doi: 10.1016/bs.pbr.2019.04.038. Epub 2019 Jun 12. Prog Brain Res. 2019. PMID: 31239137 Free PMC article.
-
Frequency dependence of human thresholds: both perceptual and vestibuloocular reflex thresholds.J Neurophysiol. 2024 Jun 1;131(6):1143-1155. doi: 10.1152/jn.00224.2023. Epub 2024 Apr 24. J Neurophysiol. 2024. PMID: 38658179 Free PMC article.
References
-
- Baloh RW, Enrietto J, Jacobson KM, Lin A (2001) Age-related changes in vestibular function: a longitudinal study. Ann N Y Acad Sci 942:210–219. - PubMed
-
- Benson AJ, Hutt EC, Brown SF (1989) Thresholds for the perception of whole body angular movement about a vertical axis. Aviat Space Environ Med 60:205–213. - PubMed
-
- Benson AJ, Spencer MB, Stott JR (1986) Thresholds for the detection of the direction of wholebody, linear movement in the horizontal plane. Aviat Space Environ Med 57:1088–1096. - PubMed
-
- Bergstrom B (1973) Morphology of the vestibular nerve. II. The number of myelinated vestibular nerve fibers in man at various ages. Acta Otolaryngol 76:173–179. - PubMed
Publication types
MeSH terms
Grants and funding
LinkOut - more resources
Full Text Sources
Other Literature Sources
