. 2018 Sep 6;15(1):256.
doi: 10.1186/s12974-018-1265-7.

Human Alzheimer's disease gene expression signatures and immune profile in APP mouse models: a discrete transcriptomic view of Aβ plaque pathology

Affiliations

Human Alzheimer's disease gene expression signatures and immune profile in APP mouse models: a discrete transcriptomic view of Aβ plaque pathology

Sarah M Rothman et al. J Neuroinflammation. .

Abstract

Background: Alzheimer's disease (AD) is a chronic neurodegenerative disease with pathological hallmarks including the formation of extracellular aggregates of amyloid-beta (Aβ) known as plaques and intracellular tau tangles. Coincident with the formation of Aβ plaques is recruitment and activation of glial cells to the plaque forming a plaque niche. In addition to histological data showing the formation of the niche, AD genetic studies have added to the growing appreciation of how dysfunctional glia pathways drive neuropathology, with emphasis on microglia pathways. Genomic approaches enable comparisons of human disease profiles between different mouse models informing on their utility to evaluate secondary changes to triggers such as Aβ deposition.

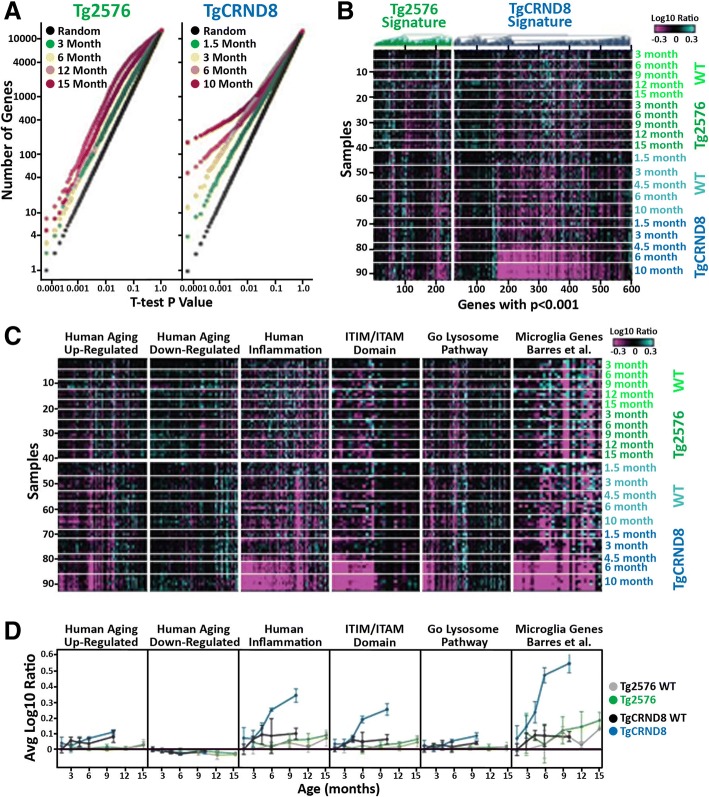
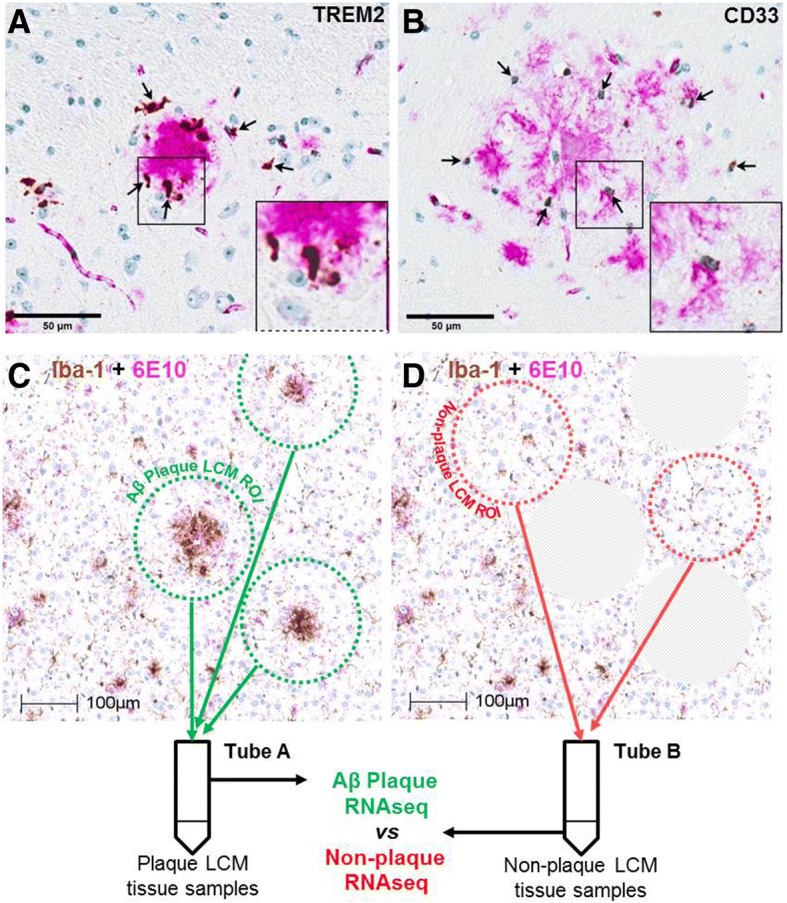
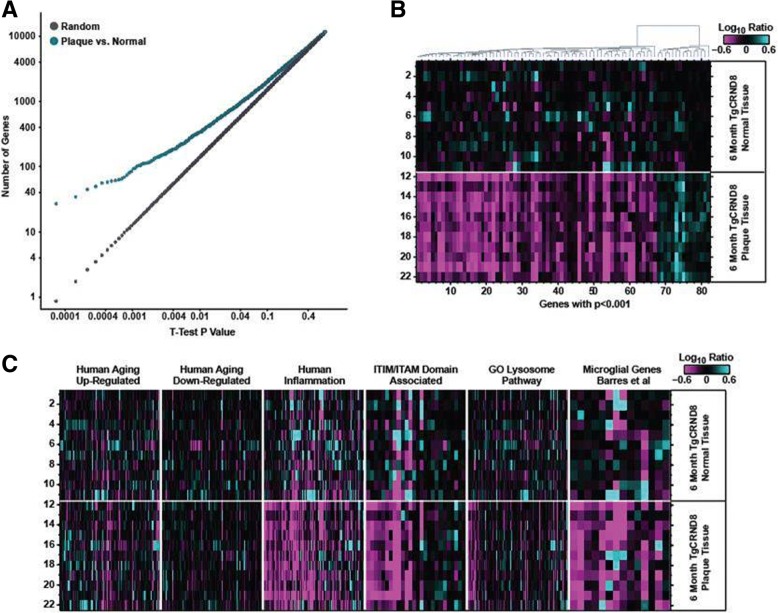
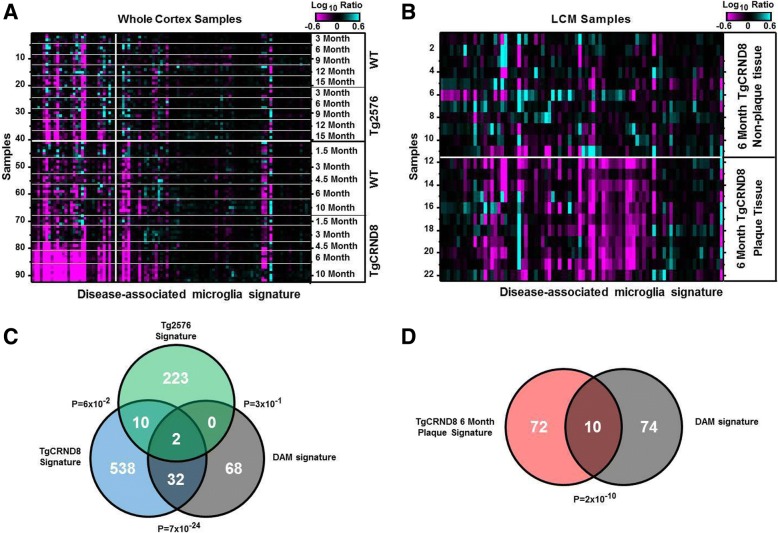
Methods: In this study, we utilized two animal models of AD to examine and characterize the AD-associated pathology: the Tg2576 Swedish APP (KM670/671NL) and TgCRND8 Swedish plus Indiana APP (KM670/671NL + V717F) lines. We used laser capture microscopy (LCM) to isolate samples surrounding Thio-S positive plaques from distal non-plaque tissue. These samples were then analyzed using RNA sequencing.

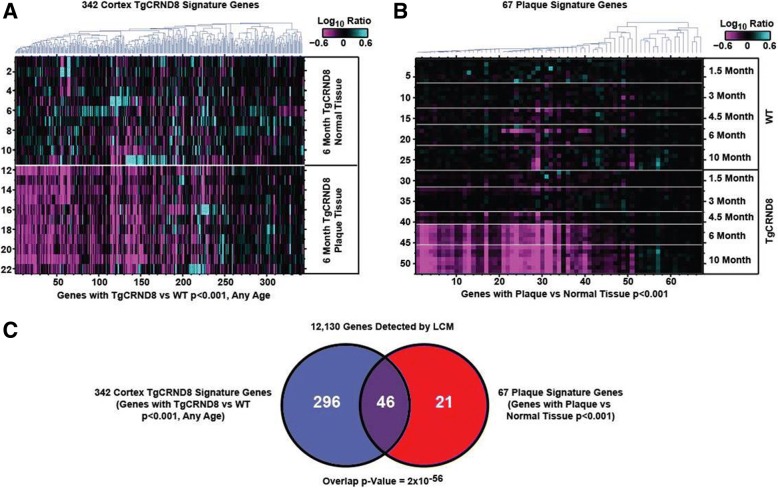
Results: We determined age-associated transcriptomic differences between two similar yet distinct APP transgenic mouse models, known to differ in proportional amyloidogenic species and plaque deposition rates. In Tg2576, human AD gene signatures were not observed despite profiling mice out to 15 months of age. TgCRND8 mice however showed progressive and robust induction of lysomal, neuroimmune, and ITIM/ITAM-associated gene signatures overlapping with prior human AD brain transcriptomic studies. Notably, RNAseq analyses highlighted the vast majority of transcriptional changes observed in aging TgCRND8 cortical brain homogenates were in fact specifically enriched within the plaque niche samples. Data uncovered plaque-associated enrichment of microglia-related genes such as ITIM/ITAM-associated genes and pathway markers of phagocytosis.

Conclusion: This work may help guide improved translational value of APP mouse models of AD, particularly for strategies aimed at targeting neuroimmune and neurodegenerative pathways, by demonstrating that TgCRND8 more closely recapitulates specific human AD-associated transcriptional responses.

Keywords: Alzheimer’s disease; Microglia; Neuroinflammation; Plaque; Transcriptomics.


Conflict of interest statement

Ethics approval and consent to participate

Principles of laboratory animal care were followed, and all studies were previously approved by the Institutional Animal Care and Use Committee and were performed in accordance to the Guide for the Care and Use of Laboratory Animals as adopted and promulgated by the National Institutes of Health (Library of Congress Control Number 2010940400, revised 2011).

Consent for publication

Not applicable

Competing interests

All authors were or are employees and shareholders in Merck & Co., Inc. at the time of their contributions. The authors declare that they have no competing interests.

Publisher’s Note

Springer Nature remains neutral with regard to jurisdictional claims in published maps and institutional affiliations.

Figures

Fig. 1
Fig. 1
Transcriptional changes in aging Tg2576 and TgCRND8 brain. a Student’s t test p value distributions for gene expression differences between WT and Tg2576 (left plot) or TgCRND8 (right plot) at different ages. Gray line indicates expected false discovery rate (FDR) given multiple test comparisons. b Heatmap showing log10 ratio values from each sample (y-axis) for each gene (x-axis) with t test p < 0.001 between Tg2576 (green) and TgCRND8 (blue) versus WT littermate controls at one or more ages. Samples are ordered manually by genotype as indicated. Genes are ordered by test and agglomerative clustering. c Heatmaps showing log10 ratio values from each sample (y-axis) for each gene (x-axis) within the indicated gene sets. Samples are ordered manually by genotype as indicated. Genes are ordered by agglomerative clustering within each set. d Signature scores (average of gene values in C ± standard deviation) for the indicated gene sets over age in Tg2576 (green) and WT littermate control (gray) as well as TgCRND8 (blue) and WT littermate controls (black)
Fig. 2
Fig. 2
Localization of TREM2 and Cd33 around amyloid-beta (Aβ) plaques in the aged TgCRND8 mouse. Brain slices were prepared from 35-week-old wild-type and TgCRND8 mice and processed for amyloid-beta immunohistochemistry (6E10 labeling, magenta) combined with TREM2 (panel a) or CD33 (panel b) in situ hybridization via RNAScope (brown). Visualization of TREM2 and Cd33 confirms their associated expression pattern with Aβ pathology, supporting the rationale for laser capture microdissection of Thio-S-labeled plaques for transcriptome-wide RNA sequencing. Representative images show section sampling for LCM and RNA seq (c, d). Images show Iba1 (brown) and 6E10 (magenta) immunostainings. Scale bars, 50 and 100 μm
Fig. 3
Fig. 3
Plaque-niche gene expression differences in 6-month-old TgCRND8. a Student’s t test p value distributions for gene expression differences plaque and normal samples in TgCRND8 cortex at 6 months of age. Gray line indicates expected false discovery rate (FDR) given multiple test comparisons. b Heatmap showing log10 ratio values from each sample (y-axis) for each gene (x-axis) with t test p value < 0.001 between plaque and normal tissue in TgCRND8 cortex. Samples are ordered manually by genotype as indicated. Genes are ordered by agglomerative clustering. c Heatmaps showing log10 ratio values from each sample (y-axis) for each gene (x-axis) within the indicated gene sets. Samples are ordered manually by genotype as indicated. Genes are ordered by agglomerative clustering within each set
Fig. 4
Fig. 4
Overlap of TgCRND8 progression signature and plaque-niche signature. a Heatmap showing log10 ratio values from each LCM sample (y-axis) for each gene (x-axis) detected in both the LCM and whole cortex studies and with t test p < 0.001 between TgCRND8 and WT cortex at one or more ages. Samples are ordered manually by genotype as indicated. Genes are ordered by agglomerative clustering. b Heatmap showing log10 ratio values from each whole cortex sample (y-axis) for each gene (x-axis) detected in both the whole cortex and LCM studies and with t test p < 0.001 between plaque and normal tissue in TgCRND8 cortex. Samples are ordered manually by genotype as indicated. Genes are ordered by agglomerative clustering. c Venn diagram depicting number of genes in common between signatures in a and b, and the associated hypergeometric p value given 12,130 genes detected in both experiments
Fig. 5
Fig. 5
Overlap of TgCRND8 progression signature and plaque-niche signature. a, b Heatmap showing log10 ratio values from each whole cortex sample (a) or each LCM sample (b) for genes reported to be expressed higher (> 1.5 fold, p < 1e-5) in the DAM population [37]. Samples are ordered manually by genotype and age as indicated. Genes are ordered by agglomerative clustering. c Venn diagram depicting number of genes in common between the Tg576/TgCRND8 whole cortex signatures (p < 0.001, any age) and the genes expressed higher (> 1.5 fold, p < 1e-5) in the DAM cells. d Venn diagram depicting number of genes in common between the TgCRND8 LCM plaque signature (p < 0.001) and the genes expressed higher (> 1.5 fold, p < 1e-5) in the DAM population

Similar articles

Cited by

References

    1. Duyckaerts C, Delatour B, Potier MC. Classification and basic pathology of Alzheimer disease. Acta Neuropathol. 2009;118:5–36. doi: 10.1007/s00401-009-0532-1. - DOI - PubMed
    1. Guillot-Sestier MV, Doty KR, Town T. Innate immunity fights Alzheimer’s disease. Trends Neurosci. 2015;38:674–681. doi: 10.1016/j.tins.2015.08.008. - DOI - PMC - PubMed
    1. Yan R, Vassar R. Targeting the beta secretase BACE1 for Alzheimer’s disease therapy. Lancet Neurol. 2014;13:319–329. doi: 10.1016/S1474-4422(13)70276-X. - DOI - PMC - PubMed
    1. Orre M, Kamphuis W, Osborn LM, Jansen AHP, Kooijman L, Bossers K, Hol EM. Isolation of glia from Alzheimer’s mice reveals inflammation and dysfunction. Neurobiol Aging. 2014;35:2746–2760. doi: 10.1016/j.neurobiolaging.2014.06.004. - DOI - PubMed
    1. Gjoneska E, Pfenning AR, Mathys H, Quon G, Kundaje A, Tsai LH, Kellis M. Conserved epigenomic signals in mice and humans reveal immune basis of Alzheimer’s disease. Nature. 2015;518:365–369. doi: 10.1038/nature14252. - DOI - PMC - PubMed

MeSH terms