

Hypertensive Disorders of Pregnancy and 10-Year Cardiovascular Risk Prediction
- PMID: 30190003
- PMCID: PMC6136445
- DOI: 10.1016/j.jacc.2018.05.077
Hypertensive Disorders of Pregnancy and 10-Year Cardiovascular Risk Prediction
Abstract
Background: Hypertensive disorders of pregnancy (HDP) affect 10% to 15% of women and are associated with a 2-fold increased risk of cardiovascular disease (CVD).
Objectives: This study sought to determine whether inclusion of HDP in an established CVD risk score improves prediction of CVD events in women.
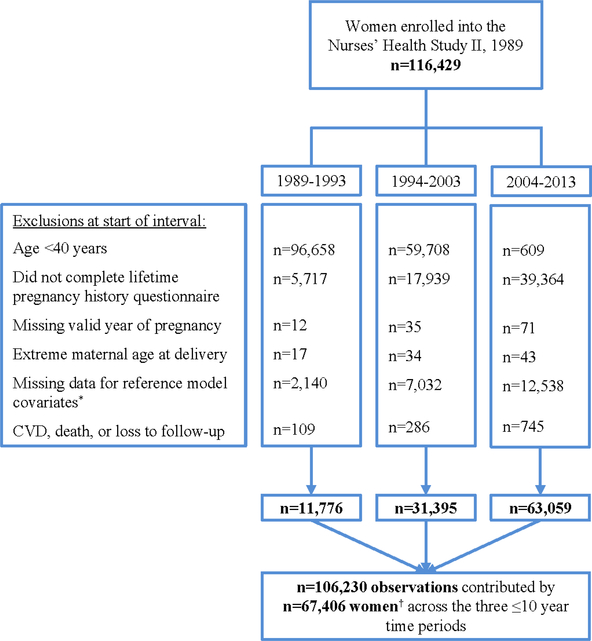
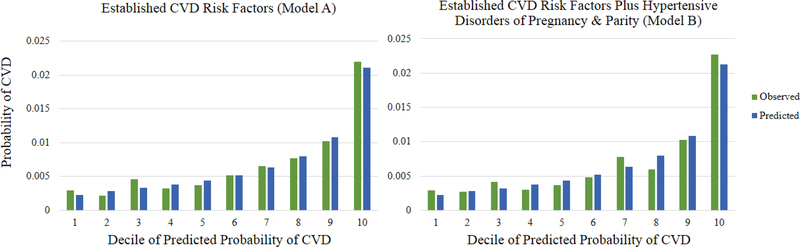
Methods: The analysis comprised 106,230 ≤10-year observations contributed by 67,406 women, age ≥40 years, free of prior CVD, with data available on model covariates in the Nurses' Health Study II. Participants were followed up for confirmed myocardial infarction, fatal coronary heart disease, or stroke from 1989 to 2013. We fit an established CVD risk prediction model (Model A: age, total cholesterol and high-density lipoprotein cholesterol, systolic blood pressure, antihypertensive medication use, current smoking, diabetes mellitus) and compared it to the same model plus HDP and parity (Model B); Cox proportional hazards models were used to obtain predicted probabilities for 10-year CVD risk.
Results: HDP and parity were associated with 10-year CVD risk independent of established CVD risk factors, overall and at ages 40 to 49 years. However, inclusion of HDP and parity in the risk prediction model did not improve discrimination (Model A: C-index = 0.691; Model B: C-index = 0.693; p value for difference = 0.31) or risk reclassification (net reclassification improvement = 0.4%; 95% confidence interval: -0.2 to 1.0%; p = 0.26).
Conclusions: In this first test of the clinical utility of HDP and parity in CVD risk prediction, additional inclusion of HDP and parity in an established risk score did not improve discrimination or reclassification in this low-risk population; this might be because of the known associations between HDP and established CVD risk factors in the reference model.
Keywords: cardiovascular disease; cardiovascular disease risk factors; pre-eclampsia; pregnancy.
Copyright © 2018 American College of Cardiology Foundation. Published by Elsevier Inc. All rights reserved.
Figures

Comment in
-
Hypertensive Disorders of Pregnancy and CVD Prediction: Accounting for Risk Accrual During the Reproductive Years.J Am Coll Cardiol. 2018 Sep 11;72(11):1264-1266. doi: 10.1016/j.jacc.2018.06.059. J Am Coll Cardiol. 2018. PMID: 30190004 No abstract available.
References
-
- Brown MC, Best KE, Pearce MS, Waugh J, Robson SC, Bell R. Cardiovascular disease risk in women with pre-eclampsia: systematic review and meta-analysis. Eur J Epidemiol 2013;28:1–19. - PubMed
-
- Schwarz G Estimating the dimension of a model. Ann Stat 1978;6.
-
- Harrell FE, Jr., Lee KL, Mark DB. Multivariable prognostic models: issues in developing models, evaluating assumptions and adequacy, and measuring and reducing errors. Stat Med 1996;15:361–87. - PubMed
-
- Pencina MJ, D'Agostino RB. Overall C as a measure of discrimination in survival analysis: model specific population value and confidence interval estimation. Stat Med 2004;23:2109–23. - PubMed
Publication types
MeSH terms
Grants and funding
LinkOut - more resources
Full Text Sources
Other Literature Sources
Medical
