. 2018 Oct 1;215(10):2509-2519.
doi: 10.1084/jem.20172082. Epub 2018 Sep 6.

Sox12 promotes T reg differentiation in the periphery during colitis

Affiliations

Sox12 promotes T reg differentiation in the periphery during colitis

Shigeru Tanaka et al. J Exp Med. .

Abstract

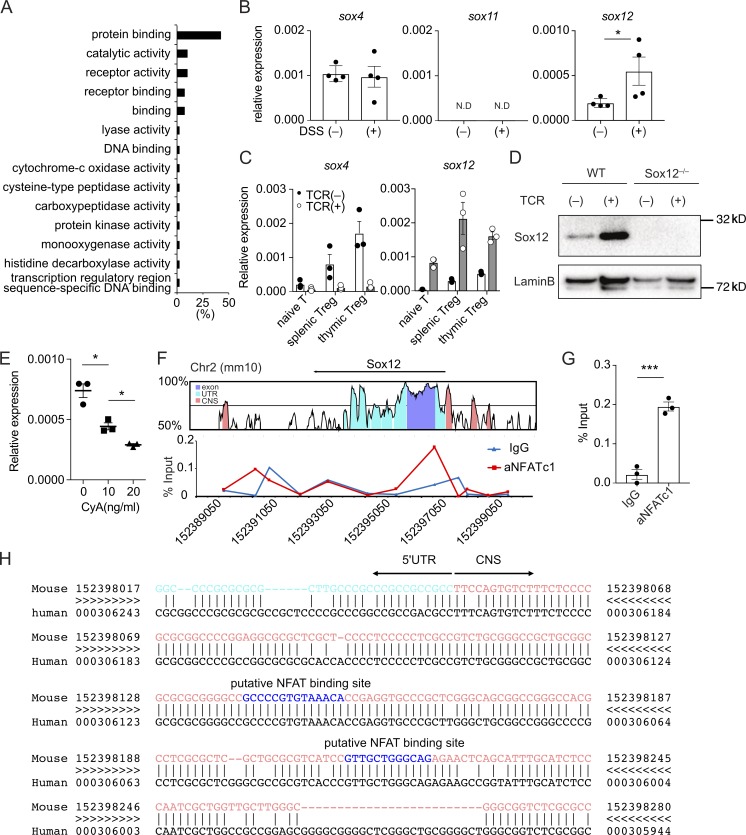
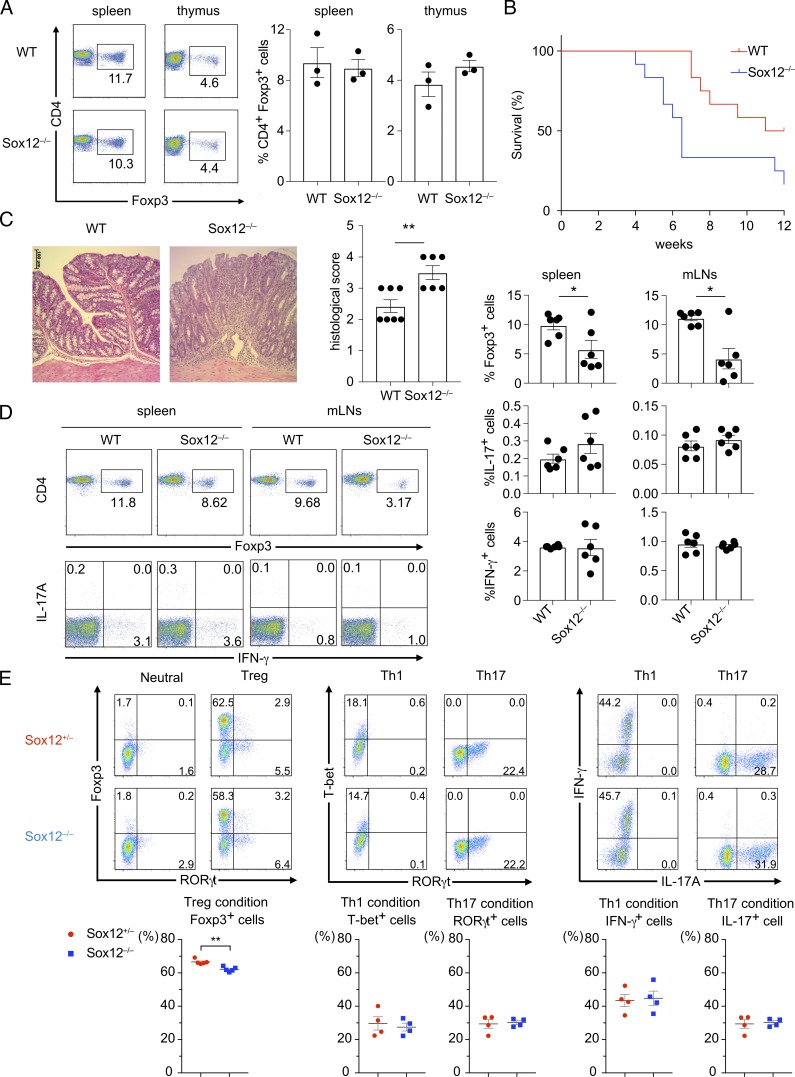
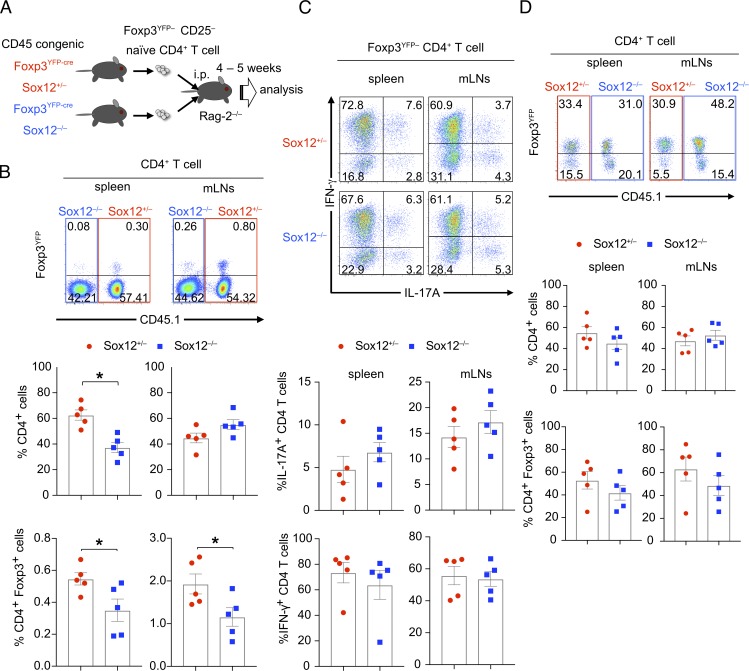
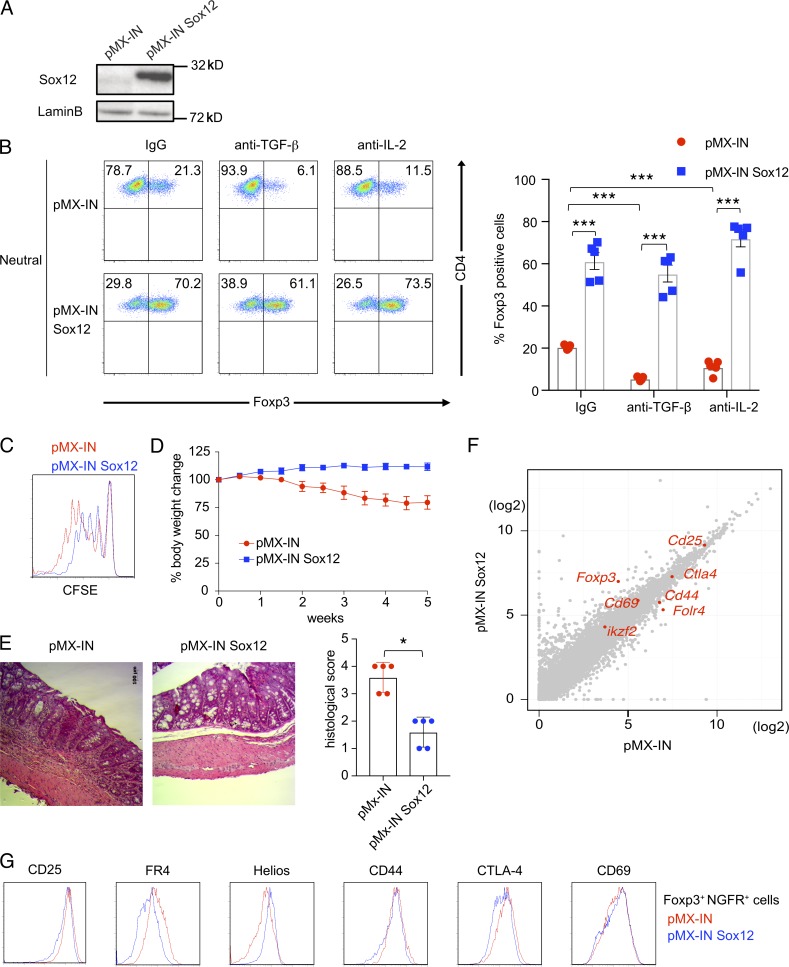
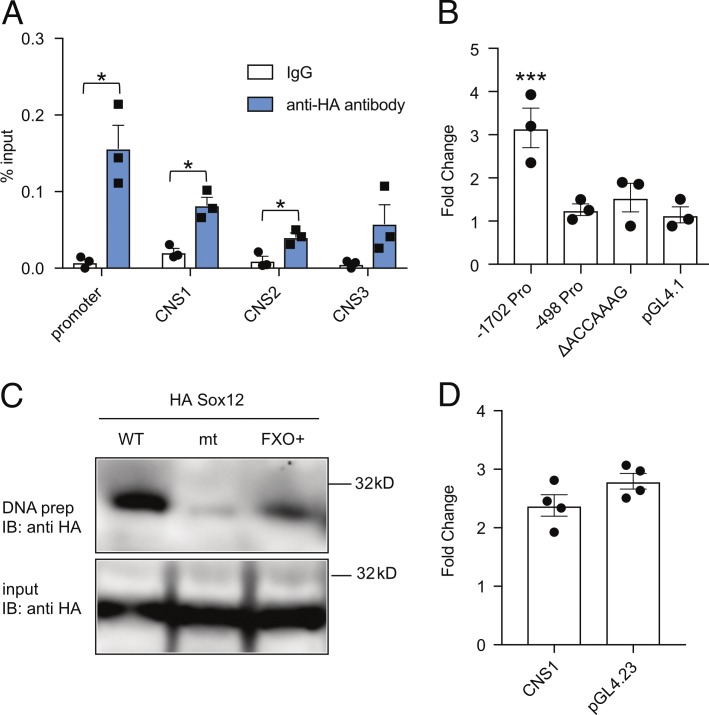
Peripherally induced regulatory T (pT reg) cells play indispensable roles in regulating gut inflammation; however, the mechanism underling the differentiation of pT reg cells under inflammatory conditions remains largely unknown. Here, we show that the expression of Sox12, a member of SoxC family, is significantly induced in T reg cells in colitic mice. We also show that TCR-NFAT signaling induces Sox12 expression in CD4+ T cells. Although Sox12 is not required for the development of thymus-derived T reg (tT reg) cells, Sox12 is involved in the development of pT reg cells under inflammatory conditions in an adoptive transfer colitis model. Moreover, we found that enforced expression of Sox12 is sufficient to promote Foxp3 expression in CD4+ T cells even in the absence of TGF-β or IL-2 and that Sox12 binds to Foxp3 promoter and drives its transcription. These results suggest that TCR-NFAT signaling induces the development of pT reg cells in colitic mice partly through Sox12 induction.


Figures

Figure 1.
Figure 1.
T cell receptor signaling induces Sox12 expression in T reg cells. (A) Gene ontology of 56 differentially expressed transcripts in splenic T reg cells from Foxp3hCD2 mice treated with or without 3% DSS water (more than twofold). (B) Quantitative PCR analysis of SoxC family genes in splenic T reg cells in mice treated with or without DSS. Data are compiled of four independent experiments. (C) Sox4 and Sox12 expression in naive CD4+ T cells, splenic T reg cells, and thymic T reg cells cultured with or without anti-CD3ε/CD28 (TCR) stimulation for 24 h. Data are compiled from three independent experiments. (D) Nuclear proteins of WT or Sox12−/− CD4+ T cells stimulated with or without TCR for 24 h were immunoblotted with antibodies against Sox12 and LaminB1. Data are representative of three independent experiments. (E) Naive CD4+ T cells were stimulated with TCR in the presence of indicated amounts of cyclosporin A (0–20 µg/ml) for 24 h, and Sox12 expression was assessed by qPCR. Data are compiled from three independent experiments. (F and G) Naive CD4+ T cells were stimulated with TCR for 4 h. ChIP-qPCR assay for Sox12 gene locus was performed with anti-NFATc1 antibody or control mouse IgG. Shown are VISTA plot of Sox12 gene locus (GRCm38/mm10, Chr2) and representative NFATc1 binding plot to Sox12 regulatory region (F) and means ± SEM of percent input of NFATc1 or control mouse IgG binding to the promoter of Sox12 gene (G). (H) Shown are 5′UTR (light blue), upstream CNS sequences (pink), and putative NFAT binding sequences (blue) of Sox12 gene analyzed by rVISTA. (C, E, and G) *, P < 0.05; ***, P < 0.001 by unpaired t test.
Figure 2.
Figure 2.
Sox12−/− naive CD4+ T cells fail to convert into pT reg cells in adoptive transfer colitis. (A) Representative FACS profiles of CD4 versus Foxp3 of CD4+ T cells harvested from spleen and thymus of WT or Sox12−/− mice are shown (left). Bar plots indicate the percent of Foxp3+ cells (right). (B–E) Naive CD4+ T cells from WT or Sox12−/− mice were transferred to RAG2−/− mice to induce adoptive transfer colitis. (B) Survival plot is depicted. Data are compiled from four independent experiments (two to three mice in each group in each experiment). (C) Shown are representative photomicrographs of H&E staining at 14 d after cell transfer (left) and means ± SEM of histopathological scores (right). Bar, 100 µm. (D) CD4+ T cells were harvested from spleen and mLNs at 14 d after cell transfer and stimulated with PMA/ionomycin for 4 h. Shown are representative FACS profiles of CD4 versus Foxp3 and IFN-γ versus IL-17A and means ± SEM of the percentages of the indicated cells. Data are compiled from three independent experiments (six mice in each group). (E) Naive CD4+ T cells from Sox12−/− mice and littermate Sox12+/− mice were stimulated under neutral, iT reg, Th1, and Th17 conditions. Representative FACS profiles of indicated transcription factors and cytokines (upper panels) and means ± SEM of the percentages of the indicated cells are shown. Data are compiled from four independent experiments (n = 4 or 5). (C, D, and E) *, P < 0.05; **, P < 0.01 by unpaired t test.
Figure 3.
Figure 3.
Intrinsic expression of Sox12 is involved in the development of pT reg cells. (A–C) Foxp3YFP− CD25 CD62Lhi CD44lo CD4+ T cells isolated from CD45 congenic Foxp3YFP-cre Sox12−/− mice and littermate Foxp3YFP-cre Sox12+/− mice were mixed in a 1:1 ratio and injected intraperitoneally to RAG2−/− mice. 4–5 wk after the transfer, spleen and mLNs were analyzed. (B) Representative FACS profiles of CD45.1 versus Foxp3YFP of CD4+ T cells from spleen and mLNs (upper panels), the percentages of Sox12−/− CD4+ T cells and Sox12+/− CD4+ T cells among CD3+ CD4+ cells (middle panels), and the percentages of Foxp3YFP+ CD4+ T cells in Sox12−/− CD4+ T cells and Sox12+/− CD4+ T cells (lower panels) are shown. Data are compiled from three independent experiments (n = 5). *, P < 0.05 by unpaired t test. (C) Cells from spleen and mLNs were stimulated with PMA/ionomycin for 4 h. Shown are representative FACS profiles of IL-17A versus IFN-γ of Sox12+/− Foxp3YFP− CD4+ T cells and Sox12−/− Foxp3YFP− CD4+ T cells and means ± SEM of the percentages of indicated cells. (D) Foxp3YFP+ CD25+ CD4+ T cells isolated from Foxp3YFP-cre Sox12−/− mice and congenically marked littermate Foxp3YFP-cre Sox12+/− mice were mixed and injected intraperitoneally to RAG2−/− mice. Representative FACS profiles of CD45.1 versus Foxp3YFP of CD4+ T cells in spleen and mLNs at 2 wk after the transfer, frequencies of Sox12−/− CD4+ T cells and Sox12+/− CD4+ T cells in CD3+ CD4+ cells (middle panels), and frequencies of Foxp3YFP+ cells in Sox12−/− CD4+ T cells and Sox12+/− CD4+ T cells (bottom panels) are shown. Data are compiled from four independent experiments (n = 5).
Figure 4.
Figure 4.
Sox12 induces the expression of Foxp3. (A) Naive CD4+ T cells were infected with retroviruses of pMX-IN-Sox12 or pMX-IN (as a control). 2 d after the infection, infected cells were isolated and subjected to immunoblotting with indicated antibodies. (B) Foxp3YFP− naive CD4+ T cells were stimulated with TCR under neutral conditions and infected with retroviruses of either pMX-IN-Sox12 or pMX-IN in the presence of anti–TGF-β, anti–IL-2, or control IgG, and the expression of Foxp3 was evaluated. Shown are representative FACS profiles (left) and means ± SEM of the percentages of Foxp3+ CD4+ T cells (right) compiled from four independent experiments. ***, P < 0.001 by one-way ANOVA followed by Dunnett’s test. (C) Naive CD4+ T cells were stimulated with TCR and infected with retroviruses of either pMX-IN-Sox12 or pMX-IN for 24 h. Cells were then stimulated with TCR for additional 2 d. Infected human NGFR+ cells were sorted and co-cultured with CFSE-labeled responder naive CD4+ T cells. Shown is a representative CFSE fluorescence intensity 3 d after co-culture. (D and E) Naive CD4+ cells were transferred to RAG2−/− mice to develop adoptive transfer colitis. Where indicated, pMX-IN-Sox12–infected CD4+ T cells or pMX-IN–infected CD4+ T cells (as a control) were cotransferred to the mice. (D) Shown are changes in body weight after cell transfer. Data are compiled from three independent experiments (two to three mice in each group in each experiment). (E) Shown are representative photomicrographs of colons and means ± SEM of histopathological scores. *, P < 0.05 by unpaired t test. Bar, 100 µm. (F) A scatter plot of RNA-Seq (log2 RPKM) for all coding transcripts in pMX-IN-Sox12–infected CD4+ T cells versus pMX-IN–infected CD4+ T cells. Representative T reg–associated transcripts are shown in red. (G) Representative histograms of T reg–associated molecules in Foxp3+ CD4+ NGFR+ cells in WT CD4+ T cells infected with pMX-IN-Sox12 (blue) or pMX-IN (red) viruses.
Figure 5.
Figure 5.
Sox12 binds to and activates the promoter of Foxp3. (A) Naive CD4+ T cells were infected with retrovirus of pMX-IN-HA-Sox12, and cells were restimulated with TCR for additional 12 h. ChIP-qPCR assay for the promoter and CNSs of Foxp3 gene locus was performed with anti-HA antibody or control rabbit IgG. Data are compiled from three independent experiments. (B) Luciferase assay with indicated Foxp3 promoter Luci constructs in EL4 cells. Data are compiled from three independent experiments. (C) DNA precipitation assays of HA-Sox12 with biotinylated double-stranded DNA probes containing a portion of Foxp3 promoter or its mutant at Sox12-binding site (ΔACCAAAG) were performed. FXO+ probe was used as a positive control. Shown are representative of three independent experiments. (D) Luciferase assays with pGL4.23-Foxp3 CNS1 enhancer-Luci construct or pGL4.23 (as a control) were performed in EL4 cells. Data are compiled from four independent experiments. (A and B) *, P < 0.05; ***, P < 0.001 by unpaired t test.

References

    1. Ai T.L., Solomon B.D., and Hsieh C.S.. 2014. T-cell selection and intestinal homeostasis. Immunol. Rev. 259:60–74. 10.1111/imr.12171 - DOI - PMC - PubMed
    1. Arpaia N., Campbell C., Fan X., Dikiy S., van der Veeken J., deRoos P., Liu H., Cross J.R., Pfeffer K., Coffer P.J., and Rudensky A.Y.. 2013. Metabolites produced by commensal bacteria promote peripheral regulatory T-cell generation. Nature. 504:451–455. 10.1038/nature12726 - DOI - PMC - PubMed
    1. Arvey A., van der Veeken J., Samstein R.M., Feng Y., Stamatoyannopoulos J.A., and Rudensky A.Y.. 2014. Inflammation-induced repression of chromatin bound by the transcription factor Foxp3 in regulatory T cells. Nat. Immunol. 15:580–587. 10.1038/ni.2868 - DOI - PMC - PubMed
    1. Asseman C., Mauze S., Leach M.W., Coffman R.L., and Powrie F.. 1999. An essential role for interleukin 10 in the function of regulatory T cells that inhibit intestinal inflammation. J. Exp. Med. 190:995–1004. 10.1084/jem.190.7.995 - DOI - PMC - PubMed
    1. Barnes M.J., and Powrie F.. 2009. Regulatory T cells reinforce intestinal homeostasis. Immunity. 31:401–411. 10.1016/j.immuni.2009.08.011 - DOI - PubMed

Publication types

MeSH terms

Substances