

Early Appearance and Spread of Fast Ripples in the Hippocampus in a Model of Cortical Traumatic Brain Injury
- PMID: 30190413
- PMCID: PMC6705981
- DOI: 10.1523/JNEUROSCI.3507-17.2018
Early Appearance and Spread of Fast Ripples in the Hippocampus in a Model of Cortical Traumatic Brain Injury
Abstract
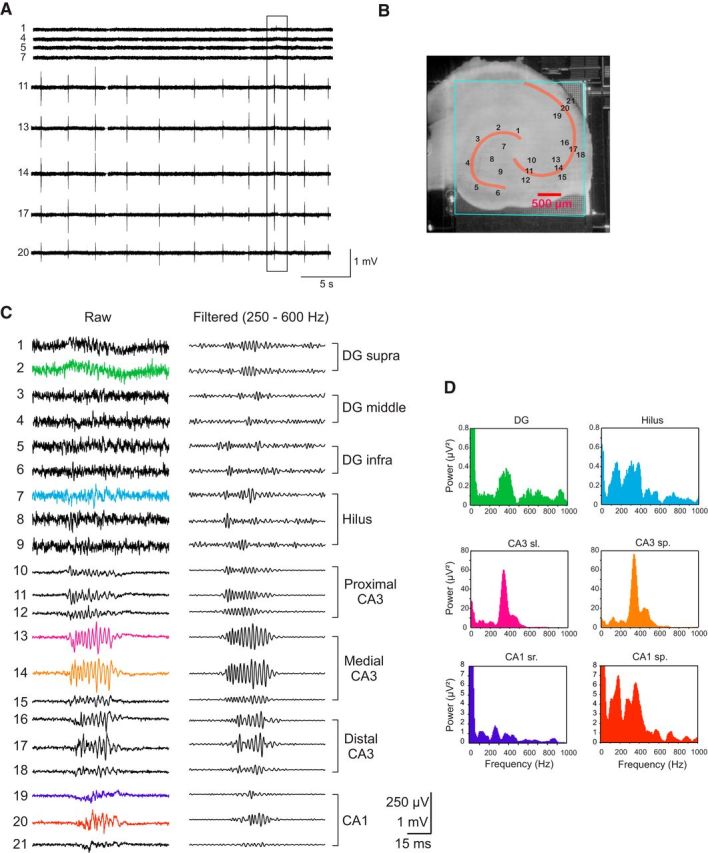
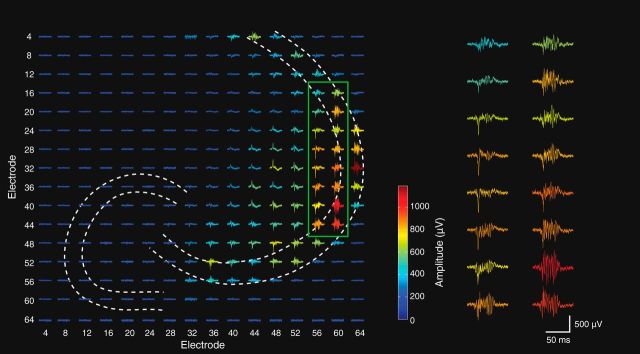
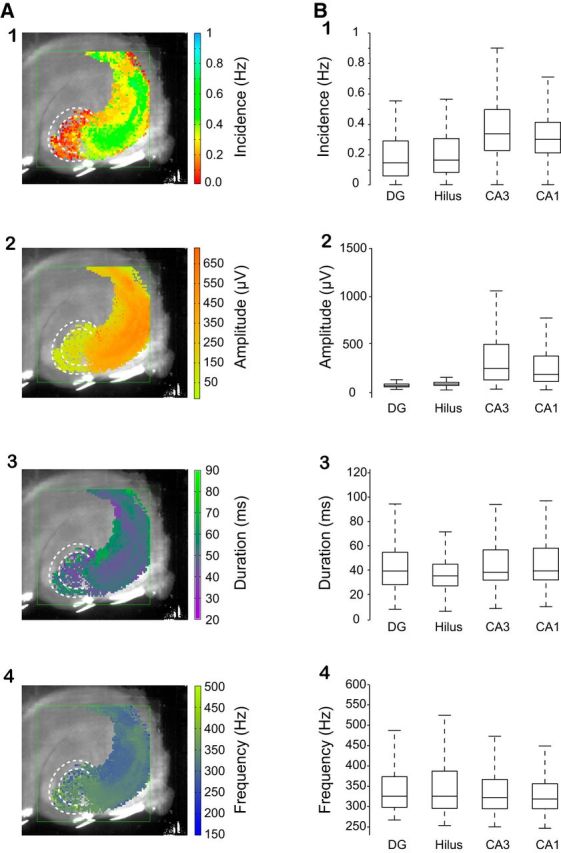
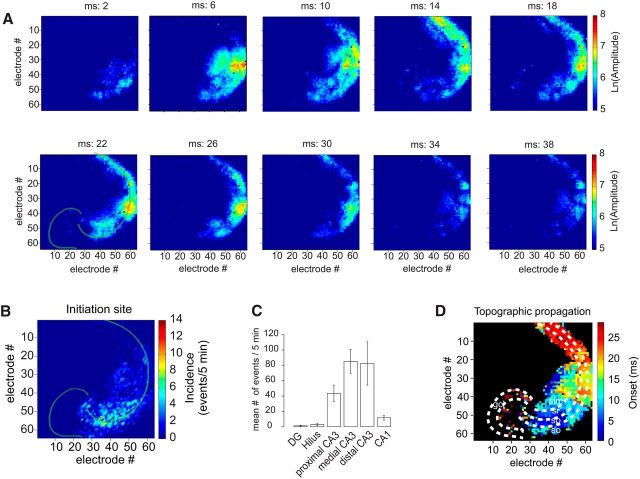
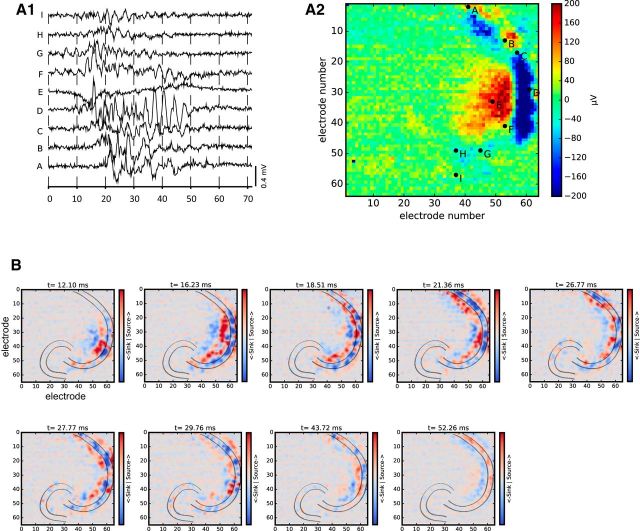
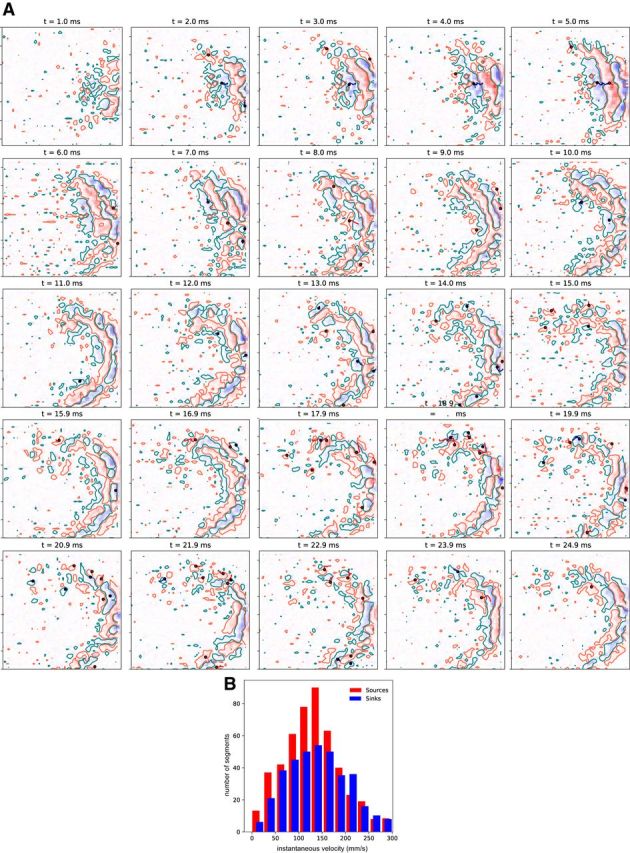
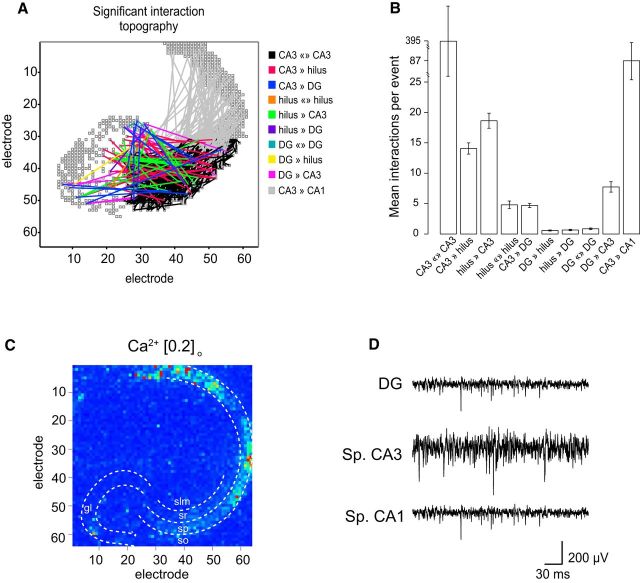
Fast ripples (FRs; activity of >250 Hz) have been considered as a biomarker of epileptic activity in the hippocampus and entorhinal cortex; it is thought that they signal the focus of seizure generation. Similar high-frequency network activity has been produced in vitro by changing extracellular medium composition, by using pro-epileptic substances, or by electrical stimulation. Here we study the propagation of these events between different subregions of the male rat hippocampus in a recently introduced experimental model of FRs in entorhinal cortex-hippocampal slices in vitro By using a matrix of 4096 microelectrodes, the sites of initiation, propagation pathways, and spatiotemporal characteristics of activity patterns could be studied with unprecedented high resolution. To this end, we developed an analytic tool based on bidimensional current source density estimation, which delimits sinks and sources with a high precision and evaluates their trajectories using the concept of center of mass. With this methodology, we found that FRs can arise almost simultaneously at noncontiguous sites in the CA3-to-CA1 direction, underlying the spatial heterogeneity of epileptogenic foci, while continuous somatodendritic waves of activity develop. An unexpected, yet important propagation route is the propagation of activity from CA3 into the hilus and dentate gyrus. This pathway may cause reverberating activation of both regions, supporting sustained pathological network events and altered information processing in hippocampal networks.SIGNIFICANCE STATEMENT Fast ripples (FRs) have been considered as a biomarker of epileptic activity and may signal the focus of seizure generation. In a model of traumatic brain injury in the rat, FRs appear in the hippocampus within a couple of hours after an extrahippocampal, cortical lesion. We analyzed the origin and dynamics of the FRs in the hippocampus using massive electrophysiological recordings, allowing an unprecedented high spatiotemporal resolution. We show that FRs originate in distinct and noncontiguous locations within the CA3 region and uncover, with high precision, the extent and dynamics of their current density. This activity propagates toward CA1 but also backpropagates to the hilus and the dentate gyrus, suggesting activation of defined microcircuits that can sustain recurrent excitation.
Keywords: ca3; dentate gyrus; epilepsy; fast ripples; hippocampus; traumatic brain injury.
Copyright © 2018 the authors 0270-6474/18/389034-13$15.00/0.
Figures
Similar articles
-
Entorhinal cortex lesions result in adenosine-sensitive high frequency oscillations in the hippocampus.Exp Neurol. 2015 Sep;271:319-28. doi: 10.1016/j.expneurol.2015.06.009. Epub 2015 Jun 10. Exp Neurol. 2015. PMID: 26072121
-
Hippocampal and entorhinal cortex high-frequency oscillations (100--500 Hz) in human epileptic brain and in kainic acid--treated rats with chronic seizures.Epilepsia. 1999 Feb;40(2):127-37. doi: 10.1111/j.1528-1157.1999.tb02065.x. Epilepsia. 1999. PMID: 9952257
-
Local generation of fast ripples in epileptic brain.J Neurosci. 2002 Mar 1;22(5):2012-21. doi: 10.1523/JNEUROSCI.22-05-02012.2002. J Neurosci. 2002. PMID: 11880532 Free PMC article.
-
Do interictal discharges promote or control seizures? Experimental evidence from an in vitro model of epileptiform discharge.Epilepsia. 2001;42 Suppl 3:2-4. doi: 10.1046/j.1528-1157.2001.042suppl.3002.x. Epilepsia. 2001. PMID: 11520313 Review.
-
Interictal-ictal interactions and limbic seizure generation.Rev Neurol (Paris). 1999 Jul;155(6-7):468-71. Rev Neurol (Paris). 1999. PMID: 10472661 Review.
Cited by
-
Causal relationship of CA3 back-projection to the dentate gyrus and its role in CA1 fast ripple generation.BMC Neurosci. 2021 May 17;22(1):37. doi: 10.1186/s12868-021-00641-4. BMC Neurosci. 2021. PMID: 34001031 Free PMC article.
-
Networks through the lens of high-frequency oscillations.Front Netw Physiol. 2024 Nov 28;4:1462672. doi: 10.3389/fnetp.2024.1462672. eCollection 2024. Front Netw Physiol. 2024. PMID: 39679263 Free PMC article. Review.
-
Neuronal Glutamatergic Network Electrically Wired with Silent But Activatable Gap Junctions.J Neurosci. 2020 Jun 10;40(24):4661-4672. doi: 10.1523/JNEUROSCI.2590-19.2020. Epub 2020 May 11. J Neurosci. 2020. PMID: 32393538 Free PMC article.
-
High-Frequency Oscillations and Epileptogenic Network.Curr Neuropharmacol. 2022 Aug 3;20(9):1687-1703. doi: 10.2174/1570159X19666210908165641. Curr Neuropharmacol. 2022. PMID: 34503414 Free PMC article.
-
GABAA Receptor-Stabilizing Protein Ubqln1 Affects Hyperexcitability and Epileptogenesis after Traumatic Brain Injury and in a Model of In Vitro Epilepsy in Mice.Int J Mol Sci. 2022 Mar 31;23(7):3902. doi: 10.3390/ijms23073902. Int J Mol Sci. 2022. PMID: 35409261 Free PMC article.
References
-
- Bezanson J, Edelman A, Karpinski S, Shah VB (2017) Julia: a fresh approach to numerical computing. SIAM Rev 59:65–98. 10.1137/141000671 - DOI
Publication types
MeSH terms
LinkOut - more resources
Full Text Sources
Other Literature Sources
Medical
Miscellaneous