. 2018 Sep 18;115(38):9473-9478.
doi: 10.1073/pnas.1807405115. Epub 2018 Sep 6.

Simultaneous polymerization and adhesion under hypoxia in sickle cell disease

Affiliations

Simultaneous polymerization and adhesion under hypoxia in sickle cell disease

Dimitrios P Papageorgiou et al. Proc Natl Acad Sci U S A. .

Abstract

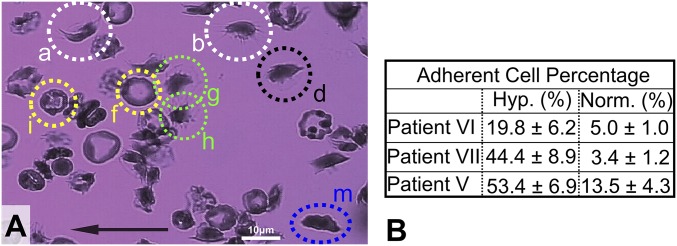
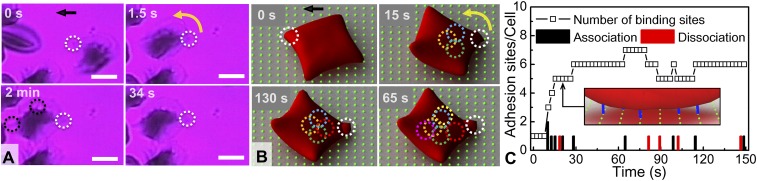
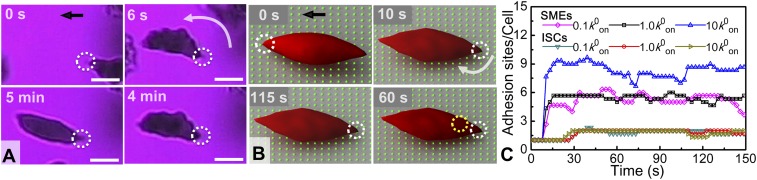
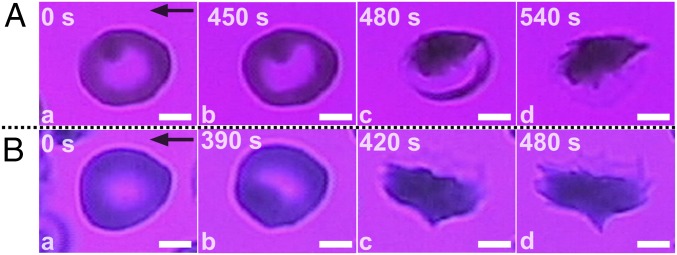
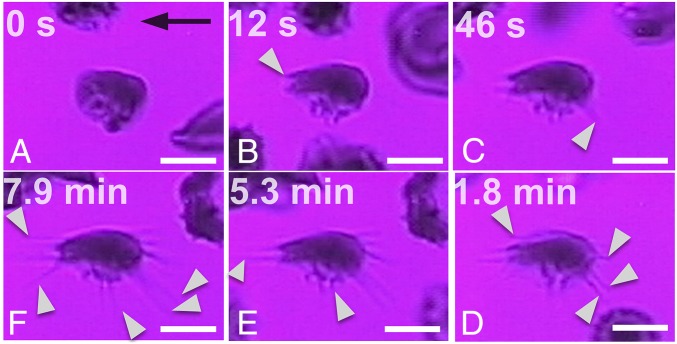
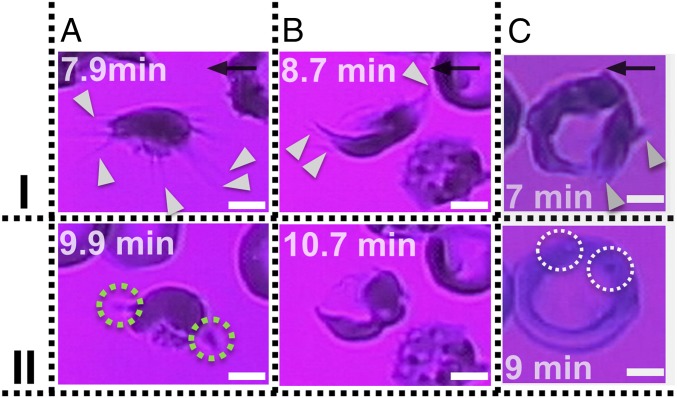
Polymerization and adhesion, dynamic processes that are hallmarks of sickle cell disease (SCD), have thus far been studied in vitro only separately. Here, we present quantitative results of the simultaneous and synergistic effects of adhesion and polymerization of deoxygenated sickle hemoglobin (HbS) in the human red blood cell (RBC) on the mechanisms underlying vasoocclusive pain crisis. For this purpose, we employ a specially developed hypoxic microfluidic platform, which is capable of inducing sickling and unsickling of RBCs in vitro, to test blood samples from eight patients with SCD. We supplemented these experimental results with detailed molecular-level computational simulations of cytoadherence and biorheology using dissipative particle dynamics. By recourse to image analysis techniques, we characterize sickle RBC maturation stages in the following order of the degree of adhesion susceptibility under hypoxia: sickle reticulocytes in circulation (SRs) → sickle mature erythrocytes (SMEs) → irreversibly sickled cells (ISCs). We show that (i) hypoxia significantly enhances sickle RBC adherence; (ii) HbS polymerization enhances sickle cell adherence in SRs and SMEs, but not in ISCs; (iii) SRs exhibit unique adhesion dynamics where HbS fiber projections growing outward from the cell surface create multiple sites of adhesion; and (iv) polymerization stimulates adhesion and vice versa, thereby establishing the bidirectional coupling between the two processes. These findings offer insights into possible mechanistic pathways leading to vasoocclusion crisis. They also elucidate the processes underlying the onset of occlusion that may involve circulating reticulocytes, which are more abundant in hemolytic anemias due to robust compensatory erythropoiesis.

Keywords: HbS polymerization; dissipative particle dynamics; hypoxia; microfluidics; sickle cell adhesion dynamics.


Conflict of interest statement

Conflict of interest statement: D.P.P., S.Z.A., M.D., and S.S. have filed a patent based on the work presented in this paper.

Figures

Fig. 1.
Fig. 1.
Hypoxia significantly enhances adhesion of sickle RBCs on a FN-coated microchannel wall. (A) Morphological heterogeneity of adherent sickle cells under steady-state hypoxia and shear flow in a single FOV over about 10 min. Examples of cell types: (i) SRs: a and b (white dotted circles); (ii) SMEs: d, g, h, i, and f (green, yellow, and black dotted circles); and (iii) ISCs: cell m (blue dotted ellipse). The black arrow denotes the flow direction. Wall shear stress, ∼0.05 Pa. (Scale bar: 10 μm.) Area of FOV, ∼5,766 μm2 (Movie S1). (B) Increase in adherent cell percentage in hypoxia compared with normoxia (see Table S1). The entries here indicate values of mean ± SD.
Fig. 2.
Fig. 2.
SME adherence and polymerization: From single-site to multiple-site adhesion. (A) Experiment: cell g of Fig. 1A. (t = 0) The cell adheres on the surface (white dotted circle) while forming a pointed membrane edge (slow-motion Movie S2). (1.5 s < t < 34 s) The cell revolves around the adhesion site and oscillates under flow. (t = 2 min) Such oscillatory motion ceases and the cell becomes firmly adherent. The dotted black circles indicate polymerized HbS fiber bundles growing within the cell membrane (Movie S3). The black arrow denotes the direction of flow. Wall shear stress, ∼0.05 Pa. FN-coated microchannel wall. (Scale bar: 5 μm.) Area of FOV, ∼450 μm2. (B) Simulation results: Adhesion dynamics of an SME at t = 0, 15, 65, and 130 s (Movie S4). Wall shear stress, ∼0.04 Pa. The green dots in the background matrix represent an array of ligands that simulate a FN-coated adhesion surface, and the dotted circles correspond to effective adhesion binding sites between cell receptors and surface ligands. Initially, the cell has only one adhesion site (white dotted circle); then additional adhesion sites are formed over time (colored dotted circles). (C) Number of adhesion sites per cell as a function of time. Instantaneous number of adhesion bond formation (black column) and bond dissociation (red column). Inset shows a diagram of the adhesion interaction between the cell and coated surface, where the blue lines represent the adhesion binding sites.
Fig. 3.
Fig. 3.
ISC adhesive dynamics. (A) Experiment: successive snapshots of the ISC adherence (cell m, Fig. 1). (t = 0) Onset of cell adhesion on the surface, with the adhesion site marked within a white dotted circle in all cases. (t = 6 s) The cell flips around the adhesion site to align with the flow direction (Movie S8). (6 s < t < 4 min) The cell exhibits an oscillatory motion due to shear flow. (t = 5 min) Reoxygenation: the cell recovers its normoxia shape and maintains its surface adhesion site even after reoxygenation (without detachment). Wall shear stress, ∼0.05 Pa. The black arrow denotes the flow direction. (Scale bars: 5 μm.) Area of FOV, ∼255 μm2. (B) Simulation: quantitative characterization of the ISC adhesion dynamics with snapshots at t = 0, 10, 60, and 115 s (Movie S9). The dotted circles indicate receptor/ligand binding sites. (C) Average number of adhesion sites/cell as a function of time, from the simulation, for SMEs and ISCs at different bond formation rates, where k0on is an equilibrium rate defined in SI Appendix, Eq. S1.
Fig. 4.
Fig. 4.
Adhesion stimulates polymerization in SMEs under hypoxia through a variety of transition mechanisms and residence times. (A) (t = 0) Initial cell attachment on the FN-coated wall surface. Localized area darkening is interpreted as regional accumulation of Hb within the cell. (t = 450 s) Cell morphology at the onset of transition; slight intracellular Hb content reorganization is evident. (t = 480 s) Bulk polymerized part of the cell is revealed. (t = 540 s) The cell attains its hypoxia shape (cell d in Movie S1). Wall shear stress, ∼0.05 Pa. Area of FOV, ∼102 μm2. (B) (t = 0) Initial cell attachment on the FN-coated wall surface. (t = 390 s) Cell morphology at the onset of transition. (t = 420 s) Apparent snap-through transition. (t = 480 s) The cell attains its hypoxia shape, and underlying adhesion sites are revealed (SI Appendix, Fig. S5). Wall shear stress, ∼0.08 Pa. Area of FOV, ∼120 μm2. Black arrows denote flow direction. (Scale bars: 2.5 μm.)
Fig. 5.
Fig. 5.
Simultaneous adhesion and polymerization in SRs under hypoxia and shear flow (cell b in Fig. 1), observed at different time points (AF). (t = 0) The cell adheres on the surface. (9 s < t < 1.8 min) Gradual protrusion of polymerized HbS fibers (white pointers) and apparent increase of the overall projected bulk cell surface area. (54 s < t < 7.9 min) Fiber bundles continue to grow outward of the bulk of the cell (white pointers) (Movie S5). The black arrow denotes the flow direction. Wall shear stress, ∼0.05 Pa. FN-coated microchannel wall. (Scale bar: 5 μm.) Area of FOV, ∼290 μm2.
Fig. 6.
Fig. 6.
Reoxygenation in SR1s (A and B) and SR2 (C) reticulocytes; polymerized HbS fiber bundles retract after reoxygenation. (I) Adherent cells under hypoxia for up to 9 min; onset of reoxygenation (II) after 2 min of reoxygenation. (A) SR1 of Fig. 5: (t = 9.9 min) The polymerized HbS fibers retract back to the cell bulk. The green dotted circles indicate residual adhesion sites (Movie S10). (B) SR1 of SI Appendix, Fig. S6: (t = 10.7 min) The polymerized HbS fibers retract back to the cell bulk (Movie S11). (C) SR2 of Movie S12: HbS polymer projections (white pointers) have grown outside of the cell’s ring. (t = 9 min) Reoxygenation shows that the SR2 recovers the “deep-dish” morphology. The white dotted circles show the visible granules within the refractile ring. Wall shear stress, ∼0.05 Pa. The black arrows denote flow direction. (Scale bars: 2.5 μm.)

Similar articles

Cited by

References

    1. Hebbel RP. Adhesion of sickle red cells to endothelium: Myths and future directions. Transfus Clin Biol. 2008;15:14–18. - PubMed
    1. Hebbel RP. Beyond hemoglobin polymerization: The red blood cell membrane and sickle disease pathophysiology. Blood. 1991;77:214–237. - PubMed
    1. Hebbel RP, et al. Abnormal adherence of sickle erythrocytes to cultured vascular endothelium: Possible mechanism for microvascular occlusion in sickle cell disease. J Clin Invest. 1980;65:154–160. - PMC - PubMed
    1. Kaul DK, Fabry ME, Nagel RL. Microvascular sites and characteristics of sickle cell adhesion to vascular endothelium in shear flow conditions: Pathophysiological implications. Proc Natl Acad Sci USA. 1989;86:3356–3360. - PMC - PubMed
    1. Hebbel RP, Boogaerts MAB, Eaton JW, Steinberg MH. Erythrocyte adherence to endothelium in sickle-cell anemia. A possible determinant of disease severity. N Engl J Med. 1980;302:992–995. - PubMed

Publication types

Substances