

Structural basis for activation of voltage sensor domains in an ion channel TPC1
- PMID: 30190435
- PMCID: PMC6166827
- DOI: 10.1073/pnas.1805651115
Structural basis for activation of voltage sensor domains in an ion channel TPC1
Abstract
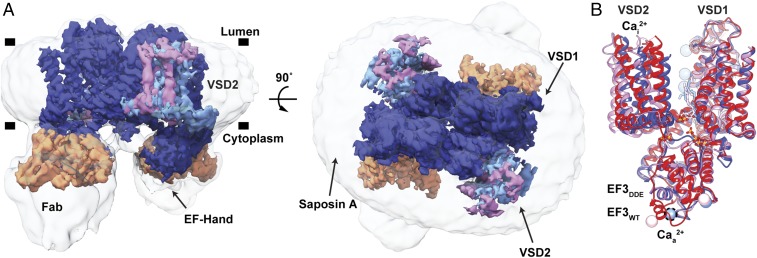
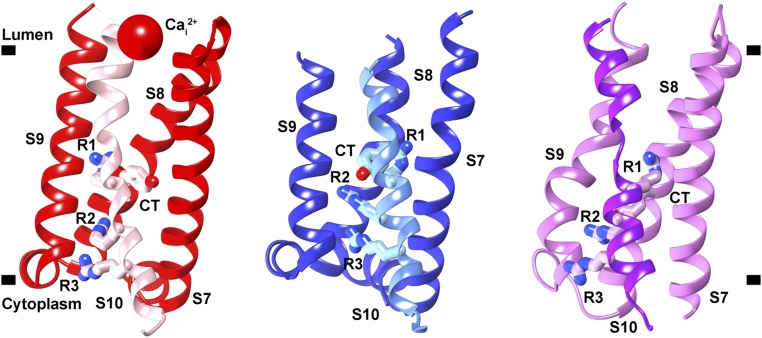
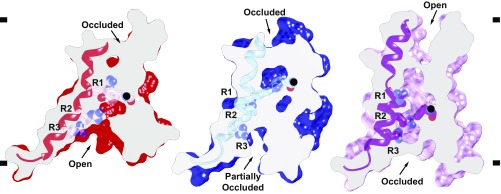
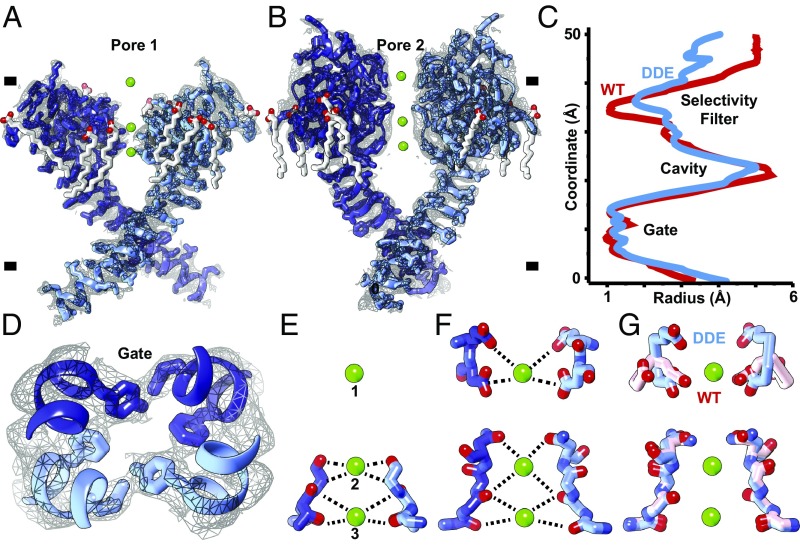
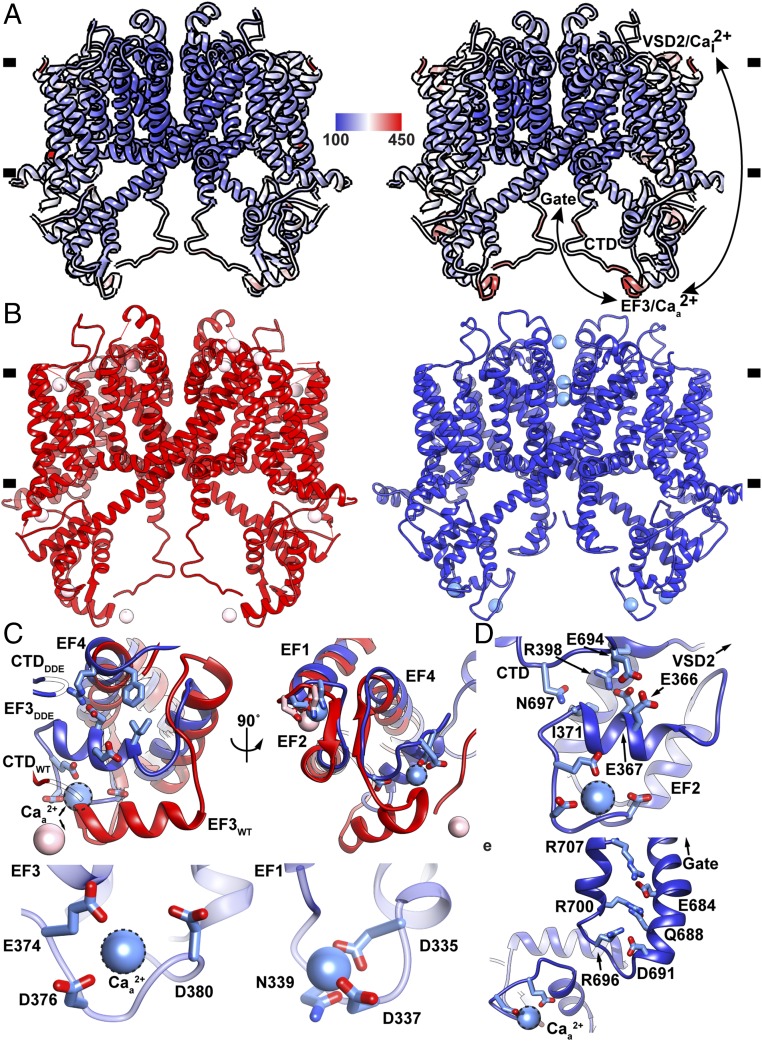
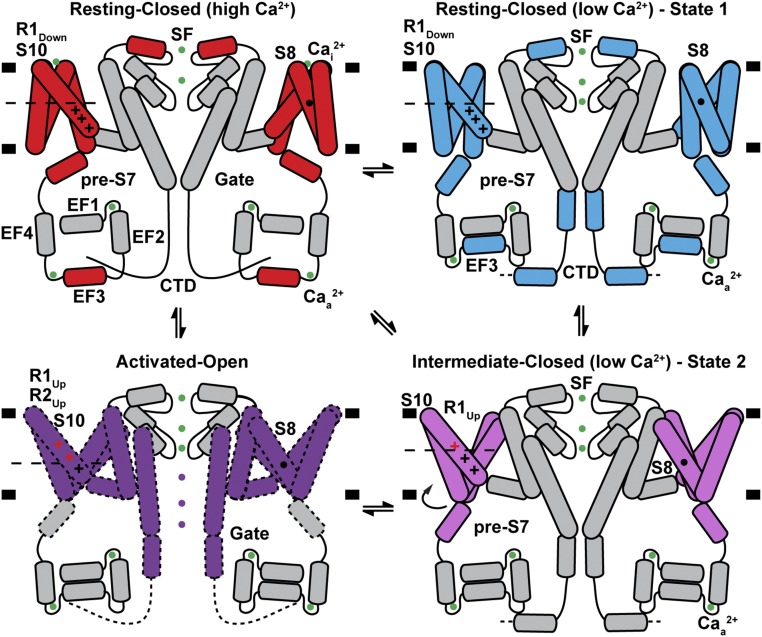
Voltage-sensing domains (VSDs) couple changes in transmembrane electrical potential to conformational changes that regulate ion conductance through a central channel. Positively charged amino acids inside each sensor cooperatively respond to changes in voltage. Our previous structure of a TPC1 channel captured an example of a resting-state VSD in an intact ion channel. To generate an activated-state VSD in the same channel we removed the luminal inhibitory Ca2+-binding site (Cai2+), which shifts voltage-dependent opening to more negative voltage and activation at 0 mV. Cryo-EM reveals two coexisting structures of the VSD, an intermediate state 1 that partially closes access to the cytoplasmic side but remains occluded on the luminal side and an intermediate activated state 2 in which the cytoplasmic solvent access to the gating charges closes, while luminal access partially opens. Activation can be thought of as moving a hydrophobic insulating region of the VSD from the external side to an alternate grouping on the internal side. This effectively moves the gating charges from the inside potential to that of the outside. Activation also requires binding of Ca2+ to a cytoplasmic site (Caa2+). An X-ray structure with Caa2+ removed and a near-atomic resolution cryo-EM structure with Cai2+ removed define how dramatic conformational changes in the cytoplasmic domains may communicate with the VSD during activation. Together four structures provide a basis for understanding the voltage-dependent transition from resting to activated state, the tuning of VSD by thermodynamic stability, and this channel's requirement of cytoplasmic Ca2+ ions for activation.
Keywords: X-ray crystallography; cryo-EM; ion channel; two pore channnel; voltage sensor.
Conflict of interest statement
The authors declare no conflict of interest.
Figures
Similar articles
-
Structure, inhibition and regulation of two-pore channel TPC1 from Arabidopsis thaliana.Nature. 2016 Mar 10;531(7593):258-62. doi: 10.1038/nature17194. Nature. 2016. PMID: 26961658 Free PMC article.
-
Structure of the voltage-gated two-pore channel TPC1 from Arabidopsis thaliana.Nature. 2016 Mar 10;531(7593):196-201. doi: 10.1038/nature16446. Epub 2015 Dec 21. Nature. 2016. PMID: 26689363 Free PMC article.
-
Gating of the two-pore cation channel AtTPC1 in the plant vacuole is based on a single voltage-sensing domain.Plant Biol (Stuttg). 2016 Sep;18(5):750-60. doi: 10.1111/plb.12478. Epub 2016 Jul 12. Plant Biol (Stuttg). 2016. PMID: 27270880
-
Emerging issues of connexin channels: biophysics fills the gap.Q Rev Biophys. 2001 Aug;34(3):325-472. doi: 10.1017/s0033583501003705. Q Rev Biophys. 2001. PMID: 11838236 Review.
-
TPC1 vacuole SV channel gains further shape - voltage priming of calcium-dependent gating.Trends Plant Sci. 2023 Jun;28(6):673-684. doi: 10.1016/j.tplants.2023.01.001. Epub 2023 Feb 4. Trends Plant Sci. 2023. PMID: 36740491 Review.
Cited by
-
Yeast as a tool for membrane protein production and structure determination.FEMS Yeast Res. 2022 Oct 20;22(1):foac047. doi: 10.1093/femsyr/foac047. FEMS Yeast Res. 2022. PMID: 36175165 Free PMC article.
-
3D-aligned tetrameric ion channels with universal residue labels for comparative structural analysis.Biophys J. 2025 Jan 21;124(2):458-470. doi: 10.1016/j.bpj.2024.12.019. Epub 2024 Dec 17. Biophys J. 2025. PMID: 39696821
-
Voltage-gating and cytosolic Ca2+ activation mechanisms of Arabidopsis two-pore channel AtTPC1.Proc Natl Acad Sci U S A. 2021 Dec 7;118(49):e2113946118. doi: 10.1073/pnas.2113946118. Proc Natl Acad Sci U S A. 2021. PMID: 34845029 Free PMC article.
-
DirectMX - One-Step Reconstitution of Membrane Proteins From Crude Cell Membranes Into Salipro Nanoparticles.Front Bioeng Biotechnol. 2020 Mar 19;8:215. doi: 10.3389/fbioe.2020.00215. eCollection 2020. Front Bioeng Biotechnol. 2020. PMID: 32266242 Free PMC article.
-
TPC1-Type Channels in Physcomitrium patens: Interaction between EF-Hands and Ca2.Plants (Basel). 2022 Dec 15;11(24):3527. doi: 10.3390/plants11243527. Plants (Basel). 2022. PMID: 36559639 Free PMC article.
References
-
- Hille B. Ion Channels of Excitable Membranes. 3rd Ed Sinauer; Sunderland, MA: 2001.
-
- Aggarwal SK, MacKinnon R. Contribution of the S4 segment to gating charge in the Shaker K+ channel. Neuron. 1996;16:1169–1177. - PubMed
-
- Seoh S-A, Sigg D, Papazian DM, Bezanilla F. Voltage-sensing residues in the S2 and S4 segments of the Shaker K+ channel. Neuron. 1996;16:1159–1167. - PubMed
-
- Catterall WA. Molecular properties of voltage-sensitive sodium channels. Annu Rev Biochem. 1986;55:953–985. - PubMed
Publication types
MeSH terms
Substances
Associated data
- Actions
- Actions
- Actions
- Actions
- Actions
Grants and funding
- R01 GM024485/GM/NIGMS NIH HHS/United States
- P41 GM103311/GM/NIGMS NIH HHS/United States
- HHMI/Howard Hughes Medical Institute/United States
- S10 OD020054/OD/NIH HHS/United States
- P30 EY000331/EY/NEI NIH HHS/United States
- R01 EY005216/EY/NEI NIH HHS/United States
- U54 GM087519/GM/NIGMS NIH HHS/United States
- R01 GM117372/GM/NIGMS NIH HHS/United States
- R37 EY005216/EY/NEI NIH HHS/United States
- P41 GM103393/GM/NIGMS NIH HHS/United States
- R01 GM098672/GM/NIGMS NIH HHS/United States
- R37 GM024485/GM/NIGMS NIH HHS/United States
- S10 OD021741/OD/NIH HHS/United States
LinkOut - more resources
Full Text Sources
Other Literature Sources
Research Materials
Miscellaneous
