. 2018 Sep 6;9(1):3622.
doi: 10.1038/s41467-018-05933-8.

LincRNA H19 protects from dietary obesity by constraining expression of monoallelic genes in brown fat

Affiliations

LincRNA H19 protects from dietary obesity by constraining expression of monoallelic genes in brown fat

Elena Schmidt et al. Nat Commun. .

Abstract

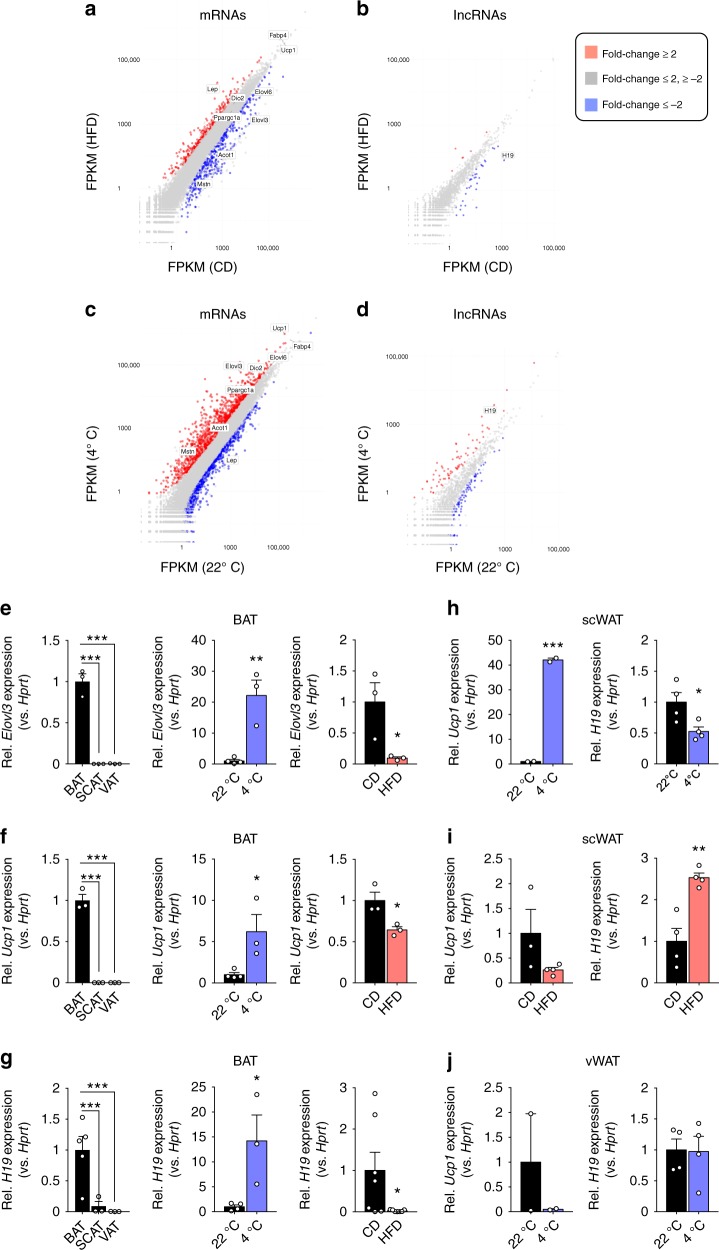
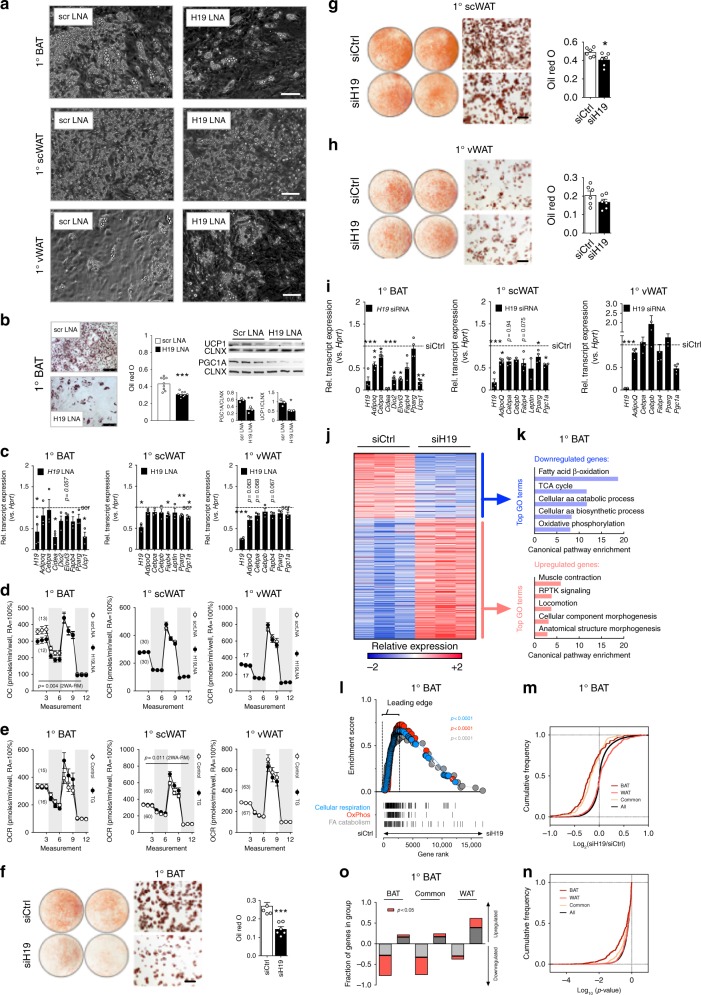
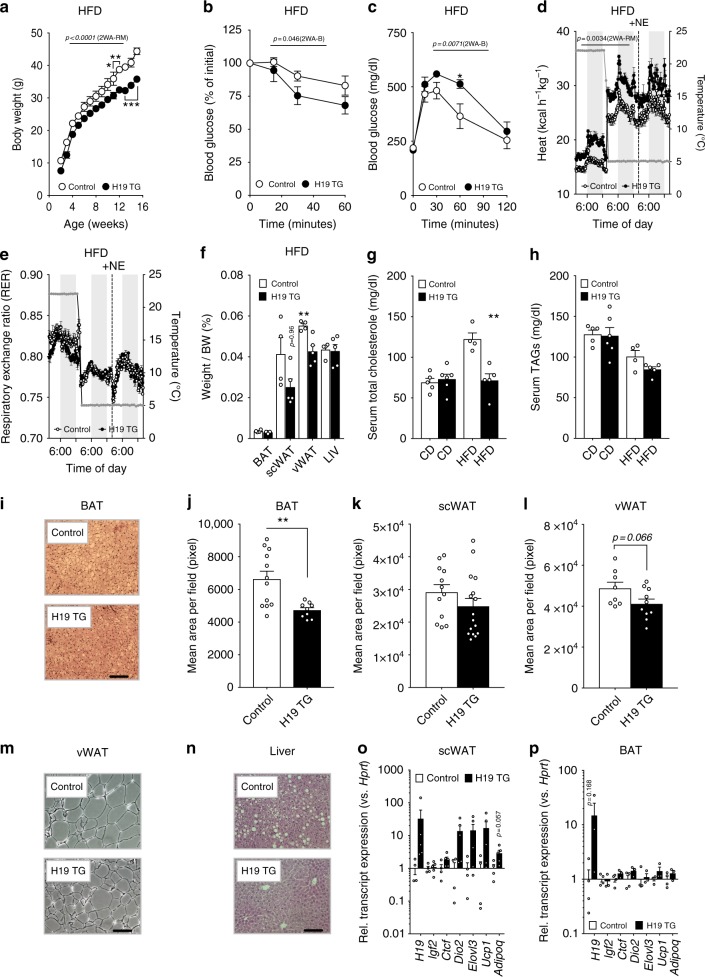
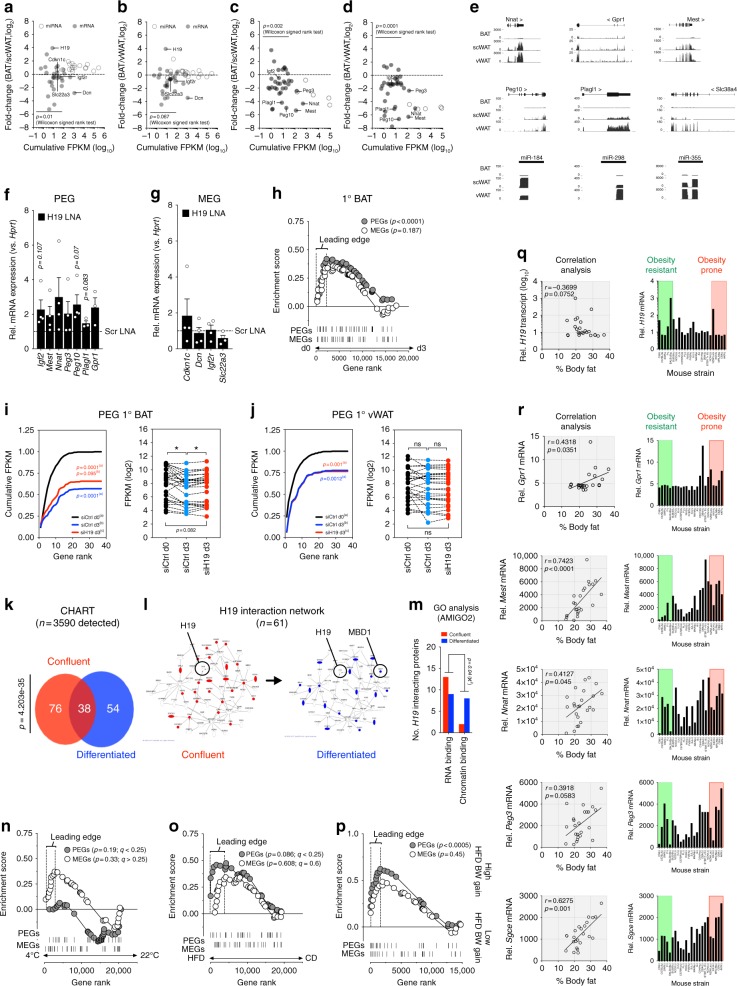
Increasing brown adipose tissue (BAT) thermogenesis in mice and humans improves metabolic health and understanding BAT function is of interest for novel approaches to counteract obesity. The role of long noncoding RNAs (lncRNAs) in these processes remains elusive. We observed maternally expressed, imprinted lncRNA H19 increased upon cold-activation and decreased in obesity in BAT. Inverse correlations of H19 with BMI were also observed in humans. H19 overexpression promoted, while silencing of H19 impaired adipogenesis, oxidative metabolism and mitochondrial respiration in brown but not white adipocytes. In vivo, H19 overexpression protected against DIO, improved insulin sensitivity and mitochondrial biogenesis, whereas fat H19 loss sensitized towards HFD weight gains. Strikingly, paternally expressed genes (PEG) were largely absent from BAT and we demonstrated that H19 recruits PEG-inactivating H19-MBD1 complexes and acts as BAT-selective PEG gatekeeper. This has implications for our understanding how monoallelic gene expression affects metabolism in rodents and, potentially, humans.


Conflict of interest statement

The authors declare no competing interests.

Figures

Fig. 1
Fig. 1
RNA-Seq reveals lincRNAs correlating with brown fat function in vivo. a, b Plot of BAT (a) mRNA or (b) lincRNA expression after HFD or CD feeding (RNA-Seq, n = 2 per biological condition). c, d Plot of BAT c mRNA or d lincRNA expression after 24 h of 4 °C or 22 °C (RNA-Seq, n = 2 per biological condition). eg BAT, scWAT, and vWAT expression of e Elovl3 f Ucp1, and g H19 expression in CD-fed mice (n = 3–5 per given tissue, left), in CD-fed mice housed at 22 °C (n = 4) versus 24 h of 4 °C (n = 3, middle) and HFD-fed (n = 3 for Elovl3 and Ucp1, n = 7 for H19) versus CD-fed mice (n = 3 for Elovl3 and Ucp1, n = 7 for H19, right, qRT-PCR. h, i scWAT expression of Ucp1 and H19 in h mice housed at 22 °C (n = 2 for Ucp1, n = 4 for H19) versus 24 h of 4 °C (n = 2 for Ucp1, n = 4 for H19) and i HFD-fed (n = 4) versus CD-fed (n = 3 for Ucp1, n = 4 for H19) mice. j vWAT Ucp1 and H19 expression in mice housed at 22 °C versus 24 h of 4 °C (n = 2 for Ucp1, n = 4 for H19). Unless stated, bar graphs represent mean ± s.e.m. with all data points plotted and unpaired, two-tailed Student’s t-tests were used to assess statistical significance. *p < 0.05, **p < 0.01, ***p < 0.001. If applicable p-values are indicated within the panel
Fig. 2
Fig. 2
LincRNA H19 required for brown but not white adipocyte differentiation and function. a Photomicrograph of BAT, scWAT, and vWAT 1° adipocytes transfected with scrambled (scr) or H19 LNAs. Pictures represent n = 6 (1°BAT) or n = 3 (others) experiments, n = 3 replicates each. Scale bar, 100 µm b ORO staining and quantification, PGC1A/UCP1 immunoblot and quantification of 1°BAT transfected with scr or H19 LNA. Scale bar, 250 µm. c Expression of indicated mRNAs in BAT, scWAT and vWAT 1° adipocytes transfected with scr or H19 LNAs. A paired, two-tailed Student’s t-test was used to assess significance across n = 3 experiments, n = 3 replicates each. d Oxygen consumption rates (OCR) in 1° adipocytes from indicated depots transfected with scr or H19 LNA. Alternating backgrounds depict medium, oligomycin, FCCP, and rotenon plus antimycin A injections. Numbers of measured wells are indicated in brackets. e OCRs in 1° adipocytes from indicated depots from H19 TG or Controls. d, e A two-way ANOVA with repeated measurements (2WA-RM) was applied to assess significance. fh ORO-stained 6-well plates, ORO photomicrographs and ORO densitometry in f BAT, g scWAT, and h vWAT 1° adipocytes transfected with H19 (siH19) versus control (siCtrl) siRNAs. An unpaired, two-tailed Student’s t-test was applied to assess significance. Scale bar, 250 µm i Expression of indicated mRNAs transfected with siH19 or siCtrl. An unpaired, two-tailed Student’s t-test was applied to assess significance across n = 3–4 experiments, n = 3 replicates each. j Expression change of 1410 mRNAs differentially expressed (p < 0.05, fc ≥ 1.3-fold) in siH19-transfected mature brown adipocytes. k Top 5 GO terms enriched (p < 0.05, Bonferroni correction) among mRNAs showing significantly higher (top) or lower (bottom) expression (p < 0.05) upon siH19 versus siCtrl. l GSEA for brown adipogenesis, OxPhos, and mitochondrial biogenesis. p empirical p-value. m, n Cumulative distributions of expression changes (m) and p-values (n) for all, BAT-specific, WAT-specific, and common adipogenic genes in siH19-treated mature brown adipocytes. j, m, n Changes are siH19 log2 expression (FPKM) ratios over siCtrl. o Proportion of gene sets upregulated (L2R > 0) or downregulated (L2R < 0) in siH19-treated cultured mature brown adipocytes. Unless stated, bar graphs represent mean ± s.e.m. with all data points plotted for (b, c, fh, i. *p < 0.05, **p < 0.01, ***p < 0.001. If applicable p-values are indicated
Fig. 3
Fig. 3
H19 overexpression protects from obesity by increasing energy expenditure and scWAT beiging. a Body weight of HFD-fed Control (n = 4–5) versus H19 TG (n = 4–5) mice. A 2WA-RM with Bonferroni post hoc correction for multiple comparisons (2WA-B) was applied to assess significance. b Insulin tolerance test of HFD-fed Control (n = 4) versus H19 TG (n = 6) mice. c Glucose tolerance test of HFD-fed Control (n = 5) versus H19 TG (n = 5) mice. d Energy expenditure in HFD-fed Control (n = 4) versus H19 TG (n = 5) mice. bd A 2WA-B was applied to assess significance. e Respiratory Exchange Ratios (RER) in HFD-fed Control (n = 4) versus H19 TG (n = 5) mice. f Tissue/body weight (BW) ratios in HFD-fed Control (n = 4) versus H19 TG (n = 5) mice. An unpaired, two-tailed Student’s t-test was applied to assess significance. g Serum cholesterole levels in HFD-fed Control (n = 4) versus H19 TG (n = 5) mice. h Serum triglyceride levels in HFD-fed Control (n = 4) versus H19 TG (n = 5) mice. An unpaired, two-tailed Student’s t-test was applied to assess significance. i Representative photomicrograph of BAT from HFD-fed Control versus H19 TG mice. j Automated quantification of adipocyte mean area per field in hematoxylin/eosin (HE) stained BAT sections from HFD-fed Control (n = 12 fields) versus H19 TG (n = 9 fields). An unpaired, two-tailed Student’s t-test was applied to assess significance. k Automated quantification of adipocyte mean area in HE-stained scWAT sections from HFD-fed Control (n = 12 fields) versus H19 TG (n = 16 fields) mice. l Automated quantification of adipocyte mean area in HE-stained vWAT sections from HFD-fed Control (n = 8 fields) versus H19 TG (n = 10 fields) mice. An unpaired, two-tailed Student’s t-test was applied to assess significance. m Representative photomicrograph of vWAT sections from HFD-fed Control versus H19 TG mice. n Representative photomicrograph of liver sections from HFD-fed Control versus H19 TG mice. m, n Scale bar, 50 µm. o scWAT expression of indicated mRNAs from HFD-fed Control (n = 4) versus H19 TG (n = 5) mice. p Relative BAT expression of indicated mRNAs from HFD-fed Control (n = 4) versus H19 TG mice (n = 3). An unpaired, two-tailed Student’s t-test was used to assess significance in o, p. *p < 0.05, **p < 0.01, ***p < 0.001. If applicable p-values are indicated within the panel
Fig. 4
Fig. 4
Fat-specific deletion of H19 sensitizes towards DIO-associated weight gains and impairments in energy expenditure. a Mating strategy for parental allele-of-origin specific deletion of the H19 DMR in adipose tissue. b Body weight of HFD-fed Control (n = 5) versus H19∆AT (n = 4) mice. A 2WA-B was applied to assess significance. c Glucose tolerance test of male, HFD-fed Control (n = 5) versus H19∆AT (n = 4) mice. d Insulin tolerance test of male, HFD-fed Control (n = 5) versus H19∆AT (n = 4) mice. e Energy expenditure in male, HFD-fed Control (n = 5) versus H19∆AT (n = 4) mice. f Oxygen consumption in male, HFD-fed Control (n = 5) versus H19∆AT (n = 4) mice. df A 2WA-RM test with repeated measures was applied to assess statistical significance. g RER in male, HFD-fed Control (n = 5) versus H19∆AT (n = 4) mice. h Tissue/body weight ratio in male, HFD-fed Control (n = 5) versus H19∆AT (n = 4) mice. An unpaired, two-tailed Student’s t-test was applied to assess significance. i, j Automated quantification of mitochondrial area (i) and perimeters (j) in BAT across diets and genotypes (total mitochondria numbers in brackets). An unpaired, two-tailed Student’s t-test was applied to assess significance. k Representative electron microscopy images from BAT mitochondria across diets and genotypes with magnifications indicated under panel. White arrows depict cristae architectures. Scale bar, 2 µm (6000 × ) or 500 nm (10,000 × ) l BAT expression of indicated mRNAs in HFD-fed H19 TG (n = 3), HFD-fed Control (n = 4), and CD-fed Control (n = 5) mice. m scWAT expression of indicated mRNAs in HFD-fed H19 TG (n = 3), HFD-fed Control (n = 4), and CD-fed Control (n = 5) mice. l, m A One-Way ANOVA plus Bonferroni post test was applied to assess statistical significance. (a) = Significance versus CD-fed Control, (b) = Significance versus HFD-fed Control. n BAT expression of indicated mRNAs in HFD-fed Control (n = 4) versus HFD-fed H19∆AT (n = 3) mice. o scWAT expression of indicated mRNAs in HFD-fed Control (n = 4) versus HFD-fed H19∆AT (n = 3) mice. An unpaired, two-tailed Student’s t-test was applied to assess significance between genotypes. *p < 0.05, **p < 0.01, ***p < 0.001. If applicable p-values are indicated within the panel
Fig. 5
Fig. 5
Repression of BAT paternal monoallelic gene expression by the lincRNA H19. a Plot of expression fold-changes of maternally expressed genes (MEGs) in BAT versus a scWAT b vWAT. c Plot of expression fold-changes of paternally expressed genes (PEGs) between BAT versus c scWAT d vWAT. A Wilcoxon matched-pairs signed rank test was used to assess statistical significance for up- or downregulation of PEGs/MEGs (e) UCSC Genome Browser showing PEG abundances in BAT, scWAT, and vWAT. f, g Expression of indicated PEGs (f) or MEGS (g) in BAT 1° adipocytes transfected with scr or H19 LNA. f, g A paired, two-tailed Student’s t-test was used to assess significance across n = 4 experiments, n = 3 technical replicates each. h GSEA showing downregulation of PEGs but not MEGs (list from www.geneimprint.com) during 1°BAT differentiation. i, j Cumulative distribution frequency (left) and abundances (right) of PEGs in i 1°BAT and j 1°vWAT in siCtrl transfected adipocyte progenitors at d0 (black) versus differentiated siCtrl (blue) and siH19-transfected (red) 1° adipocytes at d3. k Quantification and overlap of H19 co-immunoprecipitating proteins in confluent (red) and differentiated (blue) PIBA cells determined by CHART-MS. Pulldown of H19-interacting proteins was performed using six H19-specific antisense/sense oligonucleotides in n = 3 replicates. l Illustration of H19 interaction network comprising n = 61 proteins generated using Ingenuity Pathway Analysis. Red and blue nodes depict proteins co-immunoprecipitating in confluent and differentiated cells, respectively. m AMIGO2 GO classification of H19 interactors across cellular states. np GSEA analysis of PEG gene ranks in mice n exposed to 4 °C cold stress for 24 h, o HFD feeding, or p exhibiting different susceptibility to DIO-evoked weight gains. q, r Correlation of WAT (q) H19 or (r) PEG abundances versus a ranked list of 24 obesity-prone and –resistant non-isogenic mouse strains. H19/PEG abundances were from (MOE430 V2)—Adipose (www.biogps.org54) and body composition after HFD feeding defined as obesity-resistant versus obesity-prone strains. Significance of association between expression versus (%) body fat was determined using Spearman’s correlation analysis. *p < 0.05, **p < 0.01, ***p < 0.001. If applicable additional p-values are indicated within the panel

References

    1. Van Gaal LF, Mertens IL, De Block CE. Mechanisms linking obesity with cardiovascular disease. Nature. 2006;444:875–880. doi: 10.1038/nature05487. - DOI - PubMed
    1. Hotamisligil GS. Endoplasmic reticulum stress and atherosclerosis. Nat. Med. 2010;16:396–399. doi: 10.1038/nm0410-396. - DOI - PMC - PubMed
    1. Torres DM, Williams CD, Harrison SA. Features, diagnosis, and treatment of nonalcoholic fatty liver disease. Clin. Gastroenterol. Hepatol. 2012;10:837–858. doi: 10.1016/j.cgh.2012.03.011. - DOI - PubMed
    1. Bartelt A, Heeren J. The holy grail of metabolic disease: brown adipose tissue. Curr. Opin. Lipidol. 2012;23:190–195. doi: 10.1097/MOL.0b013e328352dcef. - DOI - PubMed
    1. van Marken Lichtenbelt WD, et al. Cold-activated brown adipose tissue in healthy men. N. Engl. J. Med. 2009;360:1500–1508. doi: 10.1056/NEJMoa0808718. - DOI - PubMed

Publication types

Substances