. 2018 Sep 6;8(1):12993.
doi: 10.1038/s41598-018-30475-w.

The 2015 landslide and tsunami in Taan Fiord, Alaska

Affiliations

The 2015 landslide and tsunami in Taan Fiord, Alaska

Bretwood Higman et al. Sci Rep. .

Abstract

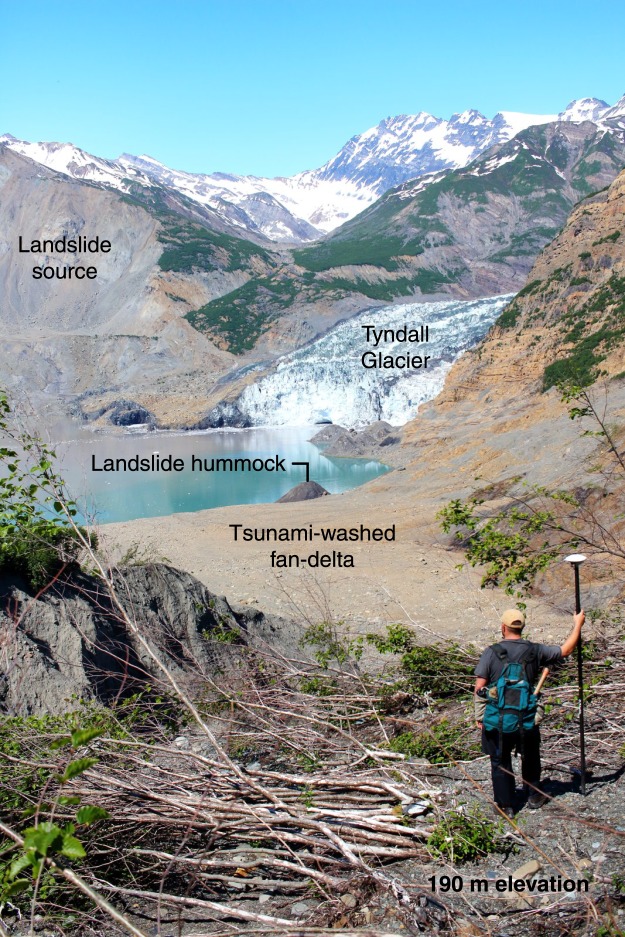
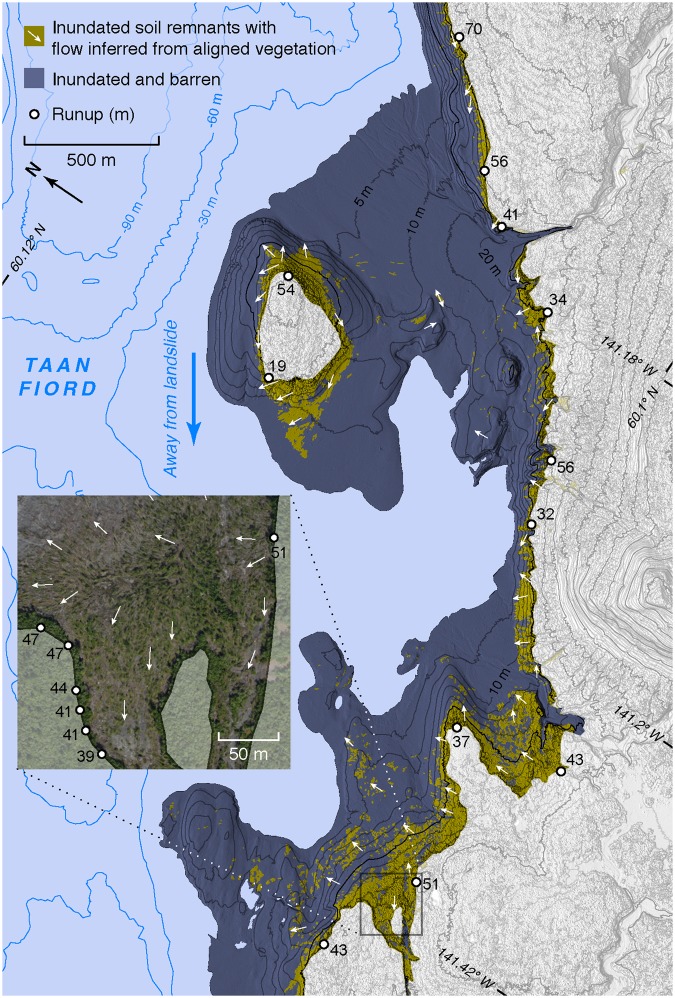
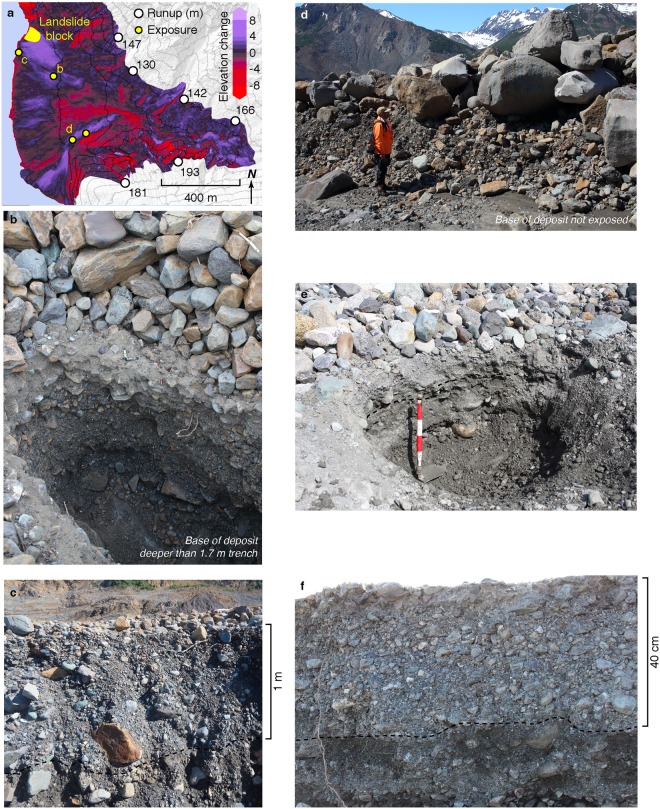
Glacial retreat in recent decades has exposed unstable slopes and allowed deep water to extend beneath some of those slopes. Slope failure at the terminus of Tyndall Glacier on 17 October 2015 sent 180 million tons of rock into Taan Fiord, Alaska. The resulting tsunami reached elevations as high as 193 m, one of the highest tsunami runups ever documented worldwide. Precursory deformation began decades before failure, and the event left a distinct sedimentary record, showing that geologic evidence can help understand past occurrences of similar events, and might provide forewarning. The event was detected within hours through automated seismological techniques, which also estimated the mass and direction of the slide - all of which were later confirmed by remote sensing. Our field observations provide a benchmark for modeling landslide and tsunami hazards. Inverse and forward modeling can provide the framework of a detailed understanding of the geologic and hazards implications of similar events. Our results call attention to an indirect effect of climate change that is increasing the frequency and magnitude of natural hazards near glaciated mountains.


Conflict of interest statement

The authors declare no competing interests.

Figures

Figure 1
Figure 1
Tsunami impacts near the landslide. The 2015 landslide and tsunami reshaped the landscape at the terminus of Tyndall Glacier. The person in the photo is standing about 190 m above the fjord level, just below the limit of inundation (near the point marked with 193 m runup in Fig. 2).
Figure 2
Figure 2
Changes in Taan Fiord. Tyndall Glacier retreated at an increasing pace through the late 20th century until it stabilized in 1991, at approximately the location of the current terminus. The slope failure in October 2015 entered the recently deglaciated fjord at the calving front, generating a tsunami that swept the coast to a height of 193 m. Seismic inversion completed within hours of the event produced an accurate picture of initial motion and a rough location, but could not determine whether the landslide had set off a tsunami. In 2016, marine surveys revealed tens of meters thick blocky submarine runout extending several kilometers. Only the more proximal blocks form submarine hillocks, while more distant ones are buried beneath one or possibly two post-landslide turbidites. Field surveys mapped runup, selected examples of which are presented here. Map created with QGIS 2.18 (http://www.qgis.org/en/site/).
Figure 3
Figure 3
Motion began decades prior to failure. Signs of slope failure in the landslide source area (Fig. 1) were first noted in 1996. Further motion occurred between 2002 and 2012, and the landslide occurred in 2015. Landsat imagery aligned and animated through Google Earth Engine shows motion progressing yearly during a sequence of images from 1995 to 1998, and that some motion motion (less rapid than 1995 to 1998) occurred between 2010 and 2015. Other portions of the image sequence are too unclear to tell whether motion occurred. The lower panel includes an inferred failure plane from 25. Maps created with QGIS 2.18 (http://www.qgis.org/en/site/).
Figure 4
Figure 4
Tsunami recorded by its onshore traces. The Taan Fiord tsunami flooded over 20 km2 and left water lines, soil remnants, and flattened, oriented trees. The inset orthorectified imagery includes an example of detailed runup and oriented tree mapping. Bathymetric contours from 28. Map created with QGIS 2.18 (http://www.qgis.org/en/site/).
Figure 5
Figure 5
Taan Fiord tsunami deposits. The change in elevation between a 2014 DEM derived from satellite photogrammetry and 2016 lidar data reveals multi-meter changes in surface elevations of an alluvial fan reached by the landslide and swept by the tsunami (a). Where exposed in erosional banks or trenches, the deposit included a lower unit of very poorly sorted sand to boulders, and an upper unit of sorted boulders or cobbles (b,c,d - locations noted on map). At the trench in (b), and the outcrop in (d), the pre-tsunami surface was not exposed. However the outcrop in (c) extended down below the pre-tsunami surface, exposing siltier, browner sediment (contact dashed). Laterally, portions of the original soil was intact, and included shrubs folded uphill in the direction of tsunami inflood. Further down fjord, similar deposits were found where runup was about 50 m (e, contact dashed). Even where the tsunami had diminished to the point where runup was only 16 m, the deposit was still 40 cm thick and included abundant cobbles (f, contact dashed). Map in (a) created with QGIS 2.18 (http://www.qgis.org/en/site/).

References

    1. Roe GH, Baker MB, Herla F. Centennial glacier retreat as categorical evidence of regional climate change. Nature Geoscience. 2016;10:95–99. doi: 10.1038/ngeo2863. - DOI
    1. Gruber, S. & Haeberli, W. Permafrost in steep bedrock slopes and its temperature‐related destabilization following climate change. Journal of Geophysical Research Earth Surface112, 10.1029/2006JF000547 (2007).
    1. Coe JA, Bessette-Kirton EK, Geertsema M. Increasing rock-avalanche size and mobility in Glacier Bay National Park and Preserve Alaska detected from 1984 to 2016 Landsat imagery. Landslides. 2017
    1. Deline, P., Hewitt, K., Reznichenko, N. & Shugar, D. Rock avalanches onto glaciers in Landslide Hazards Risks and Disasters 263–319, 10.1016/b978-0-12-396452-6.00009-4 (Elsevier, 2015).
    1. McColl ST. Paraglacial rock-slope stability. Geomorphology. 2012;153–154:1–16. doi: 10.1016/j.geomorph.2012.02.015. - DOI

Publication types

LinkOut - more resources