. 2018 Sep 20;10(36):17236-17248.
doi: 10.1039/c8nr03741h.

An all-in-one nanoparticle (AION) contrast agent for breast cancer screening with DEM-CT-MRI-NIRF imaging

Affiliations

An all-in-one nanoparticle (AION) contrast agent for breast cancer screening with DEM-CT-MRI-NIRF imaging

Jessica C Hsu et al. Nanoscale. .

Abstract

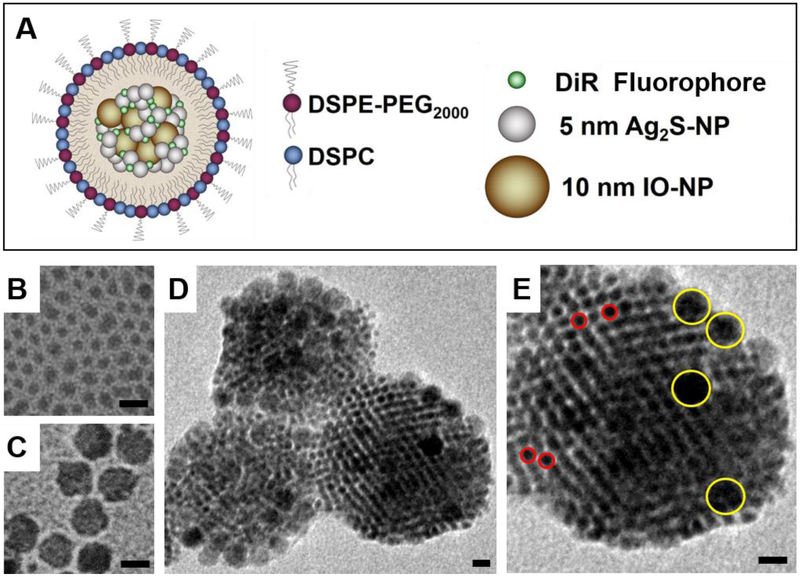
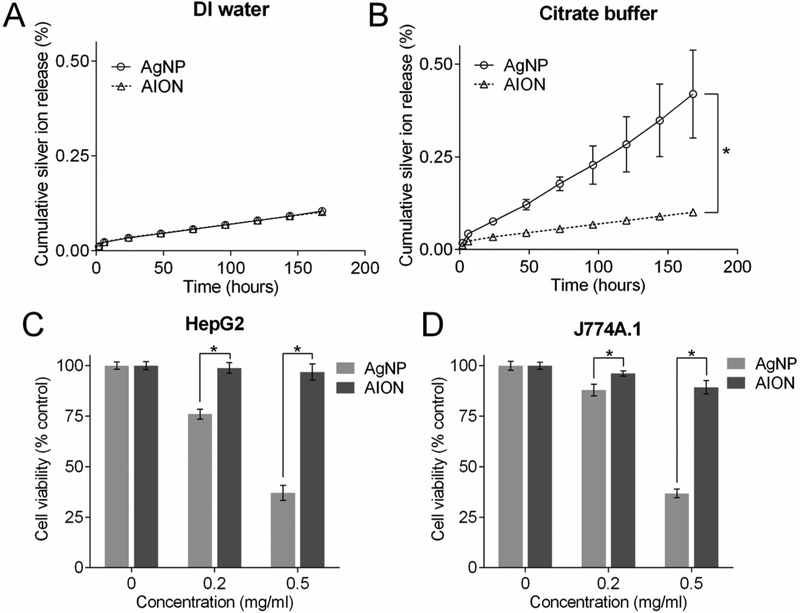
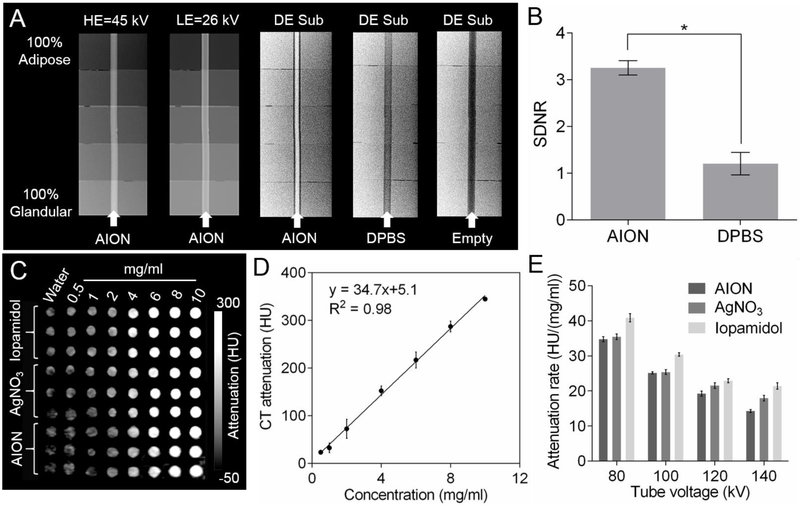
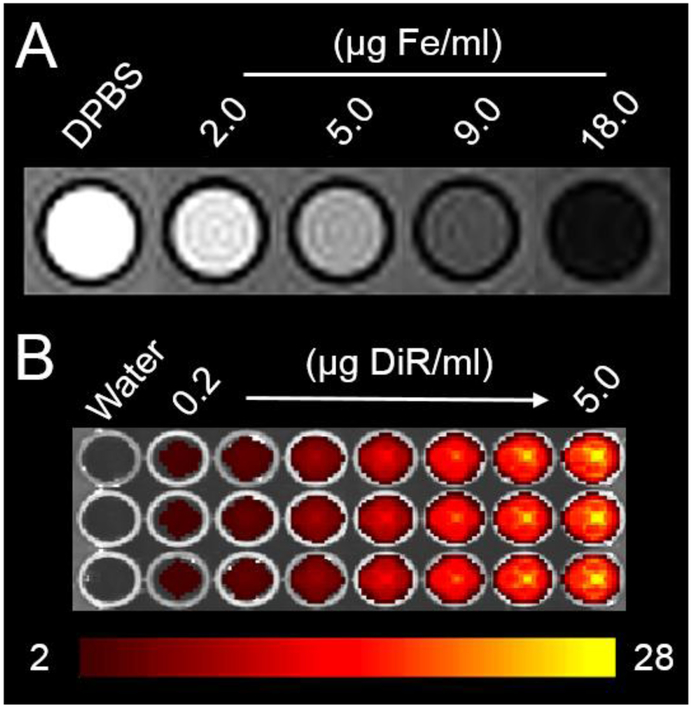
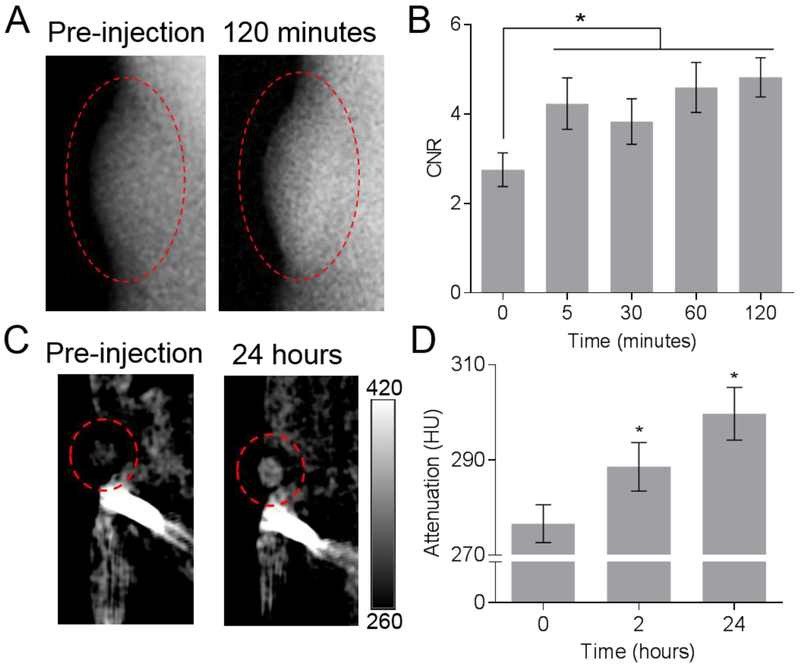
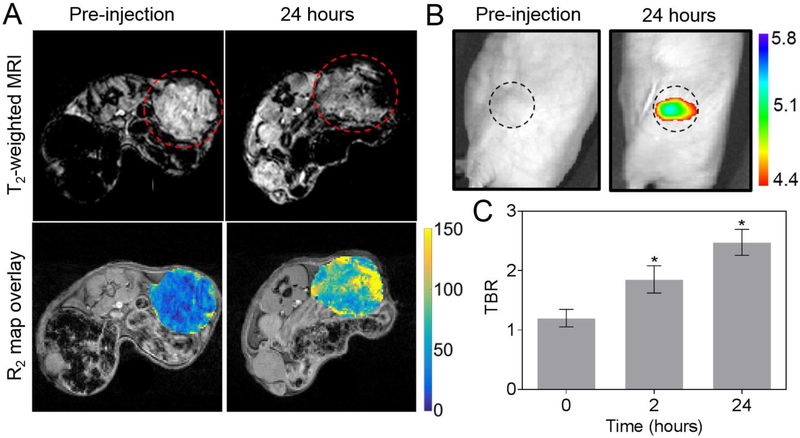
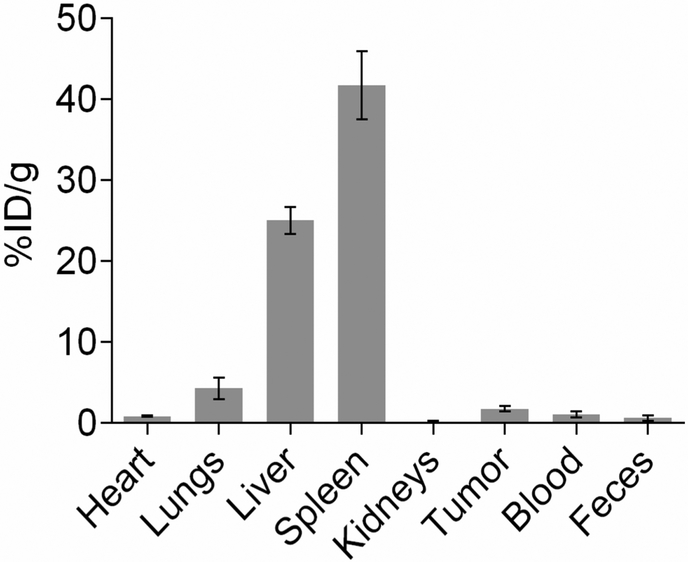
Conventional X-ray mammography has low diagnostic sensitivity for women with dense breasts. As a result, alternative contrast-enhanced screening tools such as dual energy mammography (DEM), computed tomography (CT), magnetic resonance imaging (MRI), and near-infrared fluorescence (NIRF) imaging are being used or investigated for these women. However, currently available contrast agents are non-ideal, have safety issues, and each imaging technique requires a different contrast agent. We therefore sought to develop a multimodal contrast agent that is functional for each breast imaging modality to simplify the diagnosis process and address the issues of existing contrast agents. Herein, we present a novel "all-in-one" nanoparticle (AION) multimodal imaging probe that has potent DEM, CT, MRI, and NIRF contrast properties and improved biocompatibility. AION were formed by co-encapsulation of a near-infrared fluorophore (DiR), silver sulfide nanoparticles (Ag2S-NP), and iron oxide nanoparticles (IO-NP) in PEGylated micelles. AION showed negligible cytotoxicity, which was in agreement with its minimal silver ion release profiles. AION generated strong contrast with all imaging modalities as demonstrated in phantom imaging. AION allowed in vivo tumor imaging as evidenced by the increase in contrast after injection. This study indicates the potential of AION as an effective multimodal contrast agent for breast cancer diagnosis with a range of imaging methods.


Figures

Figure 1.
Figure 1.
(A) Schematic depiction of AION structure and composition. TEM images of (B) as-prepared 4.7 nm Ag2S-NP, (C) oleic acid coated 10 nm IO-NP, (D) AION particles and (E) an individual AION particle at a higher magnification showing the inclusion of Ag2S-NP (red circles) and IO-NP (yellow circles). All scale bars are 10 nm.
Figure 2.
Figure 2.
Silver ion release from AION and AgNP when incubated in (A) DI water and (B) citrate buffer (pH 5.5) at 37 °C over a period of 7 days. Viability of (C) HepG2 and (D) J774A.1 cells when incubated with AgNP and AION for 24 hours. Error bars are one standard deviation. Some error bars are hidden by the data point marker. * indicates P < 0.05 (unpaired Student’s t-test).
Figure 3.
Figure 3.
Phantom imaging of AION with X-ray based imaging modalities. (A) DEM phantom images (HE = high energy, LE = low energy, and DE Sub = dual energy subtraction) and (B) signal difference-to-noise ratios derived from (A). (C) CT phantom image and (D) CT attenuation of AION as a function of concentration at 80 kV. (E) CT attenuation rates of different agents for each tube voltage. Error bars are one standard deviation in all cases. * indicates P < 0.05 (unpaired Student’s t-test).
Figure 4.
Figure 4.
(A) MRI phantom image (the highest concentration corresponds to 90 μg Ag/ml) and (B) NIRF phantom image of AION (the highest concentration corresponds to 500 μg Ag/ml). Scale bar in units of radiant efficiency (x109 (p/s/cm2/sr)/μW/cm2).
Figure 5.
Figure 5.
In vivo tumor imaging with AION using X-ray based imaging modalities. (A) DEM images of representative tumor-bearing mice at pre-injection and 120 minutes post-injection with AION. (B) DEM image-derived contrast-to-noise ratios in the tumor regions at the time points imaged. (C) CT images of a representative tumor-bearing mouse pre-injection and at 24 hours post-injection. Scale bar in units of CT attenuation (HU). (D) Average CT attenuation at pre-injection and 2 and 24 hours post-injection. Error bars are standard error of mean. Red dashed ovals indicate tumors. Pre-injection is noted as 0 hours for both graphs. * indicates P < 0.05 compared to pre-injection scans (paired Student’s t-test).
Figure 6.
Figure 6.
In vivo MRI and NIRF optical imaging with AION. (A) Top: MR images of representative tumor-bearing mice pre-injection and at 24 hours post-injection with AION. Images are shown with TE of 13.2 ms. Red dashed circles indicate tumors. Bottom: representative R2 maps of the same mouse tumor before and after injection of AION. Scale bar in units of Hz (1/s). (B) NIRF images of representative tumor-bearing mice with AION at different time points. Black dashed circles indicate tumors. Scale bar in units of radiant efficiency (x109 (p/s/cm2/sr)/μW/cm2). (C) Tumor-to-background ratio calculated from the NIRF images with AION. Error bars are standard error of mean. * P < 0.05 compared to pre-injection scan (paired Student’s t-test).
Figure 7.
Figure 7.
Biodistribution of AION (silver content analyzed by ICP-OES) in tumor tissues and major organs at 24 hours post-injection.

References

    1. Siu AL; Force, U. S. P. S. T. Screening for Breast Cancer: U.S. Preventive Services Task Force Recommendation Statement. Ann. Intern. Med 2016, 164, 279–296. - PubMed
    1. Wang AT; Vachon CM; Brandt KR; Ghosh K Breast Density and Breast Cancer Risk: A Practical Review. Mayo Clin. Proc 2014, 89, 548–557. - PubMed
    1. Carney PA; Miglioretti DL; Yankaskas BC; Kerlikowske K; Rosenberg R; Rutter CM; Geller BM; Abraham LA; Taplin SH; Dignan M, et al. Individual and Combined Effects of Age, Breast Density, and Hormone Replacement Therapy Use on the Accuracy of Screening Mammography. Ann. Intern. Med 2003, 138, 168–175. - PubMed
    1. Mandelson MT; Oestreicher N; Porter PL; White D; Finder CA; Taplin SH; White E Breast Density as a Predictor of Mammographic Detection: Comparison of Interval- and Screen-Detected Cancers. JNCI, J. Natl. Cancer Inst 2000, 92, 1081–1087. - PubMed
    1. McCormack VA; dos Santos Silva I Breast Density and Parenchymal Patterns as Markers of Breast Cancer Risk: A Meta-Analysis. Cancer Epidemiol., Biomarkers Prev 2006, 15, 1159–1169. - PubMed