Meta-Analysis
. 2019 Oct;13(5):1453-1467.
doi: 10.1007/s11682-018-9941-x.

A resting state fMRI analysis pipeline for pooling inference across diverse cohorts: an ENIGMA rs-fMRI protocol

Affiliations
Meta-Analysis

A resting state fMRI analysis pipeline for pooling inference across diverse cohorts: an ENIGMA rs-fMRI protocol

Bhim M Adhikari et al. Brain Imaging Behav. 2019 Oct.

Abstract

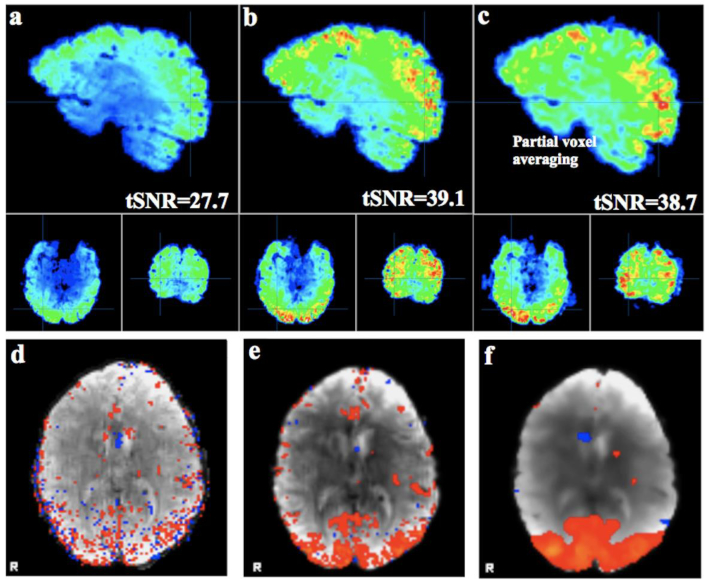
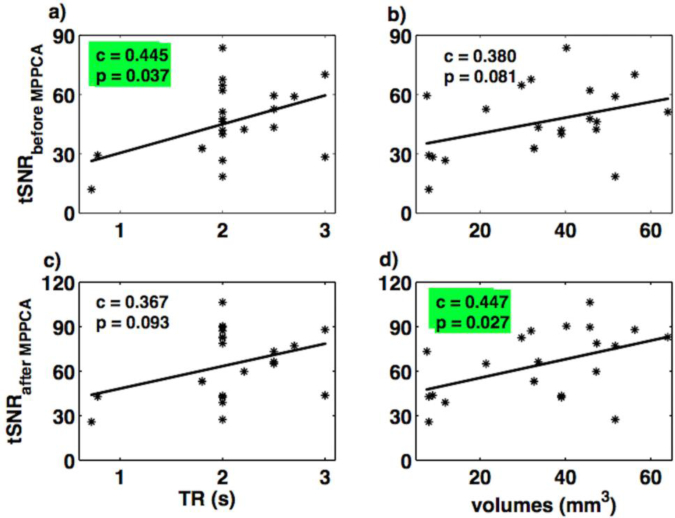
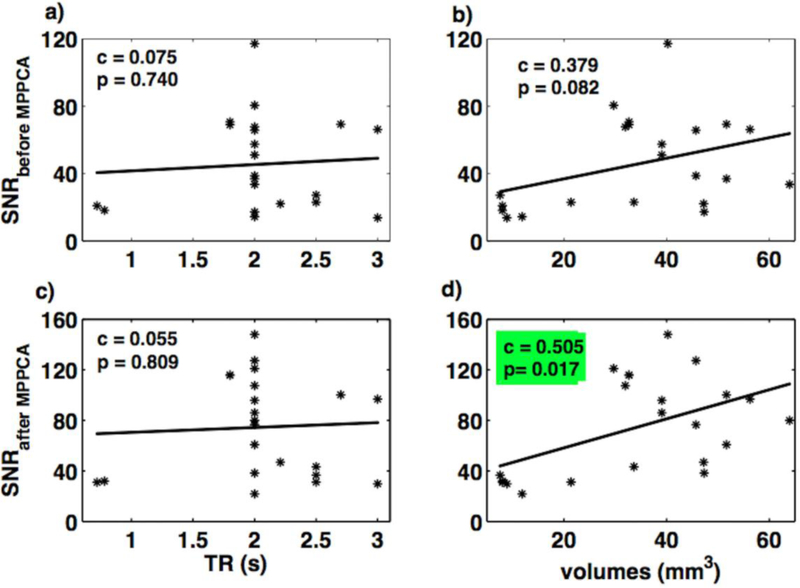
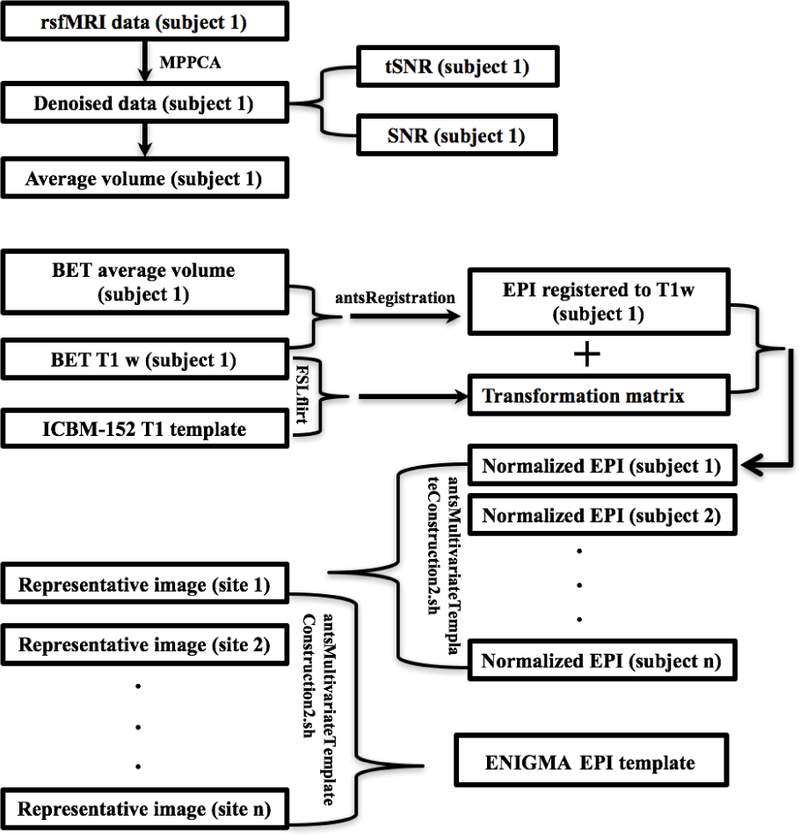
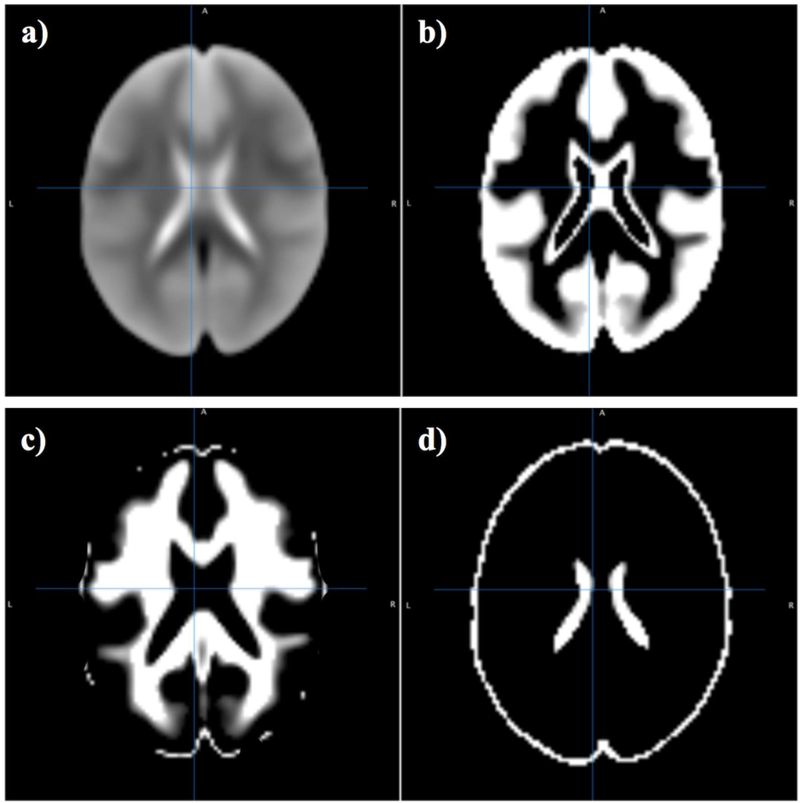
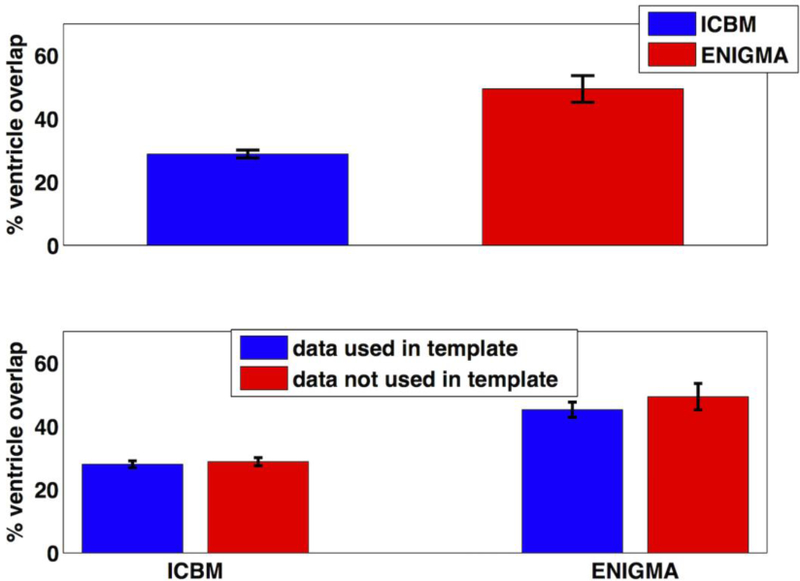
Large-scale consortium efforts such as Enhancing NeuroImaging Genetics through Meta-Analysis (ENIGMA) and other collaborative efforts show that combining statistical data from multiple independent studies can boost statistical power and achieve more accurate estimates of effect sizes, contributing to more reliable and reproducible research. A meta- analysis would pool effects from studies conducted in a similar manner, yet to date, no such harmonized protocol exists for resting state fMRI (rsfMRI) data. Here, we propose an initial pipeline for multi-site rsfMRI analysis to allow research groups around the world to analyze scans in a harmonized way, and to perform coordinated statistical tests. The challenge lies in the fact that resting state fMRI measurements collected by researchers over the last decade vary widely, with variable quality and differing spatial or temporal signal-to-noise ratio (tSNR). An effective harmonization must provide optimal measures for all quality data. Here we used rsfMRI data from twenty-two independent studies with approximately fifty corresponding T1-weighted and rsfMRI datasets each, to (A) review and aggregate the state of existing rsfMRI data, (B) demonstrate utility of principal component analysis (PCA)-based denoising and (C) develop a deformable ENIGMA EPI template based on the representative anatomy that incorporates spatial distortion patterns from various protocols and populations.

Keywords: ENIGMA EPI template; Large multi-site studies; Processing pipelines.


Conflict of interest statement

Conflict of Interest: There is no conflict of interest for any of the authors.

Figures

Fig. 1.
Fig. 1.
Temporal signal-to-noise ratio (tSNR) maps from a representative sample subject data from the HCP study. Maps shown are for raw data (a), filtered data using the MPPCA filter (b), and applying Gaussian kernel smoothing (σ=2mm) on the raw data yielding the average tSNR close to the tSNR of the filtered data using MPPCA filter (c). The impact of the denoising on the state visual network demonstrated by localization of the activity to the cortical gray matter in the MPPCA denoised data (e) versus raw data (d) and Gaussian smooth data (f) in bottom row.
Fig. 2.
Fig. 2.
Average tSNR values for rsfMRI datasets before and after applying the MPPCA filter (raw and denoised data). Here, tSNR values were computed as tSNR=mean signal intensity/variation over time, as described in Method 1, Figure 2(a). The SNR values (Figure 2b) were computed using Method 2, described in text. The error bars represent the standard error of the mean.
Fig. 3.
Fig. 3.
Relation of tSNR (using Method 1) with TR and spatial volumes for rsfMRI datasets, before (a-b) and after applying MPPCA denoising filter (c-d). The subplot marked with green color indicates the significant correlation between variables.
Fig. 4.
Fig. 4.
Relation of SNR (using Method 2) with TR and spatial volumes for rsfMRI datasets, before (a-b) and after applying MPPCA denoising filter (c-d). The subplot marked with green color indicates the significant correlation between variables.
Fig. 5:
Fig. 5:
Representative brain template images for 22 datasets (~50 subjects are included in each dataset).
Fig. 6:
Fig. 6:
Flow chart that summarizes the description of used methods in ENIGMA rs-fMRI protocol.
Fig. 7.
Fig. 7.
ENIGMA EPI brain template (a) and segmented tissue classes (b-d) for gray matter, white matter and cerebrospinal fluid respectively.
Fig. 8.
Fig. 8.
Percentage (%) ventricle overlap: (a) the overall average ventricular overlap was improved significantly (p<10−9) when the individual subjects’ rsfMRI data was registered to ENIGMA EPI template in comparison to ICBM template. These subjects were not used in ACP study to create a representative brain template. (b) The brains (N=50) that were used in creation of the template (blue in color) were not different from the brains (N=34) that were not used in template creation (red in color) in terms of the % ventricle overlap when computed using ICBM and ENIGMA EPI template. Here, the error bar represents the standard error of the mean.

References

    1. Adams HH, Hibar DP, Chouraki V, Stein JL, Nyquist PA, Renteria ME, et al. (2016). Novel genetic loci underlying human intracranial volume identified through genome-wide association. Nat Neurosci, 19(12), 1569–1582, doi:10.1038/nn.4398. - DOI - PMC - PubMed
    1. Avants BB, Epstein CL, Grossman M, & Gee JC (2008). Symmetric diffeomorphic image registration with cross-correlation: Evaluating automated labeling of elderly and neurodegenerative brain. Med. Image Anal, 12(1), 26–41. - PMC - PubMed
    1. Avants BB, Johnson HJ, & Tustison NJ (2015). Neuroinformatics and the The Insight ToolKit. Front Neuroinform, 9, 5, doi:10.3389/fninf.2015.00005. - DOI - PMC - PubMed
    1. Avants BB, Yushkevich P, Pluta J, Minkoff D, Korczykowski M, Detre J, et al. (2010). The optimal template effect in hippocampus studies of diseased populations. Neuroimage, 49(3), 2457–2466. - PMC - PubMed
    1. Bajaj S, Adhikari BM, Friston KJ, & Dhamala M (2016). Bridging the Gap: Dynamic Causal Modeling and Granger Causality Analysis of Resting State Functional Magnetic Resonance Imaging. Brain Connect, doi:10.1089/brain.2016.0422. - DOI - PubMed

Publication types