. 2018 Sep 7;131(3):724-734.
doi: 10.3171/2018.4.JNS172644. Print 2019 Sep 1.

Elucidating the kinetics of sodium fluorescein for fluorescence-guided surgery of glioma

Affiliations

Elucidating the kinetics of sodium fluorescein for fluorescence-guided surgery of glioma

Margaret Folaron et al. J Neurosurg. .

Abstract

Objective: The use of the optical contrast agent sodium fluorescein (NaFl) to guide resection of gliomas has been under investigation for decades. Although this imaging strategy assumes the agent remains confined to the vasculature except in regions of blood-brain barrier (BBB) disruption, clinical studies have reported significant NaFl signal in normal brain tissue, limiting tumor-to-normal contrast. A possible explanation arises from earlier studies, which reported that NaFl exists in both pure and protein-bound forms in the blood, the former being small enough to cross the BBB. This study aims to elucidate the kinetic binding behavior of NaFl in circulating blood and its effect on NaFl accumulation in brain tissue and tumor contrast. Additionally, the authors examined the blood and tissue kinetics, as well as tumor uptake, of a pegylated form of fluorescein selected as a potential optical analog of gadolinium-based MRI contrast agents.

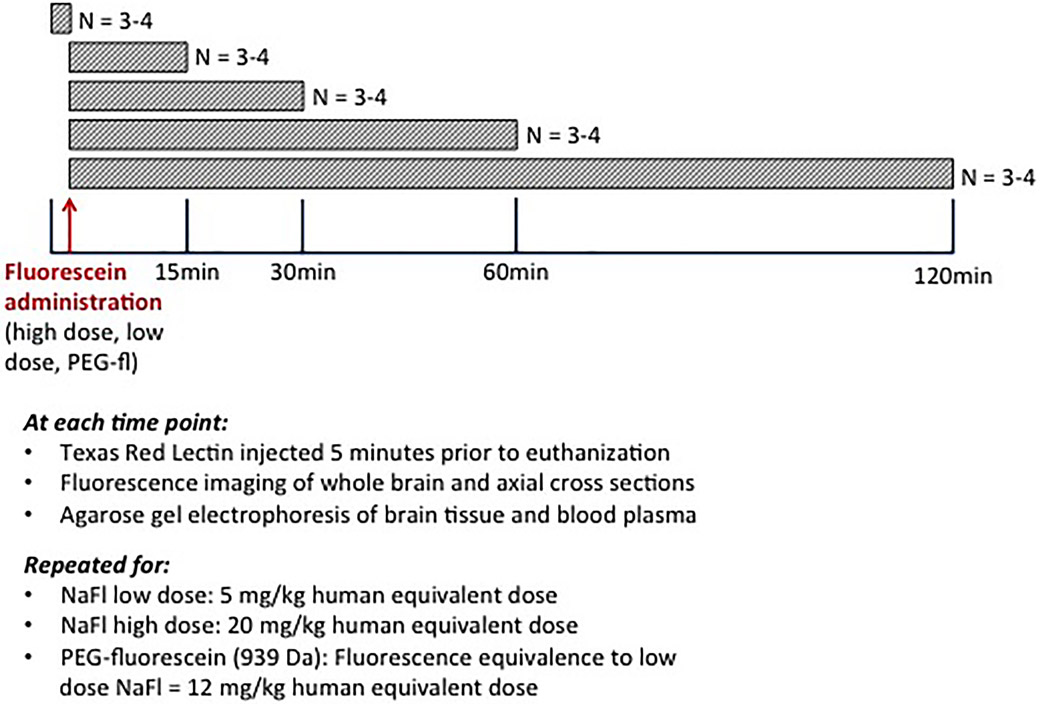
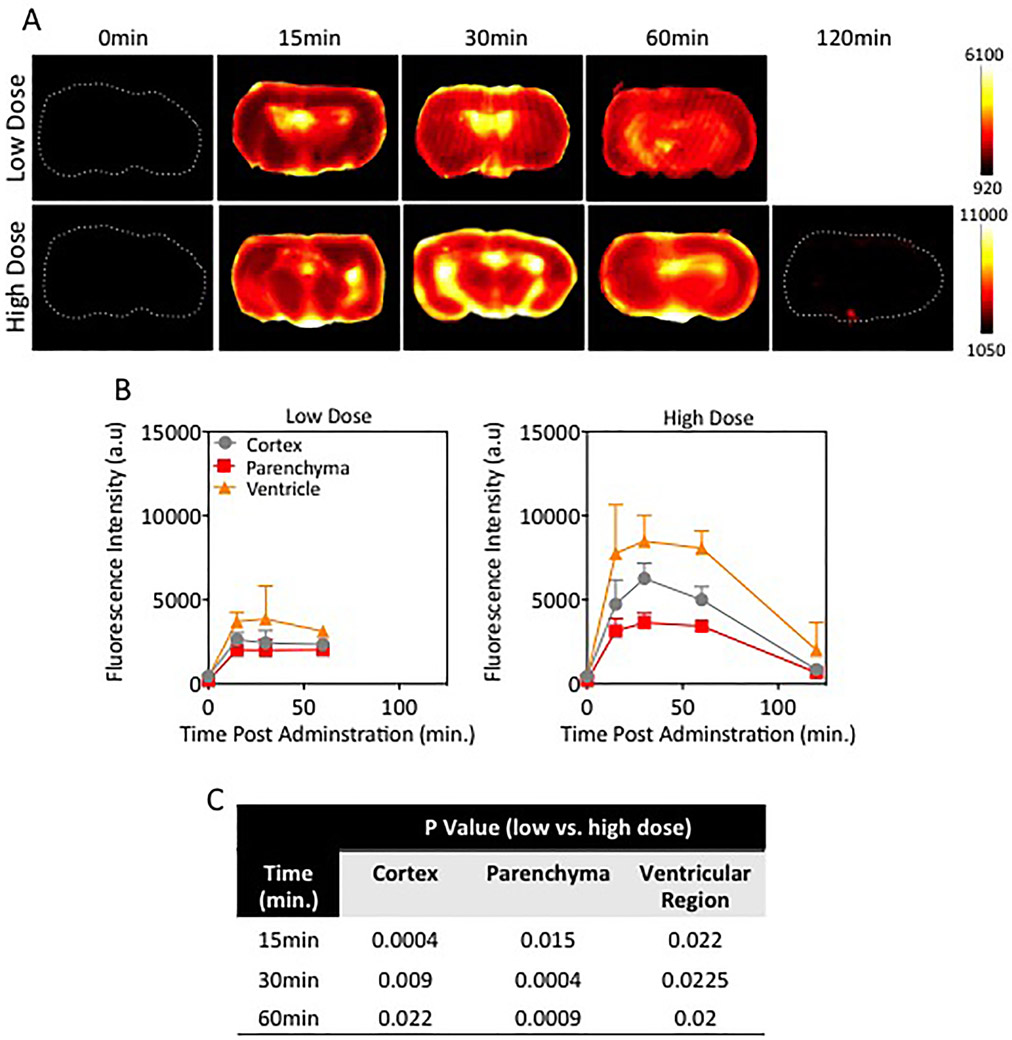
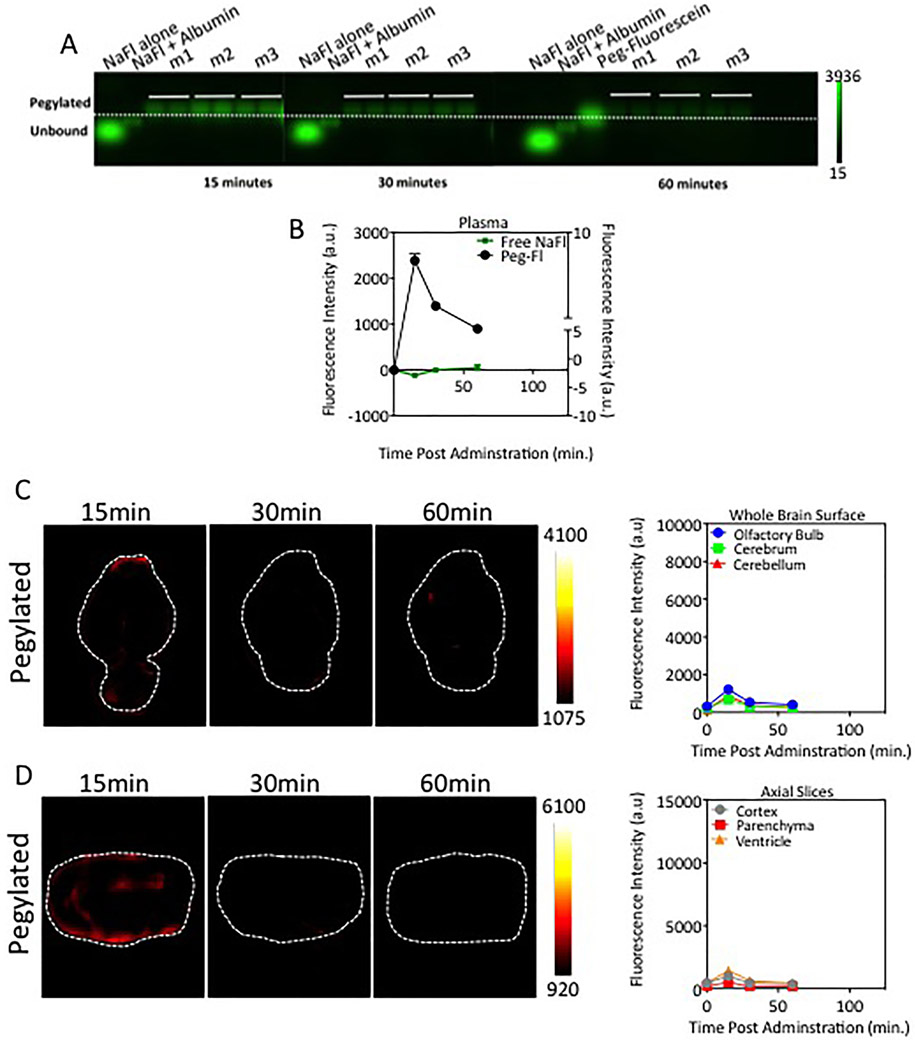
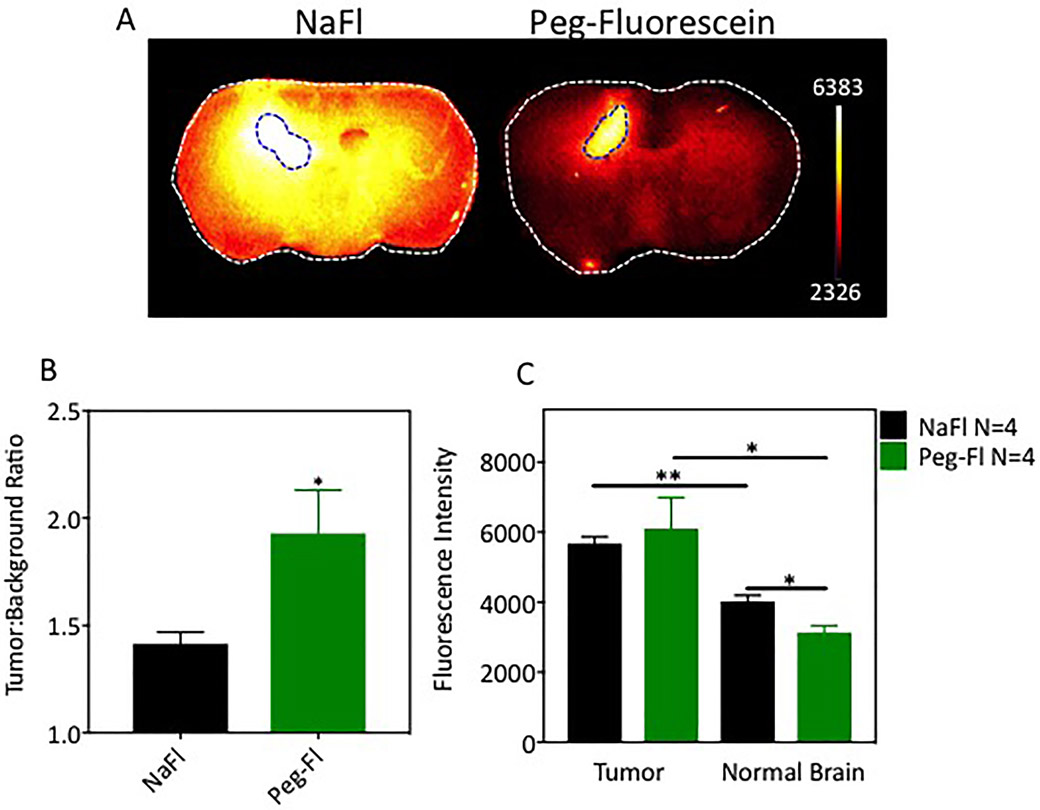
Methods: Cohorts of mice were administered one of the following doses/forms of NaFl: 1) high human equivalent dose (HED) of NaFl, 2) low HED of NaFl, or 3) pegylated form of fluorescein. In each cohort, groups of animals were euthanized 15, 30, 60, and 120 minutes after administration for ex vivo analysis of fluorescein fluorescence. Using gel electrophoresis and fluorescence imaging of blood and brain specimens, the authors quantified the temporal kinetics of bound NaFl, unbound NaFl, and pegylated fluorescein in the blood and normal brain tissue. Finally, they compared tumor-to-normal contrast for NaFl and pegylated-fluorescein in U251 glioma xenografts.

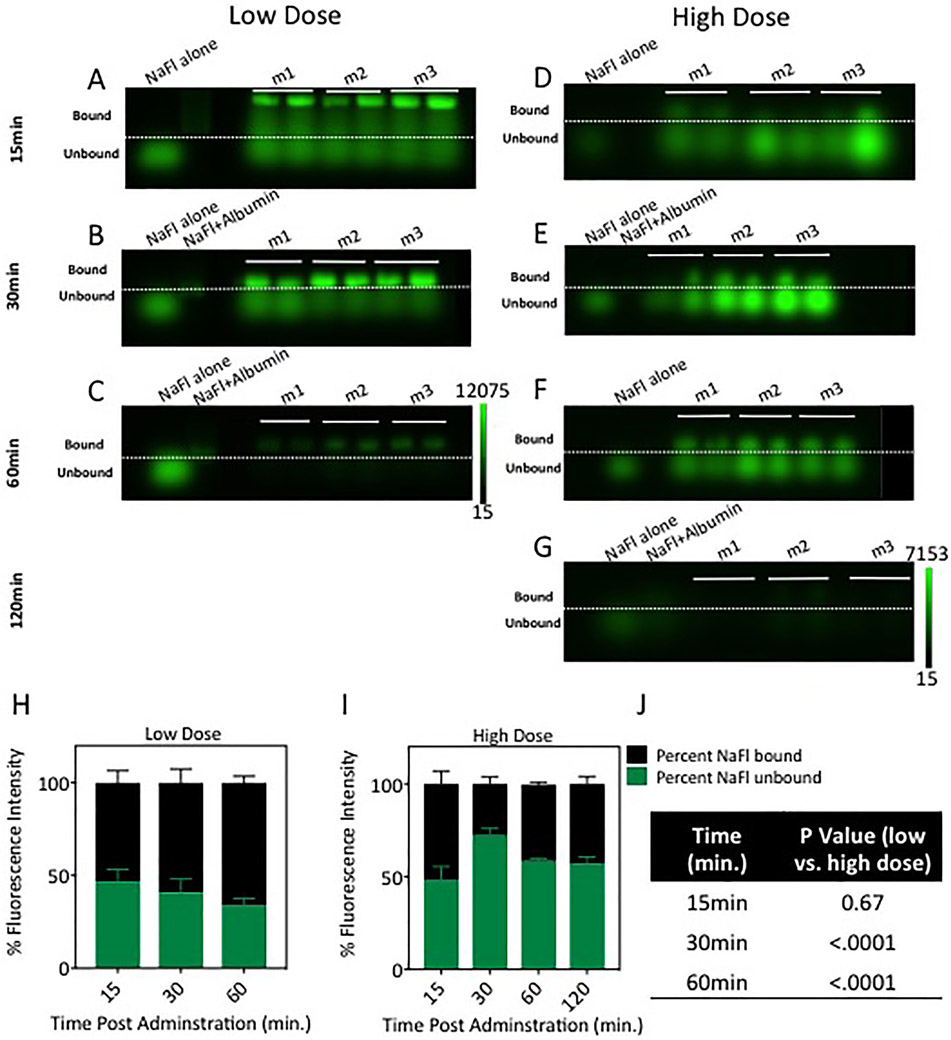
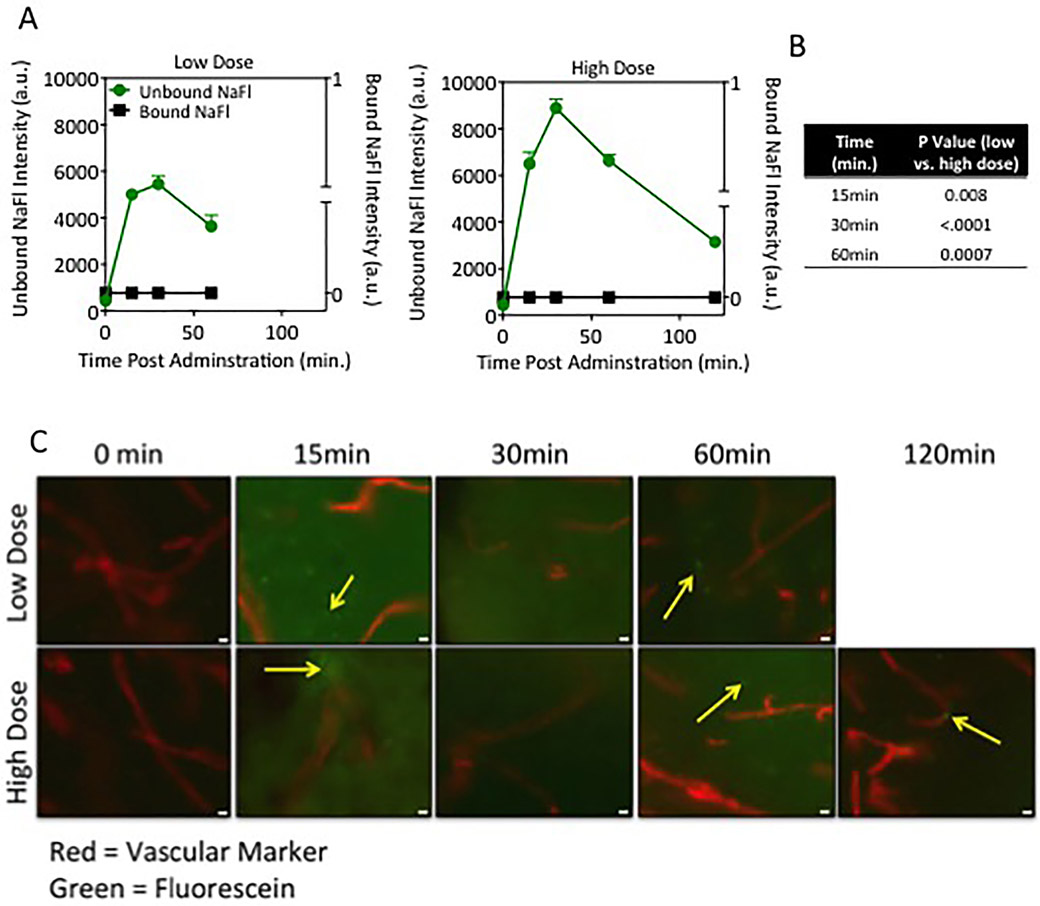
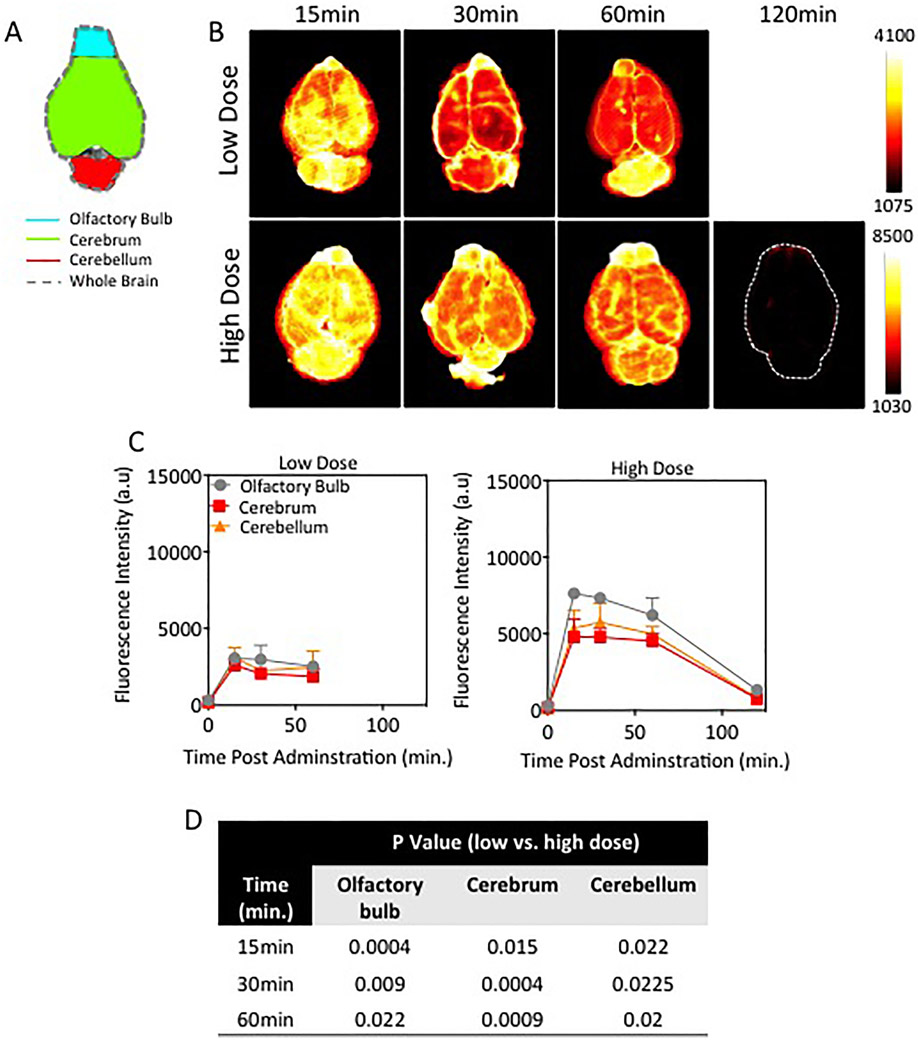
Results: Administration of NaFl resulted in the presence of unbound and protein-bound NaFl in the circulation, with unbound NaFl constituting up to 70% of the signal. While protein-bound NaFl was undetectable in brain tissue, unbound NaFl was observed throughout the brain. The observed behavior was time and dose dependent. The pegylated form of fluorescein showed minimal uptake in brain tissue and improved tumor-to-normal contrast by 38%.

Conclusions: Unbound NaFl in the blood crosses the BBB, limiting the achievable tumor-to-normal contrast and undermining the inherent advantage of tumor imaging in the brain. Dosing and incubation time should be considered carefully for NaFl-based fluorescence-guided surgery (FGS) of glioma. A pegylated form of fluorescein showed more favorable normal tissue kinetics that translated to higher tumor-to-normal contrast. These results warrant further development of pegylated-fluorescein for FGS of glioma.

Keywords: BBB = blood-brain barrier; FGS = fluorescence-guided surgery; HED = human equivalent dose; NaFl = sodium fluorescein; PBS = phosphate-buffered saline; ROI = region of interest; blood-brain barrier; brain tumor; fluorescence-guided surgery; oncology; sodium fluorescein; surgical technique.


Conflict of interest statement

Disclosures

The authors report no conflict of interest concerning the materials or methods used in this study or the findings specified in this paper.

Figures

Fig. 1.
Fig. 1.
Explanatory diagram of the blood and normal brain kinetic study. Cohorts of study animals were administered (via tail vein) low-dose NaFL, high-dose NaFl, or pegylated-fluorescein (PEG-fluorescein) at 15, 30, 60, or 120 minutes before euthanasia. Blood and tissue specimens were then harvested and used to analyze the presence of different forms of fluorescein in various tissue/blood compartments. fl= fluorescein. Figure is available in color online only.
Fig. 2.
Fig. 2.
Quantification of unbound and bound NaFl in the blood circulation. Gel electrophoresis images of NaFl in blood serum at different times after administration are presented in A–G; low-dose administration data are shown in A–C and high dose in D–G. In a given gel panel, the columns represent, from left to right, the following: control containing diluted stock unbound NaFl (NaFl alone), control containing stock NaFl prebound to albumin (NaFl+Albumin), and blood samples from each of 3 mice (m1, m2, and m3 [2 samples were run per mouse]). The dashed lines delineate bound NaFl (above the dotted line) from unbound NaFl (below the dashed line), which were separated by weight in the gel. The percentages of the total fluorescent signal originating from the unbound and bound NaFl, computed from the gel images, are shown in H and I. Table of p values showing the difference in the percentage of unbound fluorescein between low- and high-dose cohorts at 15, 30, and 60 minutes postadministration is shown in J. Figure is available in color online only.
Fig. 3.
Fig. 3.
Unbound NaFl crosses the BBB and extravasates into normal brain tissue. A: Quantitation of unbound and bound NaFl detected in whole brain extracts calculated from gel electrophoresis (a.u. = arbitrary units). B: Table of p values showing the difference between the amount of unbound fluorescein in normal brain tissue between low- and high-dose cohorts at all corresponding time points (15, 30, and 60 minutes) after administration. C: Representative fluorescence photomicrographs of naïve brain tissue sections 15, 30, 60, and 120 minutes post–NaFl administration. Original magnification ×20; scale bar = 20 μm. The red structures indicate lectin-stained vessels and green fluorescence indicates NaFl (n = 3–4 mice/group).
Fig. 4.
Fig. 4.
Superficial distribution of NaFl in the naive rodent brain. A: Schematic of mouse brain outlining ROIs (olfactory bulb, cerebrum, and cerebellum) analyzed for spatial and temporal distribution of NaFl. B: Representative fluorescence images of ex vivo naïve brains at different times after administration of low- or high-dose NaFl. C: Time-dependent NaFl fluorescence intensity in normal brain regions (n = 3–4 mice/time point/dose). D: Table of p values showing the difference in the amount of superficial fluorescein fluorescence between low- and high-dose experimental cohorts is exhibited. Figure is available in color online only.
Fig. 5.
Fig. 5.
Extravasation of NaFl from internal regions within the naïve brain. A: Representative fluorescence images of axial sections from the naïve midbrain in mice injected with a low or high dose of NaFl at different time points after administration. B: Time-dependent fluorescence intensity in subregions (cortex, parenchyma, and ventricles) of axial cross sections from naïve rodent brains (n = 3–4 mice/time point/dose). C: Table displaying p values from the comparison of fluorescein fluorescence in brain subregions (cortex, parenchyma, and ventricular regions) in low-versus high-dose experimental cohorts. Figure is available in color online only.
Fig. 6.
Fig. 6.
Pegylated-fluorescein administration results in reduced accumulation in normal brain tissue. A: Agarose gels of PEG-fluorescein in the blood. Similar to Fig. 3, the columns represent, from left to right, the following: control containing diluted stock unbound NaFl (NaFl alone), control containing stock NaFl prebound to albumin (NaFl+Albumin), PEG-fluorescein control, and fluorescence signals from blood samples from each of 3 mice (m1, m2, and m3 (2 samples were run per mouse]). B: Temporal behavior of pegylated-fluorescein in the blood, computed from the gels is displayed. C: Representative fluorescence images of whole brain surface distribution of pegylated-fluorescein and the fluorescence intensity over time in superficial brain regions (olfactory bulb, cerebrum, and cerebellum) for pegylated-fluorescein. D: Fluorescence axial sections of ex vivo brain samples postadministration of PEG-fluorescein and the fluorescence intensity of PEG-fluorescein in the internal brain subregions (cortex, parenchyma and ventricular regions) measured from brain slices. The pegylated form shows much lower transport into normal brain tissue. All scales (color scales and y-axis in quantitative graphs) were set to provide direct comparison to low-dose NaFl cohorts in Figs. 4B and C and 5A and B. Figure is available in color online only.
Fig. 7.
Fig. 7.
Pegylated-fluorescein and NaFl in glioma-bearing brains. A: Representative fluorescence images of axial slices of excised brains 60 minutes after administration of NaFl or PEG-fluorescein (true tumors are outlined with blue dashed line). B: Tumor-to–contralateral normal brain tissue contrast for NaFl and PEG-fluorescein. C: Fluorescence signal intensity in tumor and normal regions. *p < 0.05; **p < 0.005 (n = 4 mice per cohort).

References

    1. Acerbi F, Broggi M, Eoli M, Anghileri E, Cuppini L, Pollo B, et al.: Fluorescein-guided surgery for grade IV gliomas with a dedicated filter on the surgical microscope: preliminary results in 12 cases. Acta Neurochir (Wien) 155:1277–1286, 2013 - PubMed
    1. Anderson CF, Cui H: Protease-sensitive nanomaterials for cancer therapeutics and imaging. Ind Eng Chem Res 56:5761–5777, 2017 - PMC - PubMed
    1. Delori FC, Castany MA, Webb RH: Fluorescence characteristics of sodium fluorescein in plasma and whole blood. Exp Eye Res 27:417–425, 1978 - PubMed
    1. Dimou S, Battisti RA, Hermens DF, Lagopoulos J: A systematic review of functional magnetic resonance imaging and diffusion tensor imaging modalities used in presurgical planning of brain tumour resection. Neurosurg Rev 36:205–214, 2013 - PubMed
    1. Ding R, Frei E, Fardanesh M, Schrenk HH, Kremer P, Haefeli WE: Pharmacokinetics of 5-aminofluorescein-albumin, a novel fluorescence marker of brain tumors during surgery. J Clin Pharmacol 51:672–678, 2011 - PubMed

Publication types