. 2018 Sep 7:7:e37202.
doi: 10.7554/eLife.37202.

tp53 deficiency causes a wide tumor spectrum and increases embryonal rhabdomyosarcoma metastasis in zebrafish

Affiliations

tp53 deficiency causes a wide tumor spectrum and increases embryonal rhabdomyosarcoma metastasis in zebrafish

Myron S Ignatius et al. Elife. .

Abstract

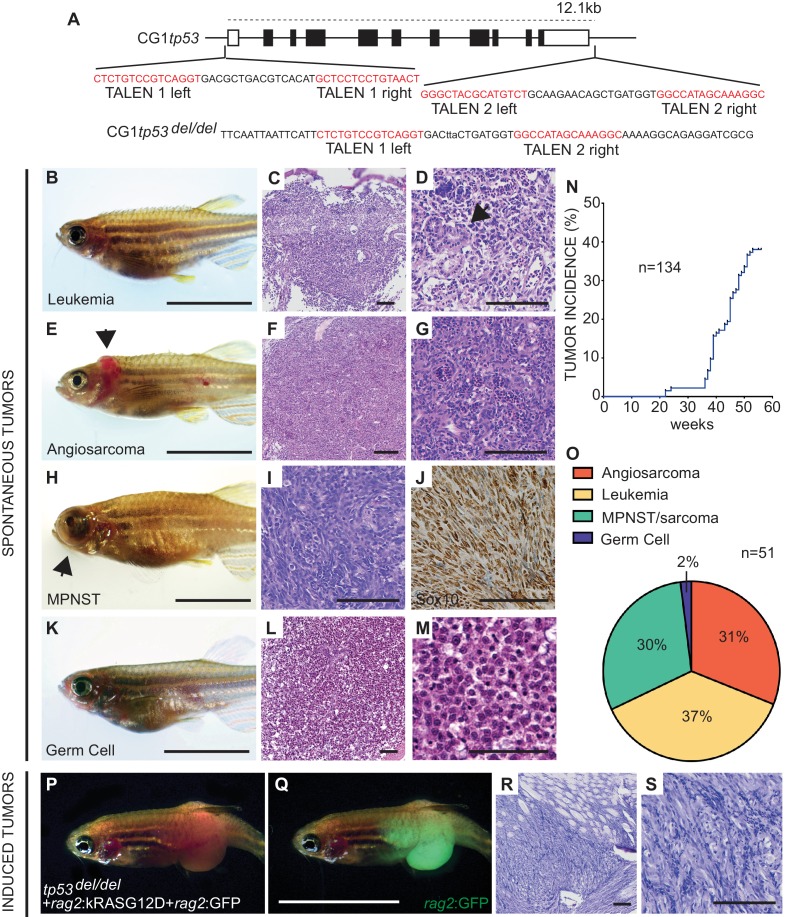
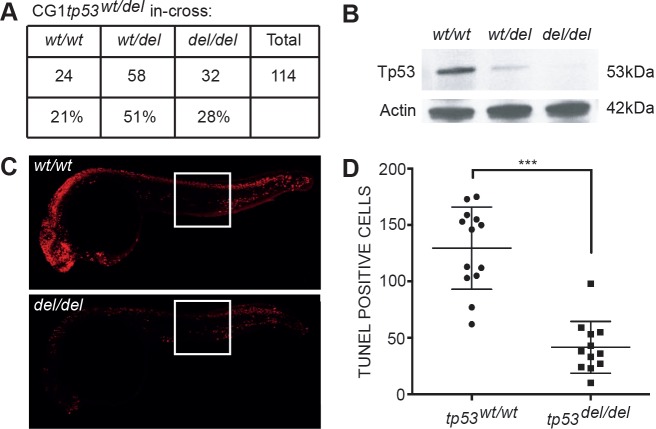
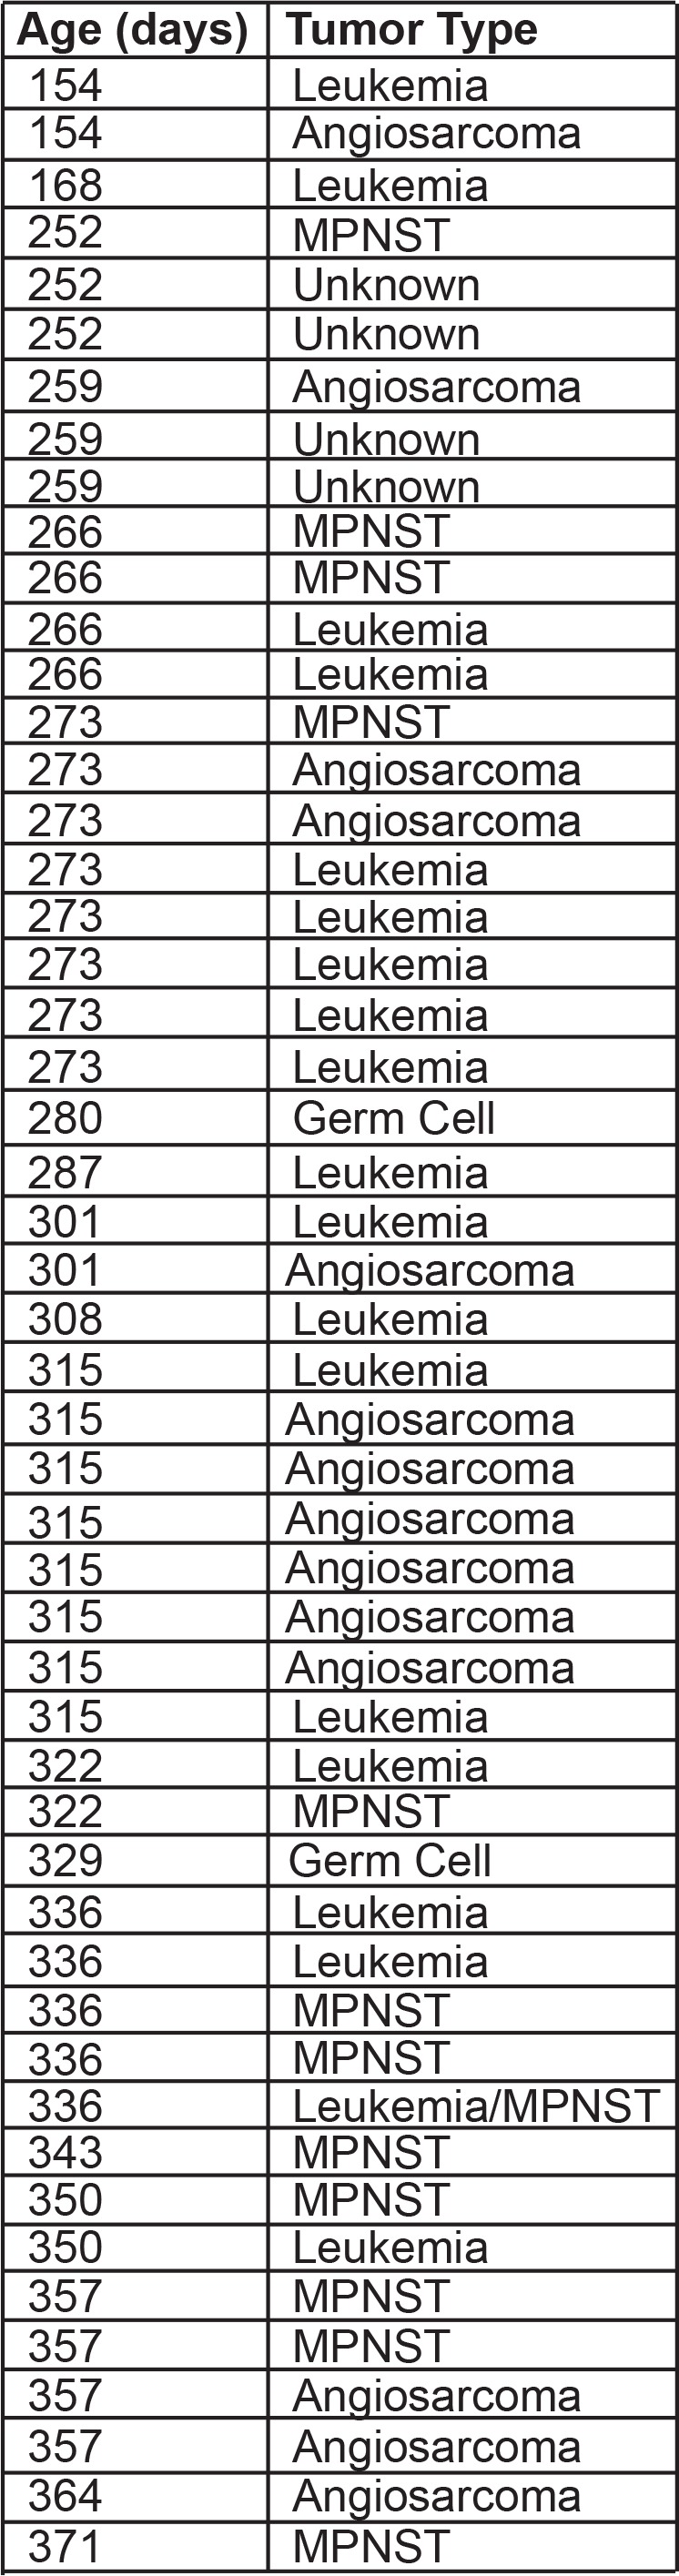
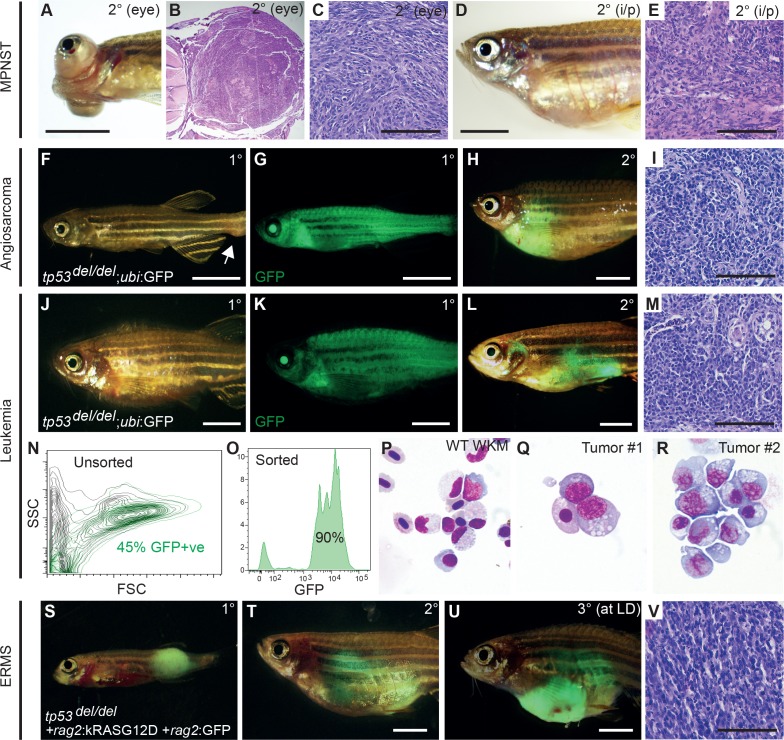
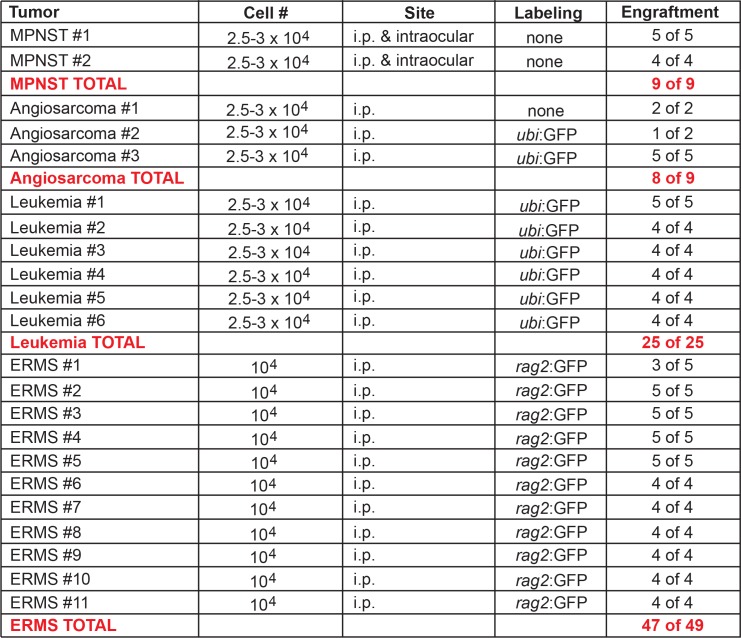
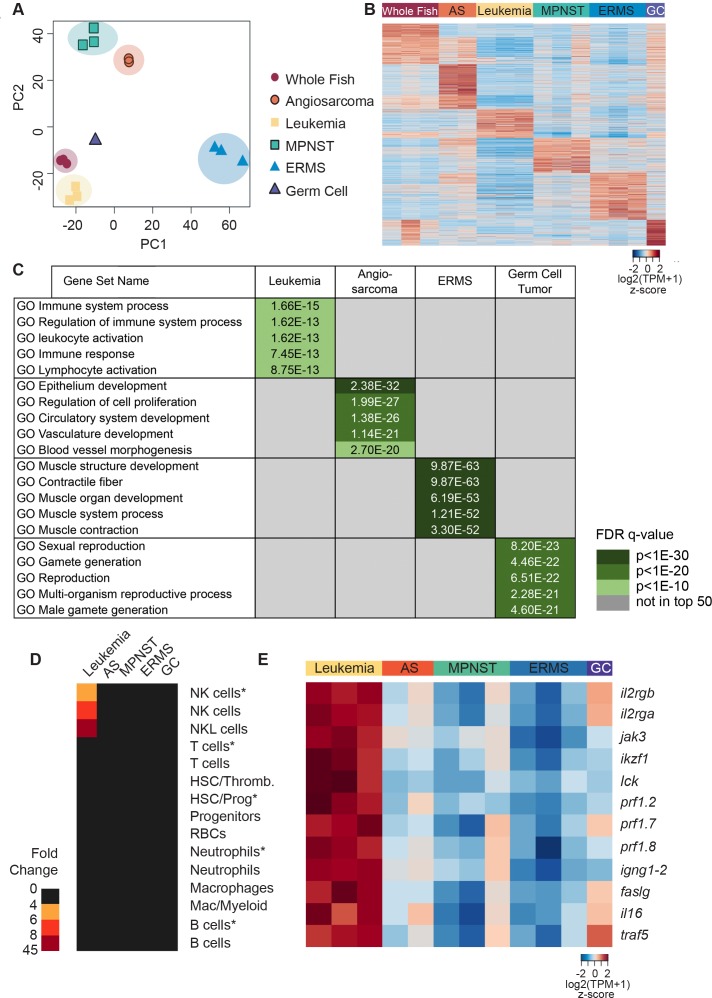
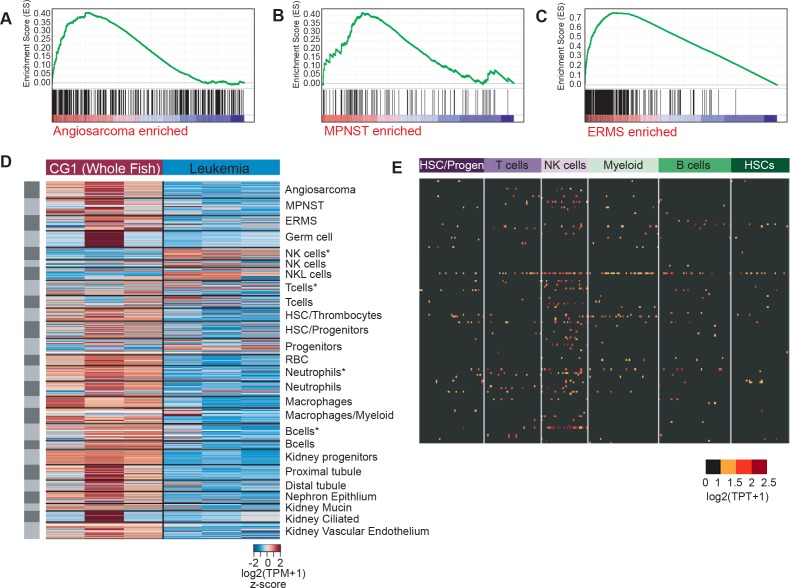
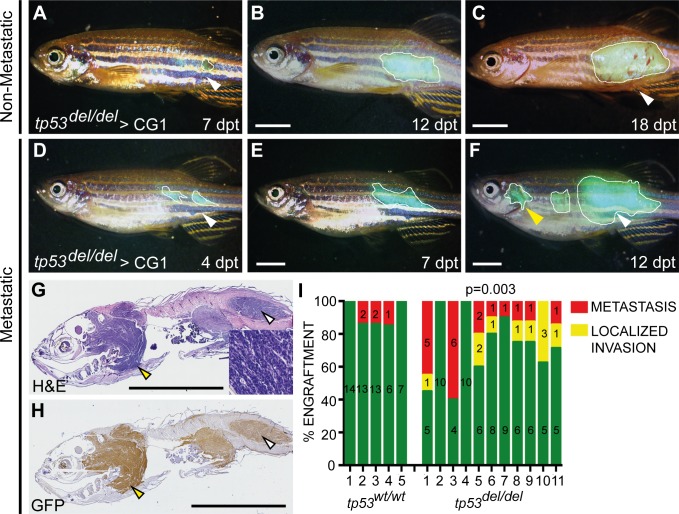
The TP53 tumor-suppressor gene is mutated in >50% of human tumors and Li-Fraumeni patients with germ line inactivation are predisposed to developing cancer. Here, we generated tp53 deleted zebrafish that spontaneously develop malignant peripheral nerve-sheath tumors, angiosarcomas, germ cell tumors, and an aggressive Natural Killer cell-like leukemia for which no animal model has been developed. Because the tp53 deletion was generated in syngeneic zebrafish, engraftment of fluorescent-labeled tumors could be dynamically visualized over time. Importantly, engrafted tumors shared gene expression signatures with predicted cells of origin in human tissue. Finally, we showed that tp53del/del enhanced invasion and metastasis in kRASG12D-induced embryonal rhabdomyosarcoma (ERMS), but did not alter the overall frequency of cancer stem cells, suggesting novel pro-metastatic roles for TP53 loss-of-function in human muscle tumors. In summary, we have developed a Li-Fraumeni zebrafish model that is amenable to large-scale transplantation and direct visualization of tumor growth in live animals.

Keywords: MPNST; angiosarcoma; cancer biology; germ cell tumor; leukemia; metastasis; rhabdomyosarcoma; zebrafish.


Conflict of interest statement

MI, MH, FM, QT, SG, PB, KB, LW, AJ, AR, SR, YC, GN, EC, RH, FT, SE, DL No competing interests declared

Figures

Figure 1.
Figure 1.. Homozygous tp53del/del zebrafish spontaneously develop a wide range of tumor types.
(A) tp53 genomic locus and CG1 tp53del/del allele. TALEN arms were designed to target the 5’ and 3’ genomic sequence of tp53 (red). (B–M) CG1 tp53del/del zebrafish develop leukemia (B–D), angiosarcoma (E–G), MPNSTs (H–J), and germ cell tumors (K–M). Whole animal images (B,E,H,K), hematoxylin/eosin (H and E) stained sections (C,D,F,G,I,L,M), and immunohistochemistry for Sox10 (J). Blast-like leukemia cells predominate in the kidney marrow and efface the renal tubules (black arrow, (D). (N) Tumor incidence in CG1 tp53del/del zebrafish (n = 134). (O) Quantitation of tumor types that form in CG1 tp53del/del mutant zebrafish by 55 weeks of life based on histology review (n = 51). (P–S) kRASG12D-induced embryonal rhabdomyosarcoma (ERMS) generated in CG1 tp53del/del zebrafish. Whole animal bright field and GFP-epifluorescence overlap images (P and Q, respectively). H and E stained sections revealed features consistent with human ERMS (R,S). Scale bars equal 12.5 mm in whole animal images and 100 μm in histology images.
Figure 1—figure supplement 1.
Figure 1—figure supplement 1.. tp53del/del zebrafish survive at expected Mendelian ratios, lack Tp53 protein expression, and are resistant to irradiation-induced cell death.
(A) Survival of animals by genotype from a heterozygous tp53wt/del in-cross. tp53 homozygous wild-type (wt/wt), heterozygous (wt/del), and homozygous (del/del) mutant fish. (B) Western blot analysis at 24 hr post-fertilization (hpf) whole embryos. Actin is used as a loading control. (C–D) TUNEL staining performed on tp53wt/wt and tp53del/del embryos following gamma-irradiation at 24hpf (16 Gray) and fixation at 30hpf. Whole embryos images are shown for representative animals of each genotype (C). Quantification of TUNEL-positive cells within 1000 micron2 area. Regions where cells were counted are outlined by the white boxes in panel C. p<0.001 by Student’s T-test.
Figure 1—figure supplement 2.
Figure 1—figure supplement 2.. Tumor latency in tp53del/del zebrafish.
Designation as assessed by histology review.
Figure 2.
Figure 2.. tp53del/del tumors efficiently transplant into syngeneic CG1 strain zebrafish.
(A–E) A primary tp53del/del MPNSTs that formed in the eye transplanted orthotopically into the periocular space (A–C) or into the peritoneum of CG1-strain recipient fish (D–E). Intraperitoneal injection (i/p). (F–I) tp53del/del Tg(ubi:GFP)-positive angiosarcoma. Primary tumor-bearing fish (F–G) and transplanted animal (H–I). (J–R) tp53del/del Tg(ubi:GFP)-positive leukemia. Primary leukemia (J–K) and transplanted leukemia shown at 20 days post-transplantation (L–R). Whole kidney marrow was isolated from leukemia-engrafted fish and analyzed by FACS (N–O). (N) Forward and side scatter plot of whole kidney marrow of unlabeled CG1 host animal to assess ubi:GFP-positive tp53del/del leukemia cells following transplantation. (O) Analysis of GFP+ ubi:GFP-positive tp53del/del leukemia cells following FACS. Purity was ≥90%. (P–R) Cytospins and Wright/Giemsa staining of whole kidney marrow cells isolated from wildtype fish (P) compared with FACS sorted GFP+ cells from two representative aggressive NK cell-like leukemias, showing large blastic cells with abundant basophilic, vacuolated cytoplasm (Q–R). (S–V) Embryonal rhabdomyosarcoma arising in tp53del/del fish micro-injected at the one-cell stage with linearized rag2:kRASG12D + rag2:GFP. Primary (S), transplanted (2°) (T), and serially transplanted ERMS (3°) (U,V). Whole animal bright-field images (A,D,F,J) and merged GFP-fluorescence images (G,H,K,L,S–U). Hematoxylin and eosin stained sections of engrafted tumors (B–C,E, I, M,V). Scale bars are 5 mm in whole animal images and 100 μm for histology images.
Figure 2—figure supplement 1.
Figure 2—figure supplement 1.. Engraftment of tp53del/del tumors into CG1 recipient zebrafish.
Engraftment was scored at >20 days post transplantation. i.p. intraperitoneal.
Figure 3.
Figure 3.. Gene expression analysis of tp53del/del tumors.
(A) Principal component analysis (PCA) of gene expression profiles from whole CG1 syngeneic fish, MPNSTs, a germ cell tumor, and FACS sorted GFP+ leukemia, angiosarcomas, and ERMS. All tumor samples were obtained following engraftment in CG1 syngeneic recipient fish. (B) Heat map of genes differentially expressed with respect to controls identifies molecularly defined tumor groups. (C) Upregulated genes identified within each tumor type are enriched for Molecular Signature Database (MSigDB) signatures consistent with the expected tissue of origin. (D) NK cell leukemias are enriched for gene signatures identified from normal NK and NKL cells in the kidney marrow and NK cells isolated from rag1-/-, tg(lck:GFP) transgenic fish (NK cells*). For each analysis, enrichment is shown for the top 30 lineage-restricted genes identified from single-cell transcriptional profiling of transgenic cells using SMARTseq2 (denoted by asterisks) or unsorted cells using InDrops single-cell RNA sequencing approaches. (E) Heat map highlighting NK lineage genes significantly upregulated in tp53del/del leukemias when compared to all other tumor types analyzed. [log2(fold-change)]. Angiosarcoma (AS) and germ cell tumor (GC).
Figure 3—figure supplement 1.
Figure 3—figure supplement 1.. Zebrafish cancers share common gene expression with human tumors and confirmation of NK-cell linage derivation for tp53del/del leukemias.
(A–C) GSEA analysis comparing zebrafish tp53del/del tumors to human counterparts. (A) Human angiosarcoma (FDR q-value = 0.001), (B) human MPNST (FDR q-value = 0.00433526), and (C) human ERMS (FDR q-value = 0) gene sets are significantly enriched in the corresponding zebrafish tp53del/del tumors. (D) Heat map depicting differential gene expression in zebrafish tp53del/del leukemias compared to whole CG1 control animals. Gene-expression defines tp53del/del leukemias based on lineage signatures previously generated using InDrop and SMARTseq (asterisk) sequencing approaches (Tang et al., 2017). (E) Expression of the top 200 tp53del/del ANKL-like genes assessed in the SMARTseq dataset from Tang et al. (2017). HSC/progenitors were isolated as cd41:GFPlow cells from transgenic zebrafish, T cells from tg(lck:GFP) transgenic zebrafish, NK cells from rag1-/-, tg(lck:GFP) transgenic zebrafish, myeloid cells from tg(mpx:EGFP) transgenic zebrafish, B cells from marrow-derived tg(rag2:GFP) transgenic zebrafish, and HSCs from tg(runx1+23:GFP) transgenic zebrafish. The tp53del/del leukemia gene expression signature was significantly enriched only in the NK cells (log2(TPM+ 1)≥2, p-value=0.015, one-sided binomial test).
Figure 4.
Figure 4.. tp53del/del kRASG12D-induced ERMS have increased invasion and metastasis.
(A–F) Whole animal fluorescent images of CG1-strain fish engrafted into the dorsolateral musculature with non-disseminated (A–C) and disseminated ERMS (D–F). Days post transplantation (dpt). White lines demarcate GFP+ tumor area. White arrowheads show site of injection and yellow arrowheads denote metastatic lesions. (G) H and E and (H) GFP immunohistological staining of fish engrafted with metastatic tp53del/del kRASG12D-induced ERMS. (I) Quantification of growth confined to site of injection (green bars) and compared with animals that exhibited local invasion or metastatic ERMS following tumor engraftment until fish were moribund. X-axis identifies 5 tp53wt/wt and 11 tp53del/del ERMS primary tumors that were transplanted into wild-type CG1 syngeneic host zebrafish. p=0.003, one-sided Fisher’s exact test. Scale bars denote 5 mm.
Author response image 1.
Author response image 1.. Venn diagram depicting overlap between up-regulated and down-regulated genes when comparing homozygous mutant tp53M214K/M214Kand tp53del/delMPNST to whole adult zebrafish.

References

    1. Andersen NJ, Nickoloff BJ, Dykema KJ, Boguslawski EA, Krivochenitser RI, Froman RE, Dawes MJ, Baker LH, Thomas DG, Kamstock DA, Kitchell BE, Furge KA, Duesbery NS. Pharmacologic inhibition of MEK signaling prevents growth of canine hemangiosarcoma. Molecular Cancer Therapeutics. 2013;12:1701–1714. doi: 10.1158/1535-7163.MCT-12-0893. - DOI - PMC - PubMed
    1. Berghmans S, Murphey RD, Wienholds E, Neuberg D, Kutok JL, Fletcher CD, Morris JP, Liu TX, Schulte-Merker S, Kanki JP, Plasterk R, Zon LI, Look AT. tp53 mutant zebrafish develop malignant peripheral nerve sheath tumors. PNAS. 2005;102:407–412. doi: 10.1073/pnas.0406252102. - DOI - PMC - PubMed
    1. Chen EY, DeRan MT, Ignatius MS, Grandinetti KB, Clagg R, McCarthy KM, Lobbardi RM, Brockmann J, Keller C, Wu X, Langenau DM. Glycogen synthase kinase 3 inhibitors induce the canonical WNT/β-catenin pathway to suppress growth and self-renewal in embryonal Rhabdomyosarcoma. PNAS. 2014;111:5349–5354. doi: 10.1073/pnas.1317731111. - DOI - PMC - PubMed
    1. Chen X, Stewart E, Shelat AA, Qu C, Bahrami A, Hatley M, Wu G, Bradley C, McEvoy J, Pappo A, Spunt S, Valentine MB, Valentine V, Krafcik F, Lang WH, Wierdl M, Tsurkan L, Tolleman V, Federico SM, Morton C, Lu C, Ding L, Easton J, Rusch M, Nagahawatte P, Wang J, Parker M, Wei L, Hedlund E, Finkelstein D, Edmonson M, Shurtleff S, Boggs K, Mulder H, Yergeau D, Skapek S, Hawkins DS, Ramirez N, Potter PM, Sandoval JA, Davidoff AM, Mardis ER, Wilson RK, Zhang J, Downing JR, Dyer MA, St. Jude Children’s Research Hospital–Washington University Pediatric Cancer Genome Project Targeting oxidative stress in embryonal Rhabdomyosarcoma. Cancer Cell. 2013;24:710–724. doi: 10.1016/j.ccr.2013.11.002. - DOI - PMC - PubMed
    1. Choorapoikayil S, Kuiper RV, de Bruin A, den Hertog J. Haploinsufficiency of the genes encoding the tumor suppressor pten predisposes zebrafish to hemangiosarcoma. Disease Models & Mechanisms. 2012;5:241–247. doi: 10.1242/dmm.008326. - DOI - PMC - PubMed

Publication types

MeSH terms

Substances