

Mixed graphical models for integrative causal analysis with application to chronic lung disease diagnosis and prognosis
- PMID: 30192904
- PMCID: PMC6449754
- DOI: 10.1093/bioinformatics/bty769
Mixed graphical models for integrative causal analysis with application to chronic lung disease diagnosis and prognosis
Abstract
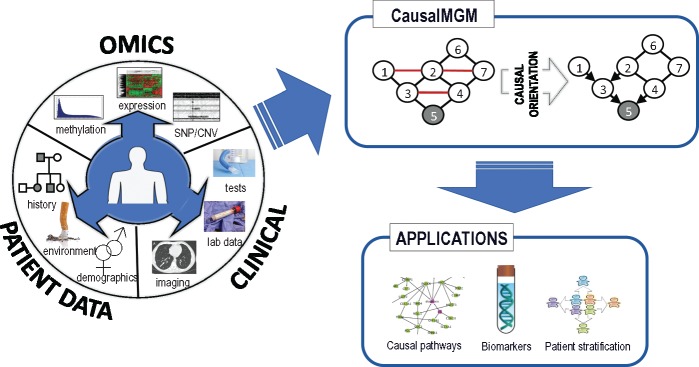
Motivation: Integration of data from different modalities is a necessary step for multi-scale data analysis in many fields, including biomedical research and systems biology. Directed graphical models offer an attractive tool for this problem because they can represent both the complex, multivariate probability distributions and the causal pathways influencing the system. Graphical models learned from biomedical data can be used for classification, biomarker selection and functional analysis, while revealing the underlying network structure and thus allowing for arbitrary likelihood queries over the data.
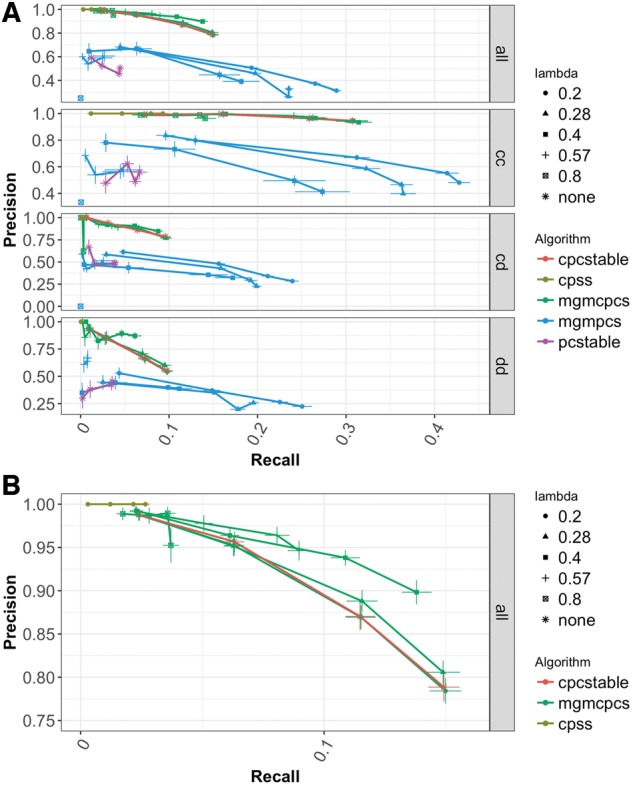
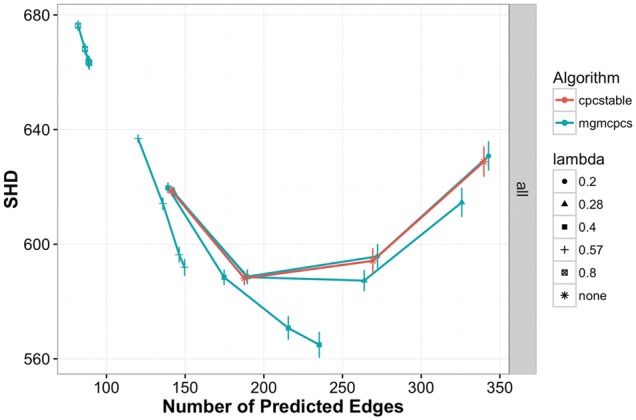
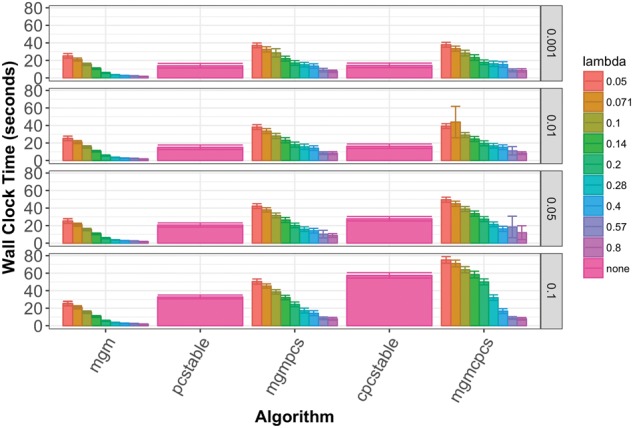
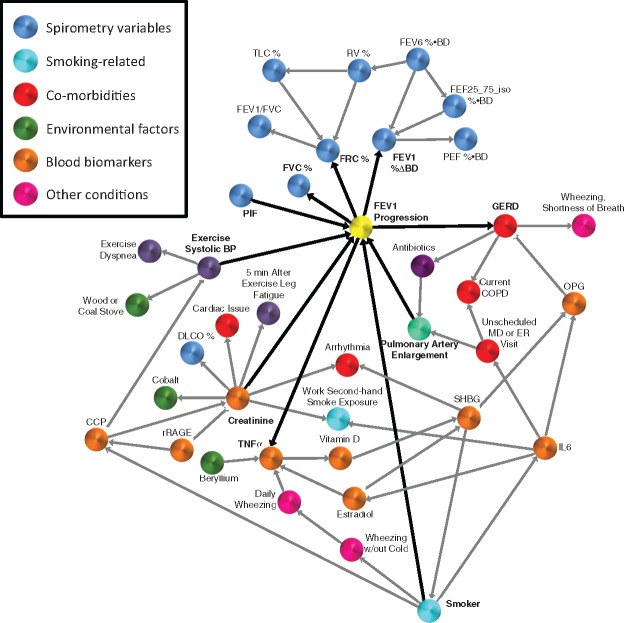
Results: In this paper, we present and test new methods for finding directed graphs over mixed data types (continuous and discrete variables). We used this new algorithm, CausalMGM, to identify variables directly linked to disease diagnosis and progression in various multi-modal datasets, including clinical datasets from chronic obstructive pulmonary disease (COPD). COPD is the third leading cause of death and a major cause of disability and thus determining the factors that cause longitudinal lung function decline is very important. Applied on a COPD dataset, mixed graphical models were able to confirm and extend previously described causal effects and provide new insights on the factors that potentially affect the longitudinal lung function decline of COPD patients.
Availability and implementation: The CausalMGM package is available on http://www.causalmgm.org.
Supplementary information: Supplementary data are available at Bioinformatics online.
© The Author(s) 2018. Published by Oxford University Press. All rights reserved. For permissions, please e-mail: journals.permissions@oup.com.
Figures
References
-
- Agusti A. et al. (2011) Addressing the complexity of chronic obstructive pulmonary disease: from phenotypes and biomarkers to scale-free networks, systems biology, and P4 medicine. Am. J. Respir. Crit. Care Med., 183, 1129–1137. - PubMed
-
- Anthonisen N.R. et al. (2002) Smoking and lung function of Lung Health Study participants after 11 years. Am. J. Respir. Crit. Care Med., 166, 675–679. - PubMed
-
- Anttila S. et al. (2001) CYP1A1 levels in lung tissue of tobacco smokers and polymorphisms of CYP1A1 and aromatic hydrocarbon receptor. Pharmacogenetics, 11, 501–509. - PubMed
-
- Baumgartner K.B. et al. (1997) Cigarette smoking: a risk factor for idiopathic pulmonary fibrosis. Am. J. Respir. Crit. Care Med., 155, 242–248. - PubMed
-
- Bøttcher S.G. (2001) Learning Bayesian networks with mixed variables. In: Eighth International Workshop on Artificial Intelligence and Statistics. Key West, Florida, 149–156.
Publication types
MeSH terms
Grants and funding
LinkOut - more resources
Full Text Sources
Other Literature Sources
Medical
