. 2018 Sep 6;46(15):7805-7819.
doi: 10.1093/nar/gky581.

Single molecule tracking reveals that the bacterial SMC complex moves slowly relative to the diffusion of the chromosome

Affiliations

Single molecule tracking reveals that the bacterial SMC complex moves slowly relative to the diffusion of the chromosome

Sonja Schibany et al. Nucleic Acids Res. .

Abstract

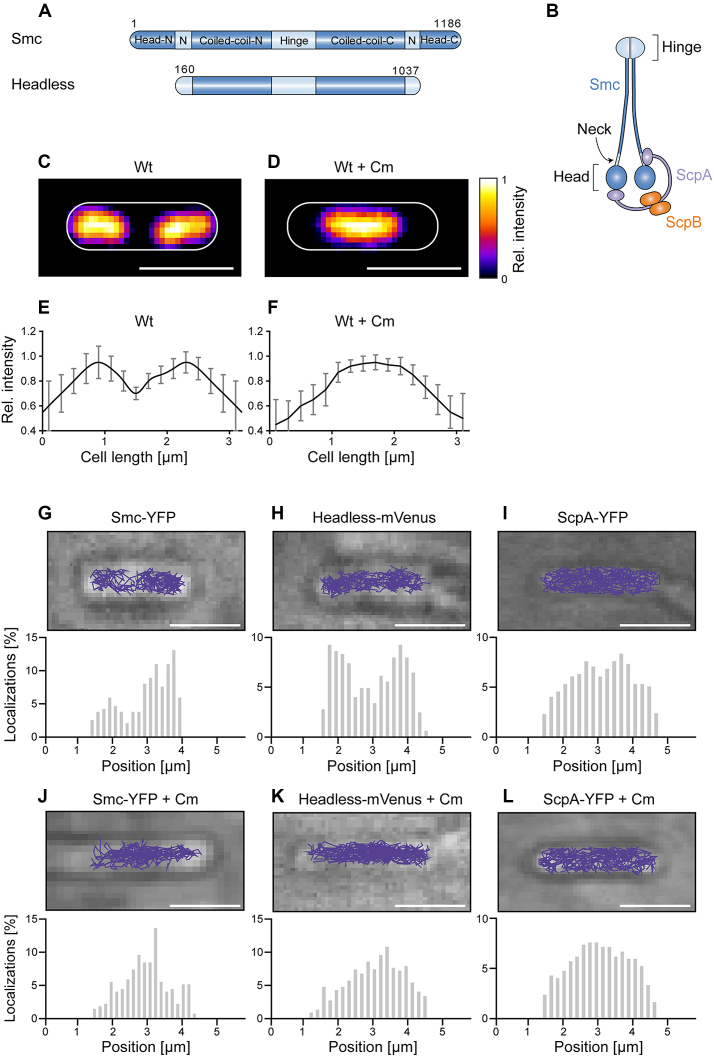
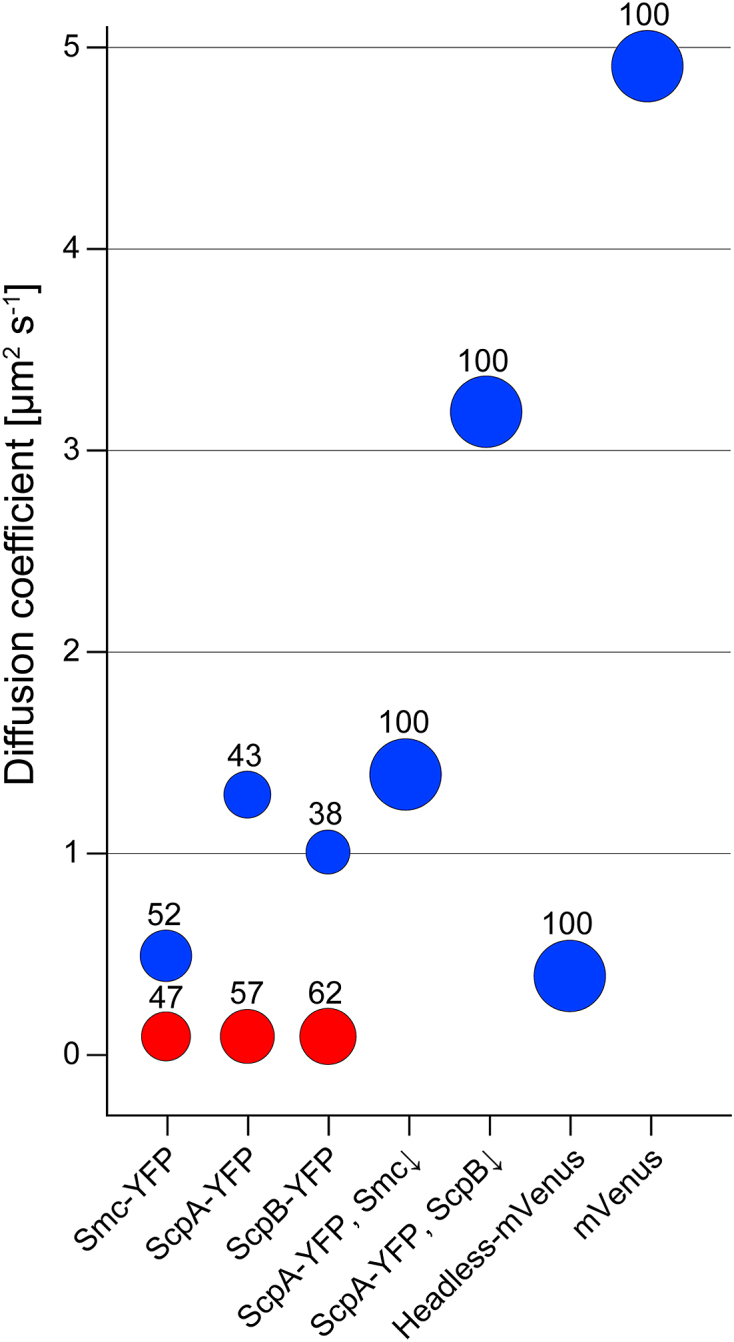
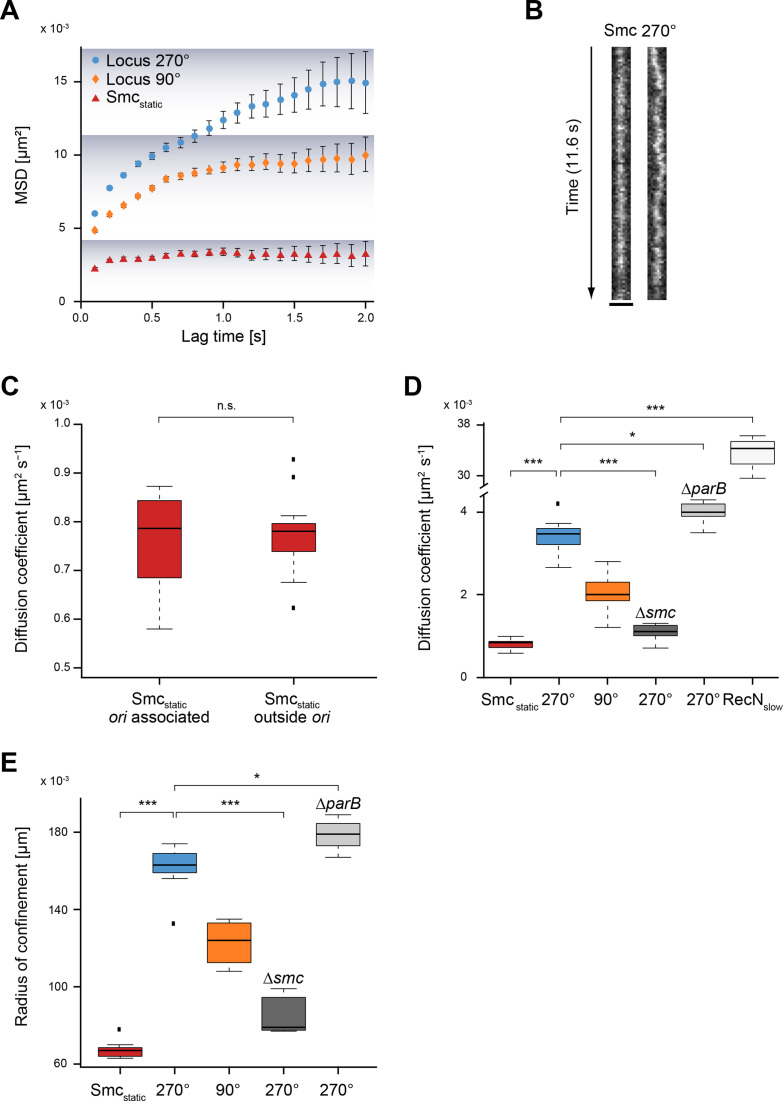
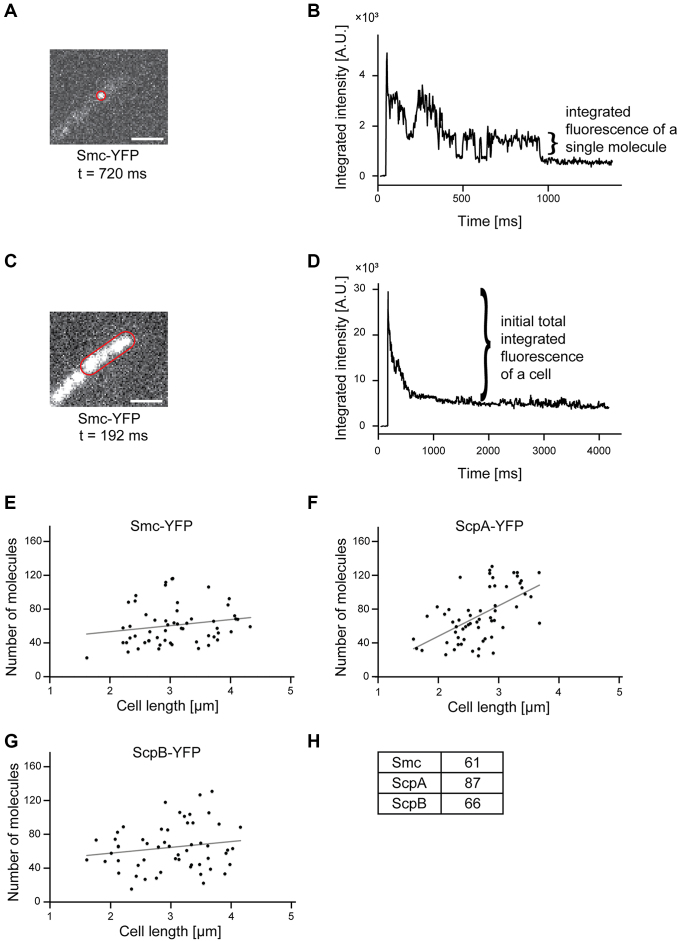
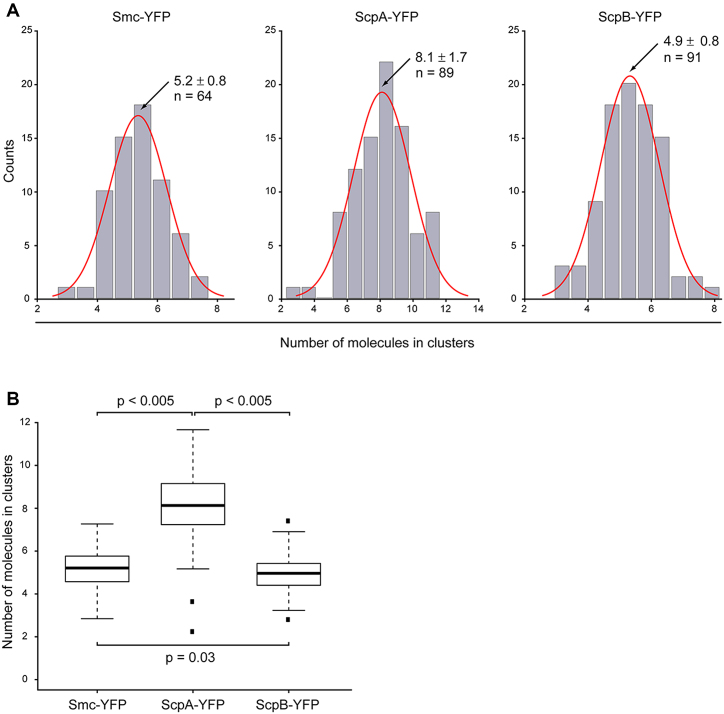
Structural Maintenance of Chromosomes (SMC) proteins and their complex partners (ScpA and ScpB in many bacteria) are involved in chromosome compaction and segregation in all kinds of organisms. We employed single molecule tracking (SMT), tracking of chromosomal loci, and single molecule counting in Bacillus subtilis to show that in slow growing cells, ∼30 Smc dimers move throughout the chromosome in a constrained mode, while ∼60 ScpA and ScpB molecules travel together in a complex, but independently of the nucleoid. Even an Smc truncation that lacks the ATP binding head domains still scans the chromosome, highlighting the importance of coiled coil arm domains. When forming a complex, 10-15 Smc/ScpAB complexes become essentially immobile, moving slower than chromosomal loci. Contrarily, SMC-like protein RecN, which forms assemblies at DNA double strand breaks, moves faster than chromosome sites. In the absence of Smc, chromosome sites investigated were less mobile than in wild type cells, indicating that Smc contributes to chromosome dynamics. Thus, our data show that Smc/ScpAB clusters occur at several sites on the chromosome and contribute to chromosome movement.


Figures

Figure 1.
Figure 1.
(A) Domain organization of Smc and of headless Smc. Residue numbering corresponds to amino acids of Smc of Bacillus subtilis. Head-N: N-terminal part of head domain, N: Neck region, Coiled-coil-N: N-terminal coiled coil, Coiled-coil-C: C-terminal coiled coil, Head-C: C-terminal part of head domain. All proteins are tagged with the fluorescent proteins YFP or mVenus at the C-terminus. (B) The scheme indicates the organization of the complex of Smc, ScpA, and ScpB. (C) Typical image of a DAPI-stained cell of length ∼3.2 μm, (D) same as (C) after addition of chloramphenicol, (E and F) Distribution of normalized DAPI fluorescence in cells of ∼3.2 μm length in exponentially growing cells (n = 22) and in cells treated with chloramphenicol (n = 19) which results in a single compacted nucleoid in the cell middle. (G–L) The spatial organization of Smc and headless tracks reflects the organization of the nucleoid in exponentially growing B. subtilis cells, whereas ScpA tracks cover the entire cell. Upper panels show typical tracks obtained in a single cell, lower panels are histograms of localizations projected onto the long cell axis. Chloramphenicol treatment was used as a test for tracking on the nucleoid. Tracks were analyzed in cells of ∼3.2 μm length for better comparison.
Figure 2.
Figure 2.
Bubble plot showing percentages of static (red) and dynamic (blue) fractions for the various constructs. Please refer to Table 1 for the detailed diffusion coefficients and fractions together with standard deviations, derived from at least three independent experiments.
Figure 3.
Figure 3.
(A) Overlay of average fluorescence of ScpA-YFP from first ten frames with tracks of static molecules (diameter less than three pixels) that could be tracked later in the experiment (blue circle). The highest fluorescence intensity in the first frame in each cell half is indicated by a red circle. (B) Image of static ScpA-YFP tracks. (C) Number of static molecules per 2 μm cell length during 1500 frames (8 ms exposure time) which were >100 nm apart (n = 38 cells, 172 static tracks, mean = 4.2 ± 2.8 (SD) static molecules) (strain: ScpA-YFP). (D) Histograms of the distance of centroids of ScpA-YFP tracks to the highest fluorescence in the first frame, static molecules indicated in blue, mobile molecules in red.
Figure 4.
Figure 4.
Smc is immobile in the cell, while chromosomal loci show substantial movement. (A) Mean squared displacement (MSD) versus lag time. Smcstatic (red) shows about three times less movement than chromosomal loci (270° blue, 90° yellow) as can also be deduced from the linear fit to the first 3 time points of the MSD curve. The confinement is indicated by the shadowing in the plot. (B) Kymograph showing that movement of Smc-YFP is lower than that of locus 270°. (C) Smcstatic does not move significantly faster or slower if origin associated Smcstatic is compared with Smcstatic outside origins (unpaired, two-sided Student's t-test, P = 0.7305, Smcstatic origin associated: n = 12, Smcstatic outside origins: n = 19). Black dots are considered outliers (lie outside of 1.5 ITR). (D) Box plot of diffusion coefficients from seven independent experiments (with at least n = 250 tracks) for each condition. Statistical differences between static Smc-YFP and the two chromosome loci are highly significant (***), as are differences of locus 270° between wild type and smc mutant (Δsmc) cells. Differences in movement of locus 270° between wild type and ΔparB cells are small but statistically significant (*). (E) Box plot of radius of confinement, i.e. the radius reached by the molecule/locus over 2 s. Statistical evaluation analogous to panel D.
Figure 5.
Figure 5.
(A) Fluorescence of a single molecule whose outline is indicated by a red line. The scale bar represents 2 μm. (B) Integrated fluorescence intensity of this single molecule during the stream acquisition. Please note that the acquisition of a single molecule could be clearly detected according to the bleaching step. From this bleaching step, the fluorescence of a single molecule could be measured. (C) Fluorescence of the cell shown in (A). (D) Integrated fluorescence intensity of this cell during the stream acquisition. The total fluorescence of a cell corresponds to the peak intensity minus the baseline intensity after bleaching. (E–G) Number of molecules are plotted against the cell length and a linear regression was performed. A Pearson correlation test of the correlation between cell length and cell number revealed a significant correlation for ScpA-YFP (rho = 0.574, Pearson two-sided significance, n = 60) and no significant correlation for Smc-YFP (rho = 0.188, n = 57) and ScpB (rho = 0.169, n = 55). (H) Numbers of molecules for a cell with an average length of 3 μm.
Figure 6.
Figure 6.
Analysis of numbers of molecules integrated in clusters. (A) Distribution of number of molecules in clusters for Smc-YFP, ScpA-YFP and ScpB-YFP. For Smc-YFP, 5.2 ± 0.8 molecules are integrated in clusters (n = 64), for ScpA-YFP 8.1 ±1.7 molecules are integrated in clusters (n = 89), and for ScpB-YFP 4.9 ± 0.8 molecules are integrated in clusters (n = 91). (B) Boxplot showing numbers of molecules integrated into clusters. There was no statistically significant difference between the numbers of molecules integrated into clusters for Smc-YFP and ScpB-YFP (P = 0.03), but ScpA-YFP showed a statistically significant higher number of molecules integrated into clusters (P < 0.005). Black dots are considered outliers (lie outside of 1.5 ITR).

References

    1. Uhlmann F. SMC complexes: from DNA to chromosomes. Nat. Rev. Mol. Cell Biol. 2016; 17:399–412. - PubMed
    1. Hirano T. Condensin-based chromosome organization from bacteria to vertebrates. Cell. 2016; 164:847–857. - PubMed
    1. Graumann P.L. Chromosome architecture and segregation in prokaryotic cells. J. Mol. Microbiol. Biotechnol. 2014; 24:291–300. - PubMed
    1. Gligoris T., Löwe J.. Structural insights into ring formation of cohesin and related Smc complexes. Trends Cell Biol. 2016; 26:680–693. - PMC - PubMed
    1. Löwe J., Cordell S.C., van den Ent F.. Crystal structure of the SMC head domain: an ABC ATPase with 900 residues antiparallel coiled-coil inserted. J. Mol. Biol. 2001; 306:25–35. - PubMed

Publication types

MeSH terms

LinkOut - more resources