. 2018 Sep 6;174(6):1373-1387.e19.
doi: 10.1016/j.cell.2018.08.039.

A Structured Tumor-Immune Microenvironment in Triple Negative Breast Cancer Revealed by Multiplexed Ion Beam Imaging

Affiliations

A Structured Tumor-Immune Microenvironment in Triple Negative Breast Cancer Revealed by Multiplexed Ion Beam Imaging

Leeat Keren et al. Cell. .

Abstract

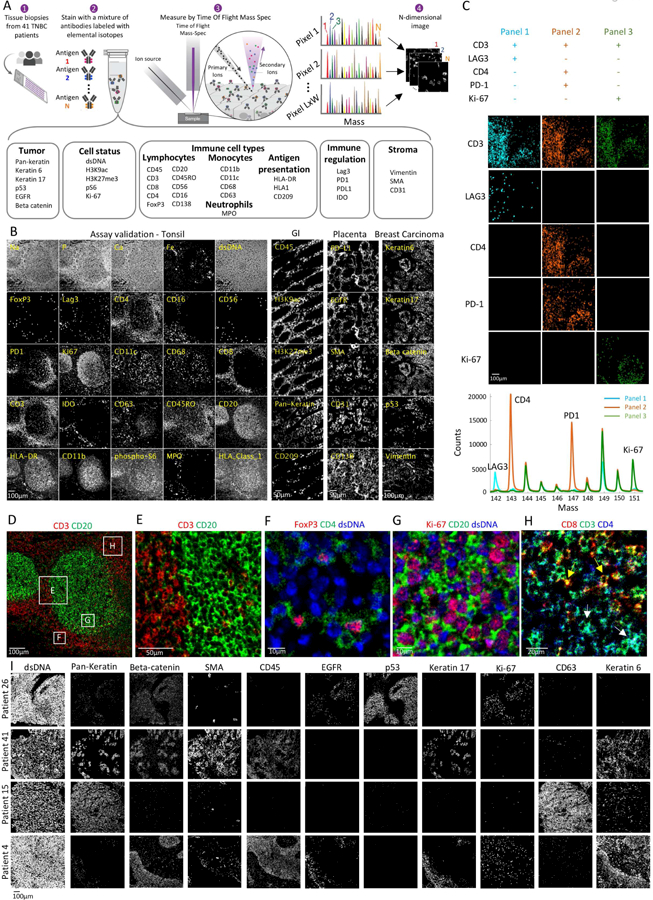
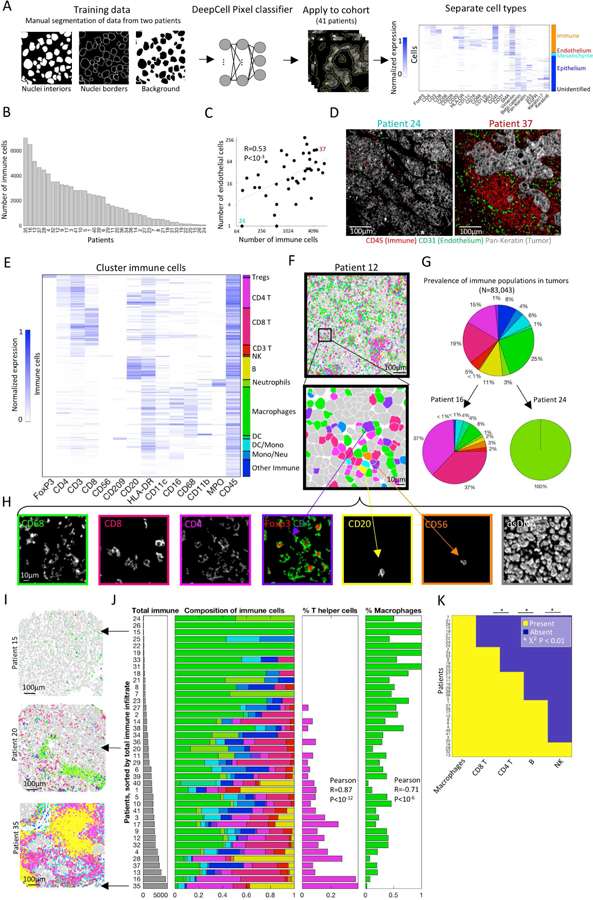
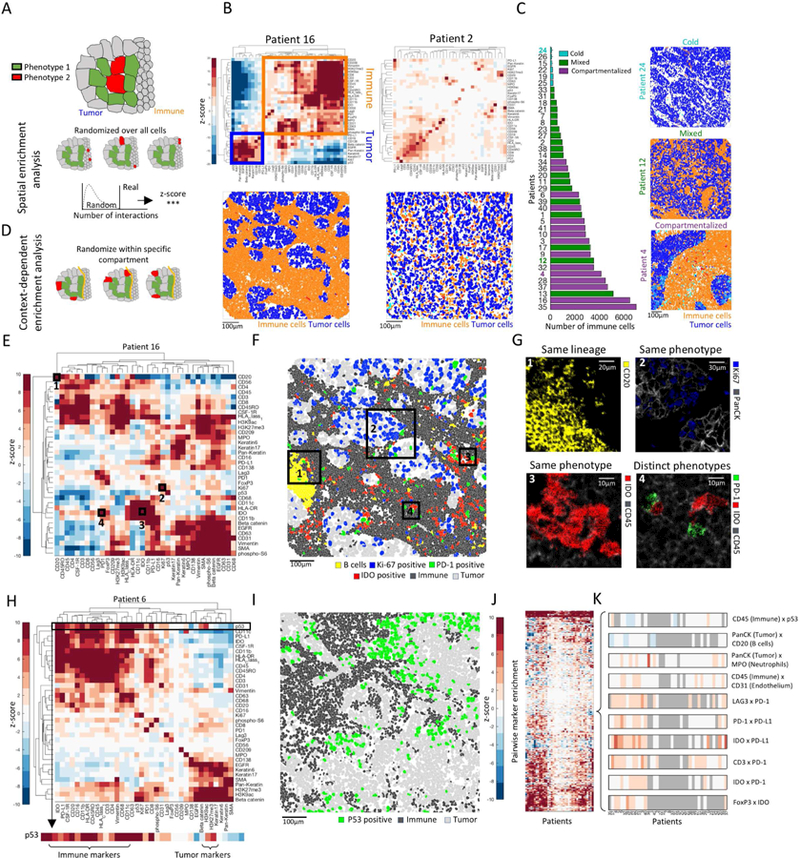
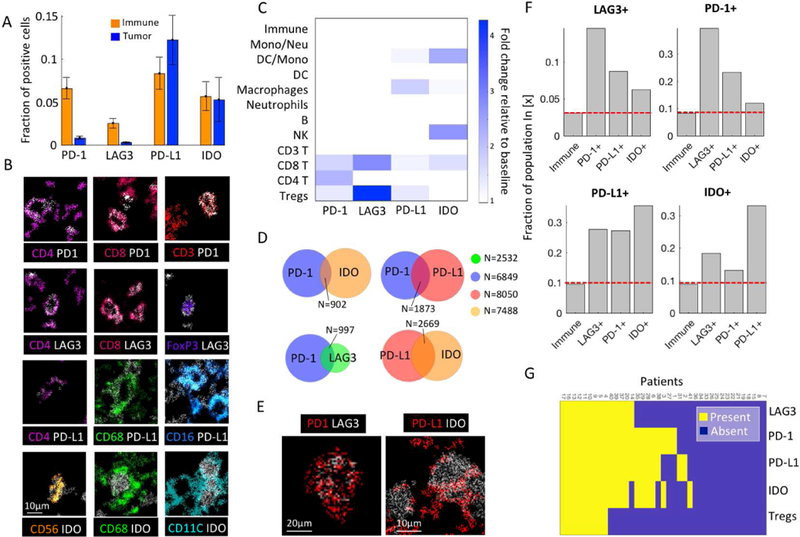
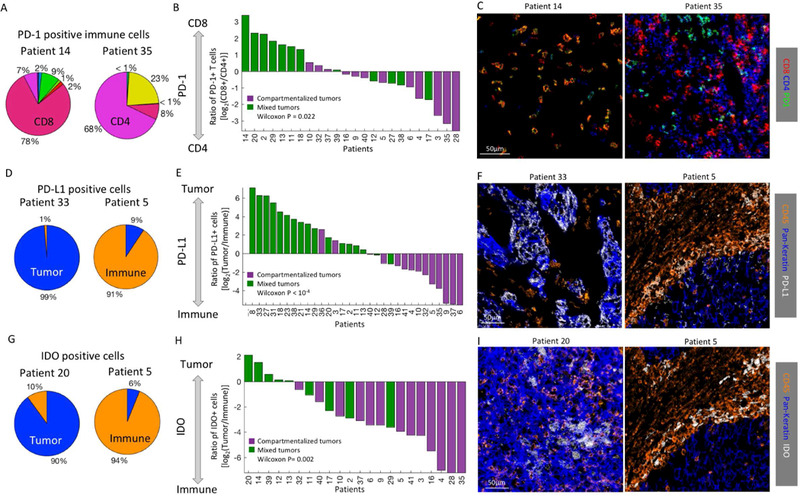
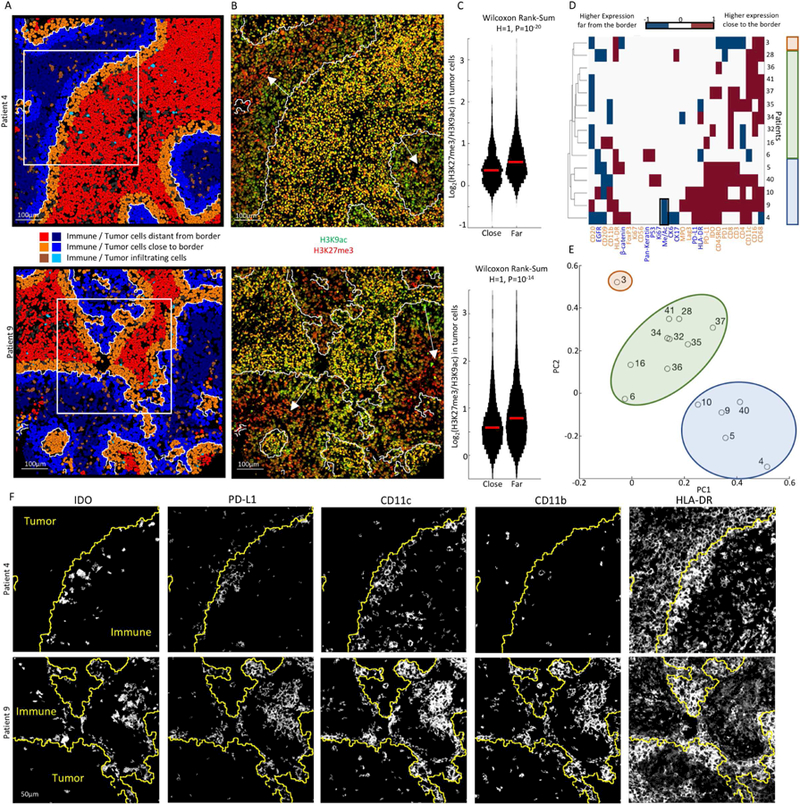
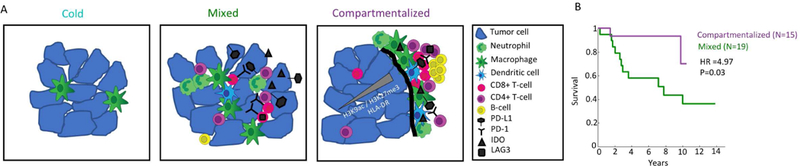
The immune system is critical in modulating cancer progression, but knowledge of immune composition, phenotype, and interactions with tumor is limited. We used multiplexed ion beam imaging by time-of-flight (MIBI-TOF) to simultaneously quantify in situ expression of 36 proteins covering identity, function, and immune regulation at sub-cellular resolution in 41 triple-negative breast cancer patients. Multi-step processing, including deep-learning-based segmentation, revealed variability in the composition of tumor-immune populations across individuals, reconciled by overall immune infiltration and enriched co-occurrence of immune subpopulations and checkpoint expression. Spatial enrichment analysis showed immune mixed and compartmentalized tumors, coinciding with expression of PD1, PD-L1, and IDO in a cell-type- and location-specific manner. Ordered immune structures along the tumor-immune border were associated with compartmentalization and linked to survival. These data demonstrate organization in the tumor-immune microenvironment that is structured in cellular composition, spatial arrangement, and regulatory-protein expression and provide a framework to apply multiplexed imaging to immune oncology.

Keywords: Breast Cancer; Checkpoint; Imaging; MIBI; Mass spectrometry; Multiplexed Ion Beam Imaging; Proteomics; Systems Biology; Tumor Immunology; Tumor Microenvironment.


Figures

Figure 1:
Figure 1:. Development of a multiplexed imaging assay for the tumor-immune microenvironment
(A) Experimental workflow for MIBI-TOF. Clinical tissue specimens are stained using a mixture of antibodies labeled with elemental mass tags. The samples are rasterized by a primary ion beam that releases lanthanide adducts of the bound antibodies as secondary ions, which are recorded by a TOFMS. This results in an n-dimensional image depicting protein expression in the field. (B) MIBI-TOF images of samples stained with the panel in (A). (C) Serial sections of lymph node were stained with three sub-panels, each including 30 out of the 36 antibodies. Bottom: integrated counts across the image as a function of mass for the three panels. (D-H) Assay validation: Color overlays of tonsil show expected patterns of histologic architecture, subcellular staining (membrane/nucleus), and protein co-expression. (I) MIBI-TOF images of four TNBC patients.
Figure 2:
Figure 2:. Automated image analysis pipeline delineates ordered immune composition in TNBC
(A) Analytical pipeline for multiplexed imaging data. Cell segmentation is performed using a pixel-based convolutional neural network. Following segmentation, cellular features are extracted and cells are clustered into distinct populations. (B) The number of immune cells per patient. (C) The number of immune cells is correlated with the number of endothelial cells across patients. (D) Staining for tumor (Pan-Keratin), immune (CD45) and endothelium (CD31) in two patients. (E) Immune cells clustered by protein expression. Expression values for each protein are scaled from zero to one. (F) Pseudo-coloring of patient 12. Immune cells are color-coded as in E. Other cell types are colored gray. (G) Immune composition in all patients, and specific patients, color-coded as in E. (H) Expression of seven markers in the region shown in F. (I) Pseudo-coloring of three patients, color-coded as in E. (J) Left: Patients, sorted by number of immune cells (gray bars). Right: Immune composition normalized from zero to one (x-axis) in all patients (y-axis). Percentage of CD4+ T cells (magenta) increases whereas percentage of macrophages (green) decreases with total immune number. (K) For five immune populations shown is their presence or absence across patients.
Figure 3:
Figure 3:. Spatial analysis reveals a hierarchy of organization of tumor and immune cells
(A) Assessment of enriched proximity/distance between two cell types, red and green. Location of red cells is randomized to generate a null distribution of red-green interactions. The actual number is compared to the distribution to calculate a z-score. (B) Top: Heat maps depicting spatial enrichment z-scores between pairs of proteins. Orange and blue boxes mark immune-and tumor-related proteins, respectively. Bottom: Pseudo coloring of immune and tumor cells. (C) Left: Patients, sorted by the number of immune cells and colored by their spatial architecture. Right: Pseudo coloring of immune and tumor cells in three patients. (D) Context-dependent spatial enrichment (CDSE) analysis controls for hierarchical tissue organization. The location of red cells is randomized only within the tumor compartment. (E) Heatmap of CDSE z-scores between pairs of proteins in patient 16. Squares are highlighted in F and G. (F) Pseudo-coloring of cell populations highlighted in E and G. (G) Protein staining in boxed regions in F. (H) Heatmap of CDSE z-scores between pairs of proteins in patient 6. Zoom-in on p53 shows its proximity to immune cells. (I) Pseudo-coloring of patient 6 showing increased proximity of p53+ tumor cells to immune cells. (J) CDSE z-scores, grouped for all patients. Patients are ordered as in K. (K) Zoom-in on a few interactions in J displaying variability (CD45xp53), depletion (Pan-KeratinxCD20) or enrichment (rest) across patients. Gray denotes patients with less than 10 positive cells for either maker.
Figure 4:
Figure 4:. Enriched co-expression of immunoregulatory proteins by cell types and patients
(A) Fraction of immune and tumor cells expressing immunoregulatory proteins (IRPs). Mean and SE across patients are shown. (B) Color overlays of immune lineage proteins (rainbow) and IRPs (white). (C) For each IRP, shown is the log2 fold change relative to the baseline in representation of the different immune populations. (D) Cellular co-expression of IRPs. (E) Co-expression of IRPs. (F) For each IRP, shown is the fraction of positive cells out of all immune cells, and out of immune cells positive for other IRPs. Left bar is consistently the lowest, indicating increased probability for IRP co-expression. (G) Presence or absence of IRPs and Tregs across patients.
Figure 5:
Figure 5:. Expression patterns of immunoregulatory proteins coincide with TNBC architecture
(A) PD-1+ immune cell composition in two patients. Immune populations are color-coded as in 2E. (B) For all patients with over 20 PD-1+ cells (x-axis) shown is the log ratio of PD-1+CD8+ and PD-1+CD4+ T-cells. Patients are colored by their spatial architectures. Mixed tumors tend to have more PD-1+CD8+ T cells than PD-1+CD4+ T cells, as determined by Wilcoxon rank-sum test. (C) Color overlay of CD8, CD4 and PD-1. (D) PD-L1+ cell composition in two patients. (E) Same as B, showing the log ratio of PD-L1+ tumor and immune cells. (F) Color overlay of CD45 (immune), Pan-keratin (tumor) and PD-L1. (G) IDO+ cell composition in two patients. (H) Same as B, showing the log ratio of IDO+ tumor and immune cells. (I) Color overlay of CD45 (immune), Pan- keratin (tumor) and IDO.
Figure 6:
Figure 6:. The tumor border has complex multicellular structures of immune regulation
(A) Computationally-derived tumor-immune border (white line) in patients 4 and 9. Tumor and immune cells are pseudo-colored by their location relative to the border. Insets are shown in F. (B) Color overlays for H3K9ac and H3K27me3. The tumor-immune border is white. Arrows show a gradient of HH3 acetylation to methylation in tumor cells from the boundary inwards. (C) Distribution of the log-ratio of H3K27me3 to H3K9ac in tumor cells close or far from the tumor- immune border. Median is marked in red. (D) For each protein in either tumor (blue) or immune (orange) cells (x-axis), shown is the H-value from a Wilcoxon rank-sum test evaluating differential expression in cells close or far from the border for compartmentalized patients (y- axis). Patients and proteins are sorted by hierarchical clustering. Colored rectangles show groups identified by clustering and principle component analysis (PCA). Black box highlights results in C. (E) PCA of the data in D. Patients are plotted on the first and second PCs. (F) Staining for different proteins in the boxed regions in A. The tumor-immune boundary is in yellow. Immune cells near the border co-express IDO, PD-L1, CD11c and CD11b. Tumor cells express HLA-DR, with a gradient from the boundary inwards.
Figure 7:
Figure 7:. Tumor-Immune mixing and immune-regulatory expression patterns relate to overall survival
(A) Cartoon depicting three archetypes of tumor-immune composition and organization in TNBC. Cold tumors have few immune cells, mainly macrophages. Mixed tumors have tumor and immune cells mixed together. IDO and PD-L1, if expressed, are expressed primarily on tumor cells and PD-1 on CD8+ T cells. In compartmentalized tumors, the immune and tumor cells are spatially segregated. Neutrophils are enriched near the border, whereas B-cells form secondary lymphoid structures further away. IDO and PD-L1 are expressed primarily on immune cells and PD-1 on CD4+ T cells. A subset of tumors express HLA-DR, with a gradient of HLA-DR and H3K9ac/H3K27me3 from the border towards the tumor center. (B) Kaplan-Meier curves showing survival as a function of time for patients with compartmentalized or mixed tumor- immune organizations. Hazards ratio (HR) and p-value (P) were calculated using Cox regression analysis.

Comment in

References

    1. Andre F, Dieci MV, Dubsky P, Sotiriou C, Curigliano G, Denkert C, and Loi S (2013). Molecular pathways: involvement of immune pathways in the therapeutic response and outcome in breast cancer. Clin. Cancer Res 19, 28–33. - PubMed
    1. Andrews LP, Marciscano AE, Drake CG, and Vignali DAA (2017). LAG3 (CD223) as a cancer immunotherapy target. Immunol. Rev 276, 80–96. - PMC - PubMed
    1. Angelo M, Bendall SC, Finck R, Hale MB, Hitzman C, Borowsky AD, Levenson RM, Lowe JB, Liu SD, Zhao S, et al. (2014). Multiplexed ion beam imaging of human breast tumors. Nat. Med 20, 436–442. - PMC - PubMed
    1. Bagaitkar J (2014). Cellular dynamics of resolving inflammation. Blood 124, 1701–1703. - PMC - PubMed
    1. Bendall SC, Simonds EF, Qiu P, Amir ED, Krutzik PO, Finck R, Bruggner RV, Melamed R, Trejo A, Ornatsky OI, et al. (2011). Single-cell mass cytometry of differential immune and drug responses across a human hematopoietic continuum. Science 332, 687–696. - PMC - PubMed

Publication types

MeSH terms