. 2018 Sep 6;174(6):1571-1585.e11.
doi: 10.1016/j.cell.2018.08.042.

Atlas of Circadian Metabolism Reveals System-wide Coordination and Communication between Clocks

Affiliations

Atlas of Circadian Metabolism Reveals System-wide Coordination and Communication between Clocks

Kenneth A Dyar et al. Cell. .

Abstract

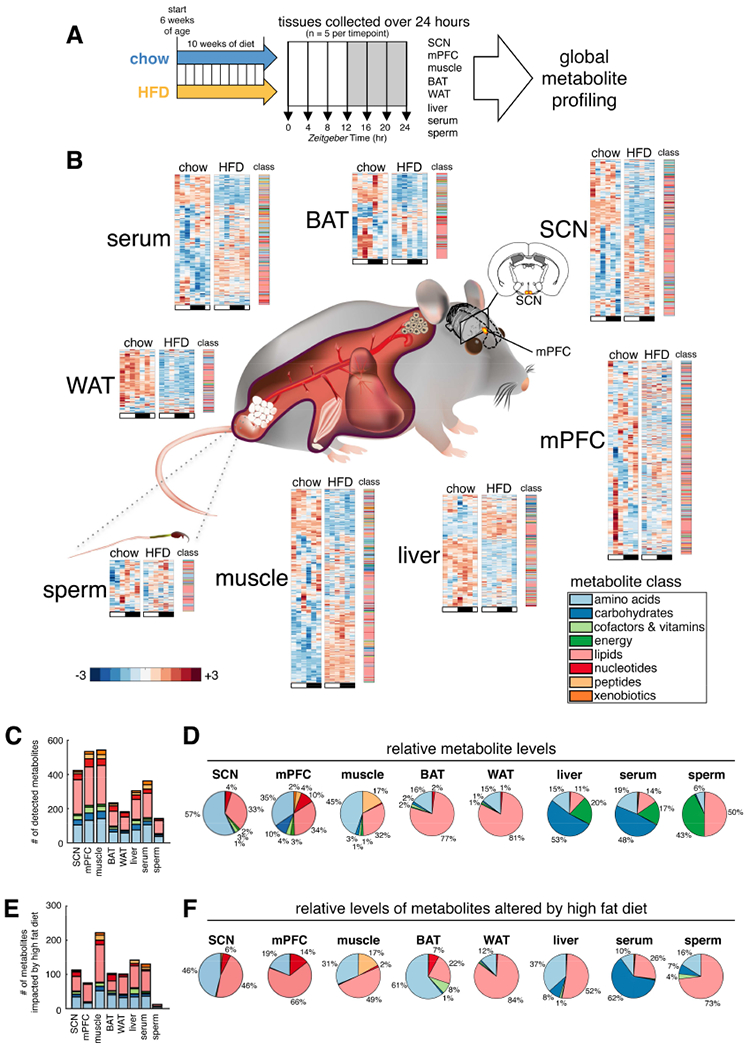
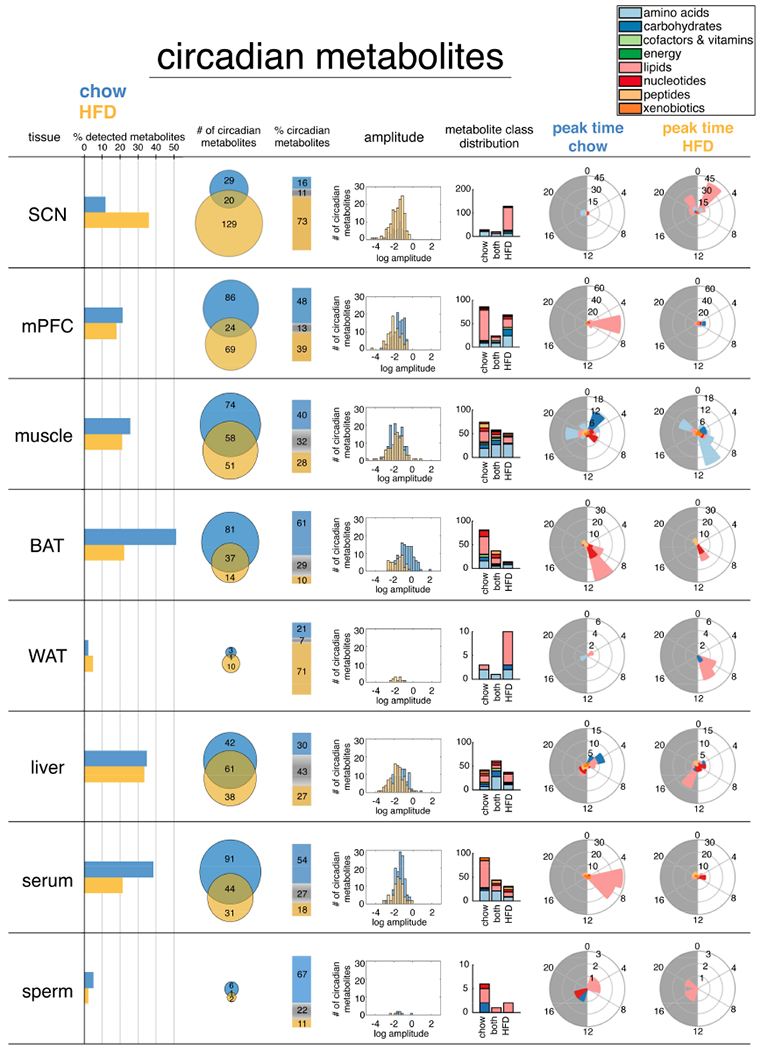
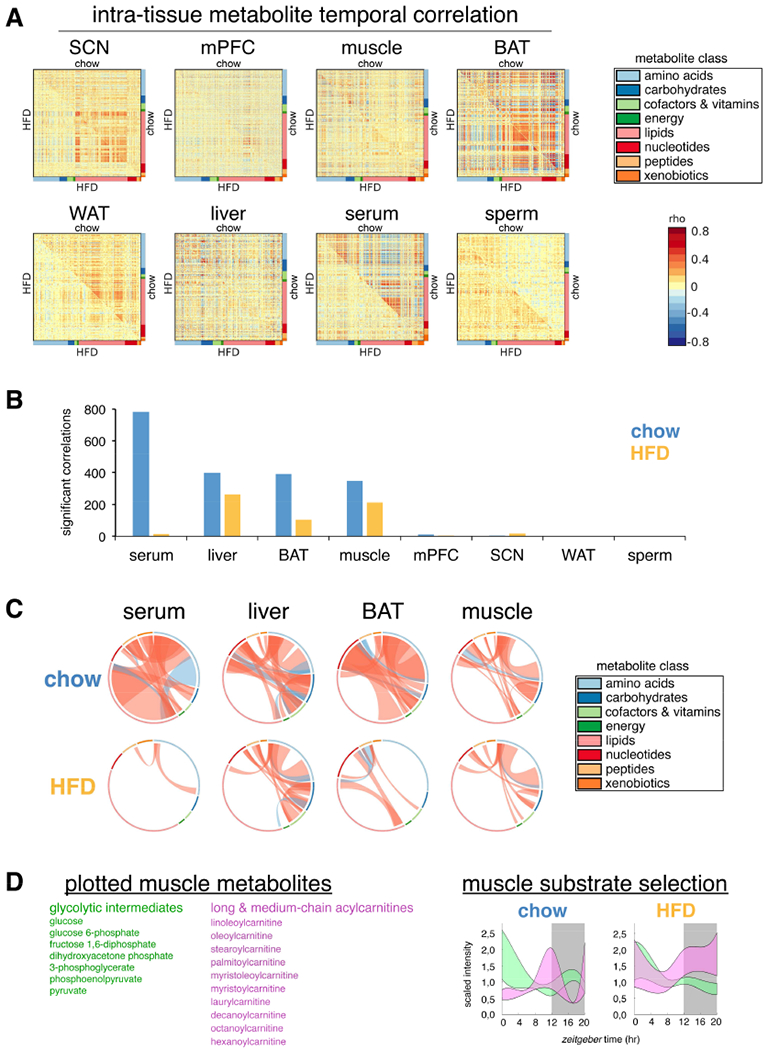
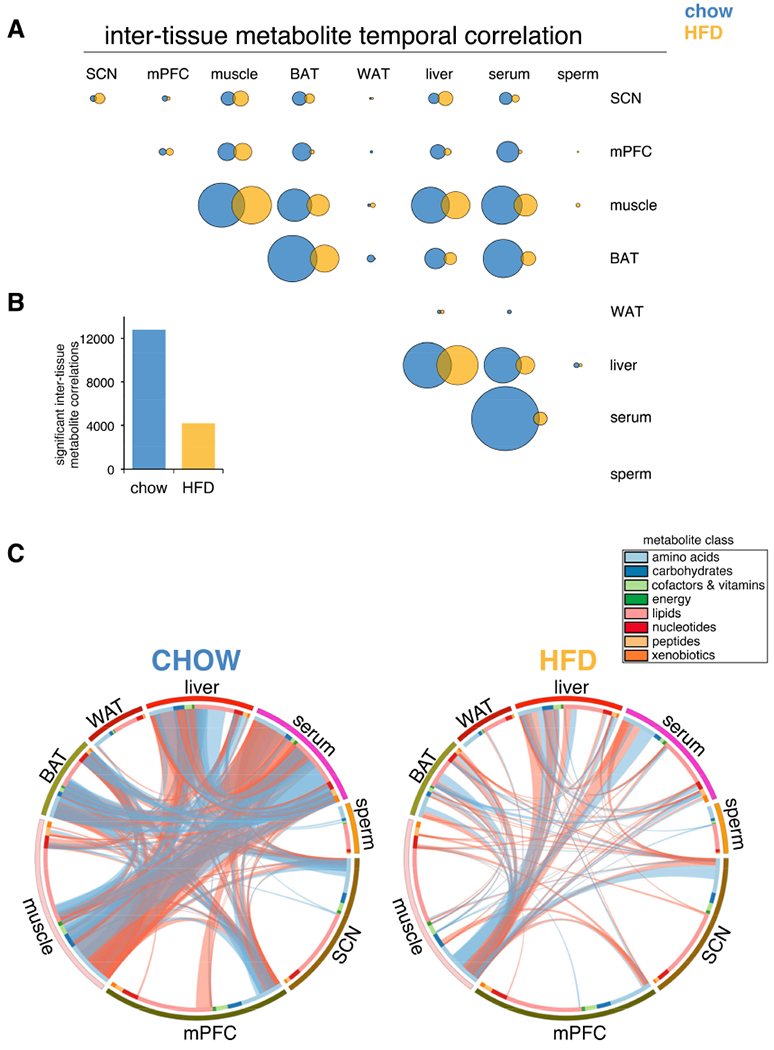
Metabolic diseases are often characterized by circadian misalignment in different tissues, yet how altered coordination and communication among tissue clocks relate to specific pathogenic mechanisms remains largely unknown. Applying an integrated systems biology approach, we performed 24-hr metabolomics profiling of eight mouse tissues simultaneously. We present a temporal and spatial atlas of circadian metabolism in the context of systemic energy balance and under chronic nutrient stress (high-fat diet [HFD]). Comparative analysis reveals how the repertoires of tissue metabolism are linked and gated to specific temporal windows and how this highly specialized communication and coherence among tissue clocks is rewired by nutrient challenge. Overall, we illustrate how dynamic metabolic relationships can be reconstructed across time and space and how integration of circadian metabolomics data from multiple tissues can improve our understanding of health and disease.

Keywords: CircadiOmics; circadian rhythms; clock; high-fat diet; metabolism; metabolomics.


Conflict of interest statement

Declaration of Interest

The authors declare no competing interests

Figures

Figure 1.
Figure 1.. Global metabolite profiling of mouse tissues over 24-hours reveals common and tissue-specific metabolic signatures on chow and HFD.
(A) Experimental design. Suprachiasmatic nucleus (SCN), medial prefrontal cortex (mPFC), gastrocnemius skeletal muscle, interscapular brown adipose tissue (BAT), epididymal white adipose tissue (WAT), liver, serum, and cauda epididymal sperm collected every four hours across the light/dark cycle from a single cohort of C57BL/6J mice. 6 time points were profiled for SCN, mPFC, muscle and sperm; a 7th replicate time point, ZT24, was additionally profiled for serum, liver, BAT and WAT. (B) Tissue-specific metabolite heatmaps. Rows reflect normalized (z-score) metabolite abundance across the light/dark cycle (white bar=ZT0, 4, 8 & 24; black bar=ZT12, 16 & 20). Metabolite class is indicated at the right of each heatmap. (C) Counts and class of detected metabolites for each tissue. (D) Tissue metabolite class composition according to relative metabolite masses (sum of standardized abundances). (E) Counts and class of metabolites significantly impacted by diet (diet effect p<0.05, linear regression model). (F) HFD-altered metabolite class composition for each tissue. (relative metabolite masses affected by HFD).
Figure 2.
Figure 2.. Comparative analysis of circadian metabolites highlights heterogeneity of tissue circadian function.
24-hr oscillating metabolites (p<0.05, JTK_CYCLE) for each tissue are plotted from left to right according to 1) relative % of detected metabolites, 2) absolute numbers 3) % distribution, 4) amplitude of oscillation, 5) class distribution, and 6&7) phase distribution.
Figure 3.
Figure 3.. Tissue-specific metabolite correlations illustrate how temporal coherence and normal gating of metabolic pathways is maintained or altered by HFD.
(A) Correlation heatmaps for metabolites in each tissue. Correlation coefficient rho is shown as red (positive) or blue (negative) as indicated. (B) Number of significant metabolite correlations according to tissue and diet. (C) Graphical visualization of significant metabolite correlations. Each ribbon indicates a significant metabolite correlation (positive=red, negative=blue) between or within each metabolite class. Ribbon thickness refers to number of significantly correlated metabolites. Metabolites were ordered according to metabolite class as indicated in colored bar around the circumference. (D) “Fuzzy plots” show the range (colored area) between minimum and maximum abundance for members of each metabolic pathway. Cubic-splines interpolation estimated continuous abundance.
Figure 4.
Figure 4.. Loss of inter-tissue metabolite correlations on HFD.
(A) Correlated metabolites between each tissue. Circle areas sized according to number of significant metabolite correlations. (B) Significant inter-tissue metabolite correlations. (C) Graphical summary of all inter-tissue metabolite temporal correlations. Each ribbon indicates a significant intertissue metabolite correlation (positive=red, negative=blue). Ribbon thickness refers to number of significantly correlated metabolites.
Figure 5.
Figure 5.. Serum, liver, muscle and BAT cross-tissue metabolite correlations severely altered by HFD.
Networks of significantly correlated metabolites detected on chow or HFD. Each node refers to a single metabolite. Node shape indicates tissue or tissues showing correlation. Node color refers to metabolite class. Edges are drawn for each significant inter-tissue correlation, and edge colors refer to the sign of correlation coefficient (red=positive, blue=negative).
Figure 6.
Figure 6.. Increased circadian oscillation of muscle and serum metabolites linked to increased liver precursors for gluco- and glyceroneogenesis.
(A-E) Diurnal variations of selected metabolites in mouse tissues on chow or HFD (mean±SEM; n=5×group×time point). (F) Simplified scheme showing interrelationships between HFD-induced metabolite alterations detected muscle, serum, and liver. Red text indicates metabolites significantly increased by HFD.
Figure 7.
Figure 7.. Loss of circadian lipid oscillation in BAT linked to reduced purine catabolism, de novo oscillation of purine nucleotides, and impaired UCP1 activation.
(A) Representative diurnal variations of substrates from the inter-organ triglyceride/fatty acid cycle in relevant tissues (mean±SEM; n=5×group×time point). “Fuzzy plots” of all detected medium and long-chain nonesterified fatty acids (NEFAs), indicate the range (colored area) between minimum and maximum abundance for all medium and long-chained NEFAs. (B&C) Diurnal variations of BAT purine nucleotides and nucleosides (mean±SEM; n=5 × group × time point). GMP reductase (GMPr), converts GMP to IMP. (D) Scheme showing how metabolites of BAT purine catabolism are interrelated and altered on HFD. Metabolites significantly increased by HFD are indicated by red text, while significantly reduced metabolites are blue. Black metabolites are unchanged, and grey metabolites were not measured. Enzymes are shown as pink boxes, and are all coded by circadian genes in BAT. (E) Diurnal variations of NAD+ metabolites (mean±SEM; n=5×group×time point). Nampt and Sirt3 are coded by circadian genes in BAT. (F) Diurnal variations of selected purine catabolism metabolites in BAT (mean±SEM; n=5×group×time point). (G) Respiration driving proton leak measured in isolated mitochondria from control HEK293 cells (empty, left panel) or HEK293 cells ectopically expressing mouse UCP1 (middle panel) in the presence of selected purine nucleotides. Note that the upward shift in leak kinetics in the presence of UCP1 is prevented to a similar extent by GDP and GMP addition. Right panel shows data plotted at the highest common membrane potential.

Similar articles

Cited by

References

    1. Abbondante S, Eckel-Mahan KL, Ceglia NJ, Baldi P, and Sassone-Corsi P (2016). Comparative Circadian Metabolomics Reveal Differential Effects of Nutritional Challenge in the Serum and Liver. J Biol Chem 291, 2812–2828. - PMC - PubMed
    1. Adams SH (2011). Emerging perspectives on essential amino acid metabolism in obesity and the insulin-resistant state. Adv Nutr 2, 445–456. - PMC - PubMed
    1. Adibi SA (1968). Influence of dietary deprivations on plasma concentration of free amino acids of man. J Appl Physiol 25, 52–57. - PubMed
    1. Agostinelli F, Ceglia N, Shahbaba B, Sassone-Corsi P, and Baldi P (2016). What time is it? Deep learning approaches for circadian rhythms. Bioinformatics 32, i8–i17. - PMC - PubMed
    1. Aguilar-Arnal L, Ranjit S, Stringari C, Orozco-Solis R, Gratton E, and Sassone-Corsi P (2016). Spatial dynamics of SIRT1 and the subnuclear distribution of NADH species. Proc Natl Acad Sci U S A. - PMC - PubMed

Publication types