. 2018 Nov 1;372(1):25-34.
doi: 10.1016/j.yexcr.2018.09.005. Epub 2018 Sep 5.

Matrix mineralization controls gene expression in osteoblastic cells

Affiliations

Matrix mineralization controls gene expression in osteoblastic cells

Johannes Wischmann et al. Exp Cell Res. .

Abstract

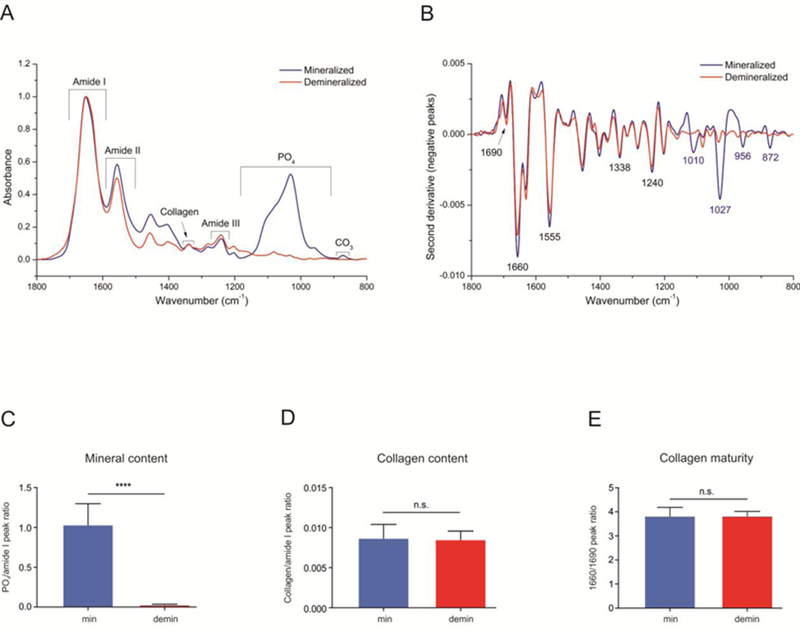
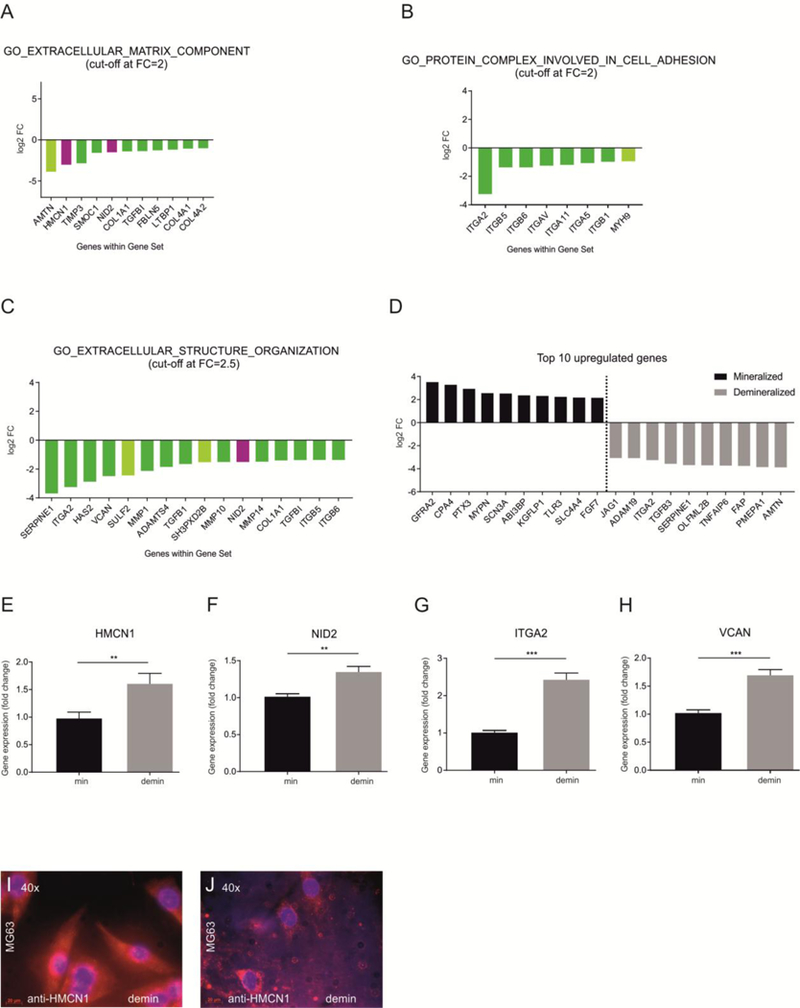
Osteoblasts are adherent cells, and under physiological conditions they attach to both mineralized and non-mineralized osseous surfaces. However, how exactly osteoblasts respond to these different osseous surfaces is largely unknown. Our hypothesis was that the state of matrix mineralization provides a functional signal to osteoblasts. To assess the osteoblast response to mineralized compared to demineralized osseous surfaces, we developed and validated a novel tissue surface model. We demonstrated that with the exception of the absence of mineral, the mineralized and demineralized surfaces were similar in molecular composition as determined, for example, by collagen content and maturity. Subsequently, we used the human osteoblastic cell line MG63 in combination with genome-wide gene set enrichment analysis (GSEA) to record and compare the gene expression signatures on mineralized and demineralized surfaces. Assessment of the 5 most significant gene sets showed on mineralized surfaces an enrichment exclusively of genes sets linked to protein synthesis, while on the demineralized surfaces 3 of the 5 enriched gene sets were associated with the matrix. Focusing on these three gene sets, we observed not only the expected structural components of the bone matrix, but also gene products, such as HMCN1 or NID2, that are likely to act as temporal migration guides. Together, these findings suggest that in osteoblasts mineralized and demineralized osseous surfaces favor intracellular protein production and matrix formation, respectively. Further, they demonstrate that the mineralization state of bone independently controls gene expression in osteoblastic cells.

Keywords: Bone; Bone matrix; Bone mineral; Gene Regulation; Osteoblast.


Figures

Figure 1:
Figure 1:. The surface model mimics mineralized and demineralized endogenous bone.
(A) Photographs of mineralized and demineralized bone surfaces prepared for subsequent cell seeding. (B) Planar X-ray images of mineralized (top row) and demineralized (bottom row) bone surfaces. (C) DXA measure of BMD. Means and standard deviation are shown. Significance was denoted as ****p<0.0001. Abbreviations: demin, demineralized; min, mineralized.
Figure 2:
Figure 2:. The mineralized and demineralized surfaces differ only in their mineralization state.
(A) Raw FTIR spectra show comparable peaks for amide I, II, and III (arising from total protein), and for collagen in both surfaces, while PO4 and CO3 peaks were only observed in the mineralized surface. (B) Second derivative spectra show more details of subtle and overlapping peaks, confirming the absence of mineral in the demineralized surface. (C) Relative mineral content (PO4/amide I peak ratio) was significantly reduced in the demineralized surfaces. (D) Relative collagen content (collagen/amide I peak ratio) and (E) collagen maturity (1660/1690 peak ratio) were the same in mineralized and demineralized surfaces (n.s., not significant, ***p< 0.001). Abbreviations: demin, demineralized; min, mineralized.
Figure 3:
Figure 3:. Normal gross attachment of osteoblastic cells on the mineralized and demineralized surfaces.
(A-D) MG63 cells marked with DiD (red channel) on mineralized (left images) and demineralized (right images) bone surfaces forty-eight hours post seeding at a density of 200,000 cells/cm2. Cells show normal morphology and uniform cell attachment. Imaging was performed on live cells (E and F). Co-staining of MG63 cells with phalloidin (red channel) and DAPI (blue channel). Images taken on fixed cells. The white star marks an artifact from the bone tissue. (G and H) Osseous surfaces after mechanical cell-removal, illustrating almost complete cell removal. The image depicts the same ROI as shown in A and B prior to cell removal. Imaging was performed on live cells. Abbreviations: demin, demineralized; min, mineralized.
Figure 4:
Figure 4:. The matrix mineralization state independently regulates osteoblastic gene expression.
(A) Enriched Gene Sets on mineralized (blue) and demineralized (red) bone surfaces. (B and C) Distribution of statistical significance within enriched gene sets on mineralized (B) and demineralized (C) bone surfaces, considering p-value and falsediscovery-rate (FDR). (D and E) Plotted top five enriched gene sets on mineralized (D) and demineralized (E) bone surfaces with displayed NES and GSEA Enrichment Plot of gene set with highest achieved NES. Osteoblastic cells on mineralized surfaces exclusively enriched genes sets linked to protein synthesis. In contrast, on the demineralized surfaces three of the five enriched gene sets were associated with the matrix. Gene sets marked with a yellow boarder were associated with the extracellular matrix and further investigated.
Figure 5:
Figure 5:. Identification of HMCN1 and NID2.
(A-C) Detailed plots of examined gene sets and comprising genes enriched on demineralized bone surfaces. Genes within shown gene sets are ranked by measured log2 FC and defined cut-off. Differentially expressed genes are color-marked, depicting a well-established (dark green), a less-reported (light green) and a currently not known (purple) function in osteoblasts. (D) Top 10 upregulated genes on mineralized and demineralized bone surfaces. (E-H) QRTPCR results with measured foldchanges of relative gene expression between mineralized and demineralized bone surfaces. Relative gene expression of mineralized bone surfaces was set to one, serving as reference. Means with standard deviation are shown. Significance was denoted as **p<0.01 and ***p< 0.001. (G and H) Immunofluorescence staining for HMCN1 (red channel) on MG63 cells seeded onto demineralized bone surface. Cell nuclei were co-stained with DAPI (blue channel). Abbreviations: demin, demineralized; min, mineralized.
Figure 6:
Figure 6:. Cross-validation of HMCN1 and NID2 expression in different transformed and primary osteoblasts.
(A-D) QRTPCR results with measured fold-changes of relative gene expression between mineralized and demineralized bone surfaces. Relative gene expression of mineralized bone surfaces was set to 1, serving as reference. Means with standard deviation are shown. Significance was denoted as *p<0.05, **p<0.01, ***p<0.001, ****p<0.0001. Abbreviations: demin, demineralized; min, mineralized; n.s., not significant.

References

    1. Long F, Building strong bones: molecular regulation of the osteoblast lineage, Nat Rev Mol Cell Biol 13 (2011) 27–38. - PubMed
    1. Matic I, Matthews BG, Wang X, Dyment NA, Worthley DL, Rowe DW, Grcevic D, Kalajzic I, Quiescent Bone Lining Cells Are a Major Source of Osteoblasts During Adulthood, Stem Cells 34 (2016) 2930–2942. - PMC - PubMed
    1. Safadi FF, Barbe MF, Abdelmagid SM, Rico MC, Aswad RA, Litvin J, Popoff SN, Bone Structure, Development and Bone Biology, in: Khurana JS (Ed.), Bone Pathology, Humana Press, 2009.
    1. Boyan BD, Schwartz Z, Boskey AL, The importance of mineral in bone and mineral research, Bone 27 (2000) 341–342. - PubMed
    1. Boskey AL, Biomineralization: an overview, Connect Tissue Res 44 Suppl 1 (2003) 5–9. - PubMed

Publication types

MeSH terms