. 2018 Sep 18;49(3):464-476.e4.
doi: 10.1016/j.immuni.2018.08.010. Epub 2018 Sep 4.

CD56 Expression Marks Human Group 2 Innate Lymphoid Cell Divergence from a Shared NK Cell and Group 3 Innate Lymphoid Cell Developmental Pathway

Affiliations

CD56 Expression Marks Human Group 2 Innate Lymphoid Cell Divergence from a Shared NK Cell and Group 3 Innate Lymphoid Cell Developmental Pathway

Luxi Chen et al. Immunity. .

Abstract

According to the established model of murine innate lymphoid cell (ILC) development, helper ILCs develop separately from natural killer (NK) cells. However, it is unclear how helper ILCs and NK cells develop in humans. Here we elucidated key steps of NK cell, ILC2, and ILC3 development within human tonsils using ex vivo molecular and functional profiling and lineage differentiation assays. We demonstrated that while tonsillar NK cells, ILC2s, and ILC3s originated from a common CD34-CD117+ ILC precursor pool, final steps of ILC2 development deviated independently and became mutually exclusive from those of NK cells and ILC3s, whose developmental pathways overlapped. Moreover, we identified a CD34-CD117+ ILC precursor population that expressed CD56 and gave rise to NK cells and ILC3s but not to ILC2s. These data support a model of human ILC development distinct from the mouse, whereby human NK cells and ILC3s share a common developmental pathway separate from ILC2s.

Keywords: Human innate lymphoid cells; ILC development; natural killer cells.


Conflict of interest statement

COMPETING FINANCIAL INTERESTS

The authors declare no competing financial interests.

Figures
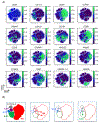
Figure 1.
Figure 1.
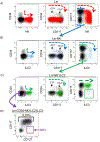
Putative ILC developmental pathways exist in human tonsils. (A) Representative viSNE cluster plots showing cell localizations and expression patterns of ILC associated markers among freshly enriched human tonsil lymphoid cells. The relative expression of each antigen in the plots spans from low (purple) to intermediate (blue) to high (green). Following the exclusion of Lin+ cells (Lin = CD3, CD4, CD5, CD14, CD19, and CD20) and inclusion of live CD45+ cells via biaxial gating, 25 separate markers were configured into 2 dimensions, t-SNE1 and t-SNE2. (B) Cluster designations (left plot) based on the data in (A) suggested putative pathways of NK cell, ILC2, and ILC3 development stemming from CD34+ progenitor cells in the human tonsils. Curved red, blue, and green dashed arrows represent NK cell, ILC2, and ILC3 developmental pathways, respectively. ETP = Early Tonsil Progenitor. CILP = Common ILC Progenitor. ILCP = ILC Precursor. The data shown are representative of n = 3 fresh human tonsils from three independent experiments. See also Table S1 and Figure S1.
Figure 2.
Figure 2.
Human tonsil ILC subsets emerge directly from CD34CD117+ ILCPs. Representative flow cytometry analyses of freshly enriched human tonsil ILCs after exclusion of lineage antigens (CD3, CD4, CD5, CD14, CD19, CD20, CD123, and FcxεR1α), henceforth referred to as Lin. (A) Depiction of the human NK cell developmental pathway, in which the “NK” axis label = CD16, CD94, NKG2A, NKG2C, NKp80, KIR2D, and KIR3DL1-2. Antibodies targeting all seven NK cell markers were evaluated together in the same channel by flow cytometry. NK cells were painted red in the plots, which were gated on Lin lymphocytes. (B) Depiction of the putative human ILC2 developmental pathway, in which the “ILC2” axis label = CD294 and KLRG1. Antibodies targeting both ILC2 markers were evaluated together in the same channel by flow cytometry. ILC2s were painted blue in the plots, which were gated on Lin NK lymphocytes. (C) Depiction of the putative human ILC3 developmental pathway, in which the “ILC3” axis label = NKp44. ILC3s were painted green in the plots, which were gated on Lin NKILC2 lymphocytes. CD117 ILC3s are located within the green box in the right plot. (D) Depiction of CD127 expression by LinCD34NKILC2ILC3CD117+ ILCPs. The location of where LinCD34NKILC2ILC3CD117CD127+ ILC1s would fall in the plot is designated by the purple box, purple arrow, and “ILC1” label. (A-C) Dashed red, blue, and green arrows represent the putative NK cell, ILC2, and ILC3 developmental pathways, respectively. CD34+CD117 ETPs and CD34+CD117+ CILPs are designated by the black arrows and black labels. The data shown are representative of n = 10 fresh human tonsils from four independent experiments.
Figure 3.
Figure 3.
The ILC2 pathway is mutually exclusive from those of NK cells and ILC3s, which overlap and emerge from a CD56+ ILCP subset. (A) Representative 3D flow cytometry dot plots depicting the mutual exclusivity of CD34+ cells from ILCs, the mutual exclusivity of ILC2s from NK cells and ILC3s, and the overlapping pattern of NK cells and ILC3s. (B) Similar findings as in (A) are depicted in 2D plots gated on either LinCD34+CD117+ cells (top row) or LinCD34CD117+ cells (bottom row). (C) The left plot depicts a representative flow cytometric analysis of tonsillar LinCD34 cells showing two CD117+ subsets according to CD56 expression. The six dot plots to the right show representative flow cytometry analyses of LinCD34 CD117+CD56 cells (top row) and LinCD34CD117+CD56 (bottom row) from fresh tonsils. ILC2s are detected among the LinCD34CD117+CD56 fraction but not among the LinCD34CD117+CD56+ fraction. The data in (A-C) are representative of n = 10 fresh human tonsils from four independent experiments.
Figure 4.
Figure 4.
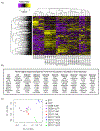
Genome wide transcriptomic analyses reveal key differences among tonsil-derived ILC developmental intermediates. (A) Heatmap depicting the clustering of 431 differentially expressed genes among the ten indicated tonsil-derived populations as detected by RNA-seq. The relative expression of each gene is color coded with a scale based on z-score distribution from −4 (purple) to 4 (yellow). (B) Top ten expressed genes among the 431 total genes that differentiate the ten tonsil-derived populations. (C) PCA of the ten populations based on the average expression of the variable genes. Each population was sorted from n = 3 tonsils from one experiment. See also Figure S2 and Table S2.
Figure 5.
Figure 5.
CD56 and CD56+ subsets of CD34CD117+ ILCPs have similar ex vivo profiles and are distinct from CD34+CD117+ CILPs and CD117+/− ILCs. (A-C) Comparisons of the average percentages of IFN-γ+ (A), IL-13+ (B), and IL-22+ cells (C) produced by CD117+ (black bars) vs CD117 (gray bars) subsets of NK cells, ILC2s, and ILC3s, respectively (n = 6 from 3 independent experiments). Intracellular production of the aforementioned cytokines was measured via flow cytometry analysis following stimulation with either ILC-specific cytokines (NK: IL-12, IL-15, and IL-18; ILC2: IL-2, IL-25, and IL-33; ILC3: IL-2, IL-1β, and IL-23) for 24 hours or with P-I-2 for 6 hours. (D) Representative ex vivo flow cytometric analyses of the ten indicated tonsil-derived populations (n = 6 from 3 independent experiments for each of the indicated markers). Histogram data were generated by gating on Lin ILC populations as defined in Table S2. Isotype control staining of total Lin cells is shown at the top of each row. Black dashed rectangles highlight surface marker and TF expression of CD56 and CD56+ ILCPs. Error bars in A-C indicate SEM. *p < 0.05, **p < 0.01,****p < 0.0001, ns = not significant. See also Figure S3 and Tables S2 and S4.
Figure 6.
Figure 6.
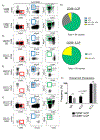
CD34CD117+CD56+ ILCPs can produce NK cells and ILC3s but not ILC2s. (A, D, E, F). Representative surface flow cytometry analyses of ILCs generated in vitro following a 28-day culture of the indicated freshly purified tonsil-derived populations (see labels in left column) with OP9-DL1 feeder cells and recombinant human IL-7 and FL. Dot plots were gated on total viable LinCD45+ lymphocytes, in which Lin = CD3, CD5, and CD14. NK cells were defined as LinCD45+CD94+CD294NKp44+/− cells (red boxes); ILC2s were defined as LinCD45+CD94CD294+NKp44 cells (blue boxes); and ILC3s were defined as LinCD45+CD94CD294NKp44+ cells (green boxes). Data shown are representative of n = 20 tonsils from ten independent experiments. (B) Clonal analysis of freshly purified tonsil-derived CD56 and CD56+ ILCPs individually sorted into wells containing OP9-DL1 feeder cells supplemented with recombinant IL-2 (first two weeks only), SCF (first two weeks only), IL-7, and FL for 28 days. Clones were analyzed for NK cells, ILC2s, and ILC3s (n = 4 tonsil donors, two independent experiments; 94 CD56 clones and 83 CD56+ clones were analyzed using this panel). Cloning efficiency was 18% for CD56 clones and 15.5% for CD56+ clones. (C) Average percent frequency of ILCs produced from CD56 ILCPs (black bars) versus CD56+ ILCPs (gray bars). Error bars indicate SEM. ***p < 0.001, ****p < 0.0001, ns = not significant. See also Figures S2 and S4-S7.
Figure 7.
Figure 7.
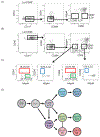
CD34+CD117+ CILPs and CD34CD117+CD56 ILCPs can differentiate into CD34 CD117+CD56+ ILCPs. (A-B) Representative surface flow cytometry analyses of cells derived from 7-day in vitro cultures of fresh tonsil-derived CILPs (A) or CD56 ILCPs (B) with OP9-DL1 feeder cells and recombinant human IL-7 and FL. Dot plots were gated on total viable LinCD45+ lymphocytes, in which Lin = CD3, CD4, CD5, CD14, CD19, CD20, CD123, and FcεR1α (n = 6 tonsils, three independent experiments). (C) Representative surface flow cytometry analyses of ILCs generated following purification of day 7 in vitro-derived CD56 and CD56+ ILCPs (as shown in B) that were re-sorted and then cultured again for an additional 21 days with OP9-DL1 stroma, IL-7, and FL (n = 6 tonsils, three independent experiments). NK cells were defined as LinCD45+CD94+CD294NKp44+/− cells (red boxes); ILC2s were defined as LinCD45+CD94 CD294+NKp44 cells (blue boxes); and ILC3s were defined as LinCD45+CD94CD294NKp44+ cells (green boxes). (D) Model of human ILC development in tonsils. Solid black lines represent developmental transitions between the indicated cells supported by ex vivo immunophenotypic and molecular data as well as lineage differentiation assays. The thin dashed black line represents transdifferentiation between CD117+ NK cells and CD117+ ILC3s.

Similar articles

Cited by

References

    1. Amir el AD, Davis KL, Tadmor MD, Simonds EF, Levine JH, Bendall SC, Shenfeld DK, Krishnaswamy S, Nolan GP, and Pe’er D (2013). viSNE enables visualization of high dimensional single-cell data and reveals phenotypic heterogeneity of leukemia. Nat. Biotechnol. 31, 545–552. - PMC - PubMed
    1. Artis D, and Spits H (2015). The biology of innate lymphoid cells. Nature 517, 293–301. - PubMed
    1. Behbehani GK, Samusik N, Bjornson ZB, Fantl WJ, Medeiros BC, and Nolan GP. (2015). Mass Cytometric Functional Profiling of Acute Myeloid Leukemia Defines Cell-Cycle and Immunophenotypic Properties That Correlate with Known Responses to Therapy. Cancer Discov. 5, 988–1003. - PMC - PubMed
    1. Bendall SC, Simonds EF, Qiu P, Amir el AD, Krutzik PO, Finck R, Bruggner RV, Melamed R, Trejo A, Ornatsky OI, et al. (2011). Single-cell mass cytometry of differential immune and drug responses across a human hematopoietic continuum. Science 332, 687–696. - PMC - PubMed
    1. Bernink JH, Krabbendam L, Germar K, de Jong E, Gronke K, Kofoed-Nielsen M, Munneke JM, Hazenberg MD, Villaudy J, Buskens CJ, et al. (2015). Interleukin-12 and -23 Control Plasticity of CD127(+) Group 1 and Group 3 Innate Lymphoid Cells in the Intestinal Lamina Propria. Immunity 43, 146–160. - PubMed

Publication types