. 2018 Sep 18;49(3):545-559.e5.
doi: 10.1016/j.immuni.2018.08.004. Epub 2018 Sep 4.

Antibodies Set Boundaries Limiting Microbial Metabolite Penetration and the Resultant Mammalian Host Response

Affiliations

Antibodies Set Boundaries Limiting Microbial Metabolite Penetration and the Resultant Mammalian Host Response

Yasuhiro Uchimura et al. Immunity. .

Abstract

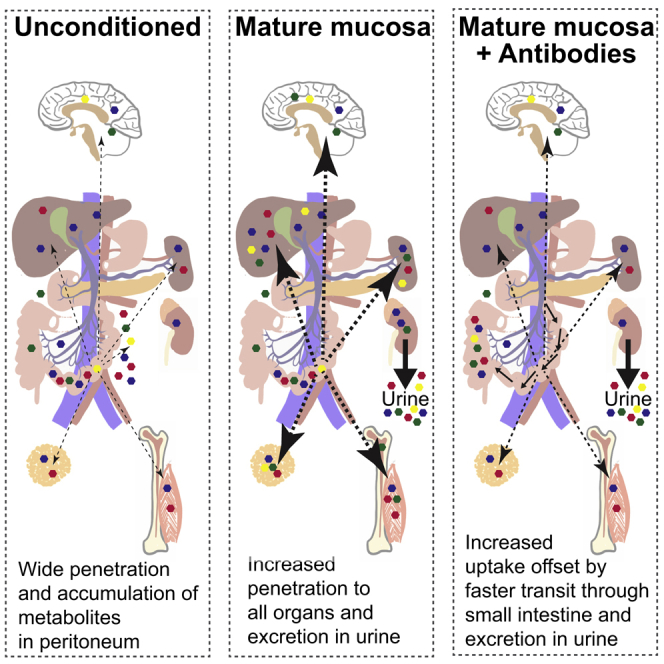
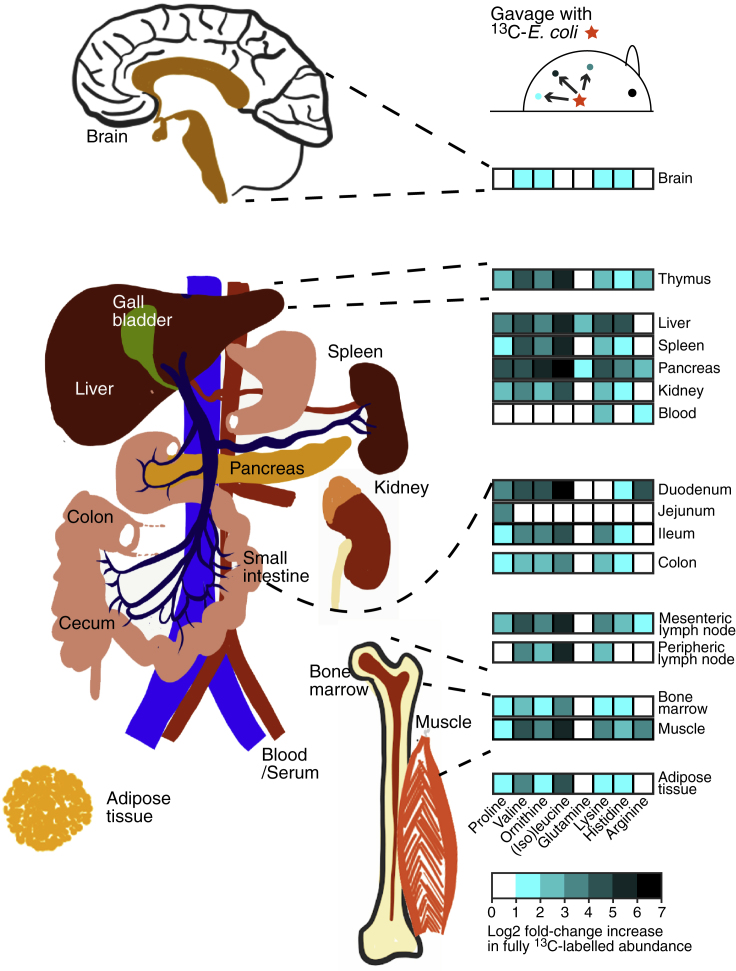
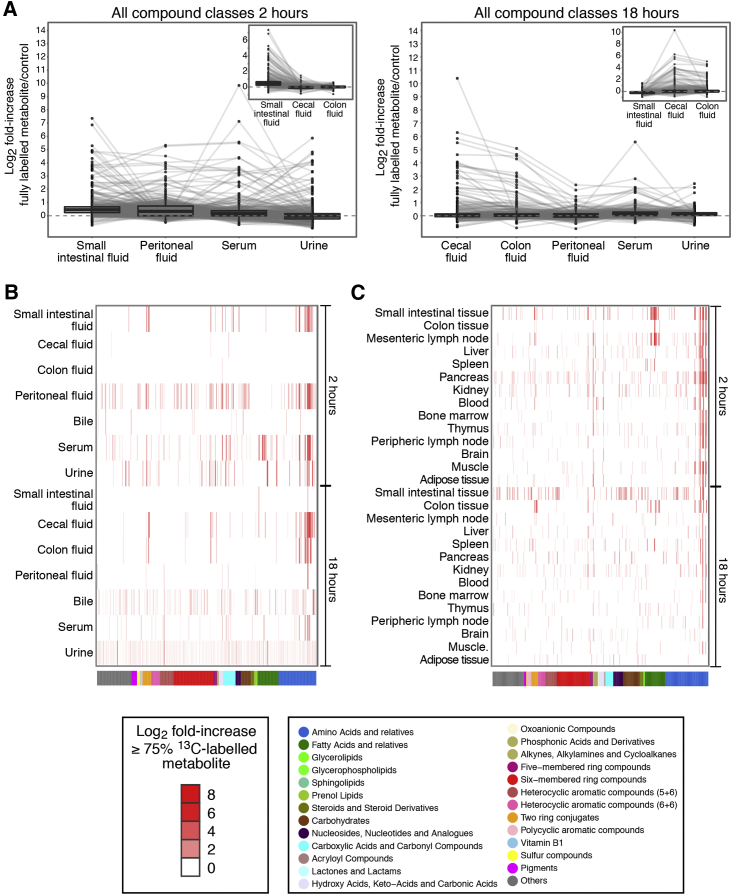
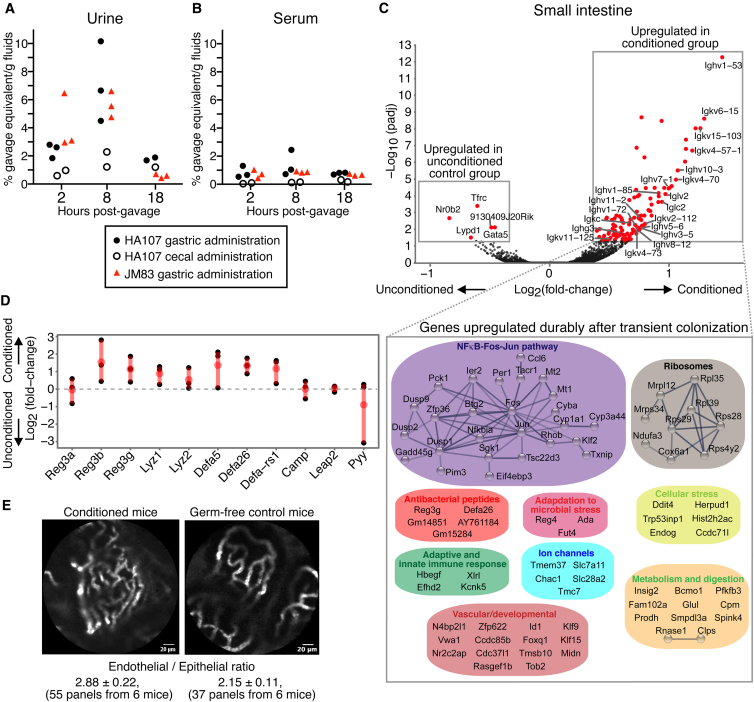
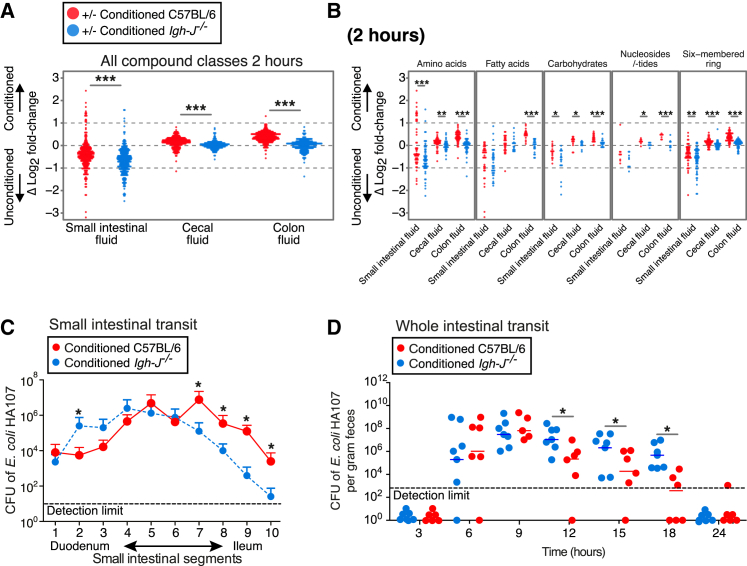
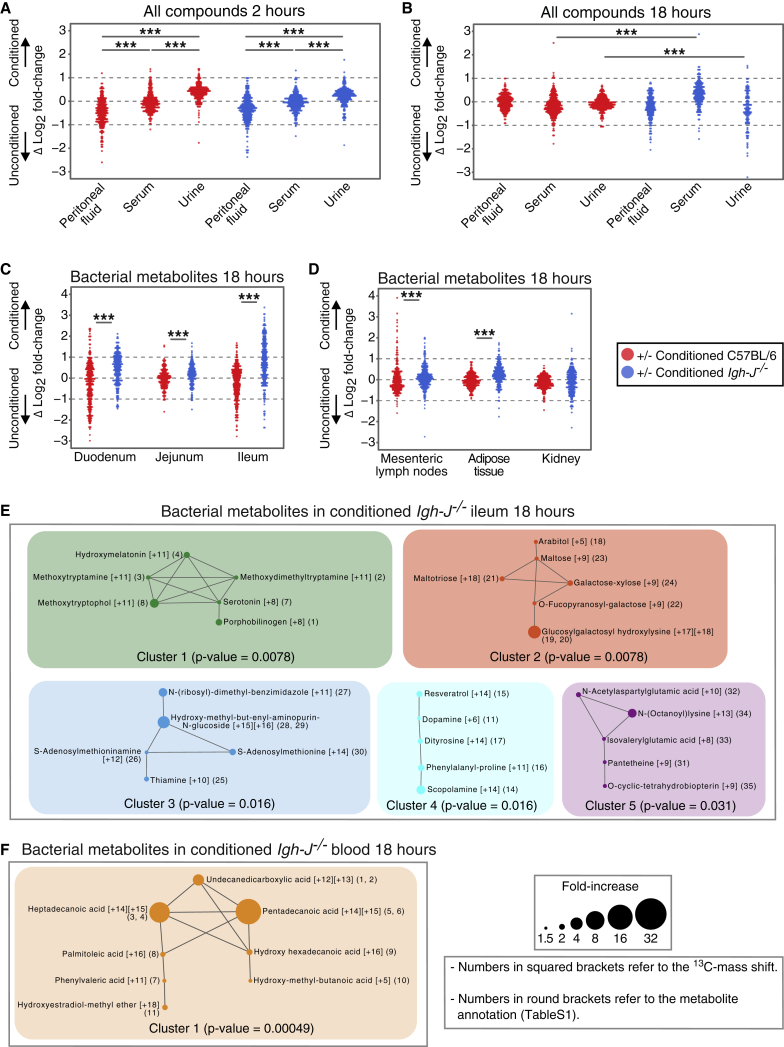
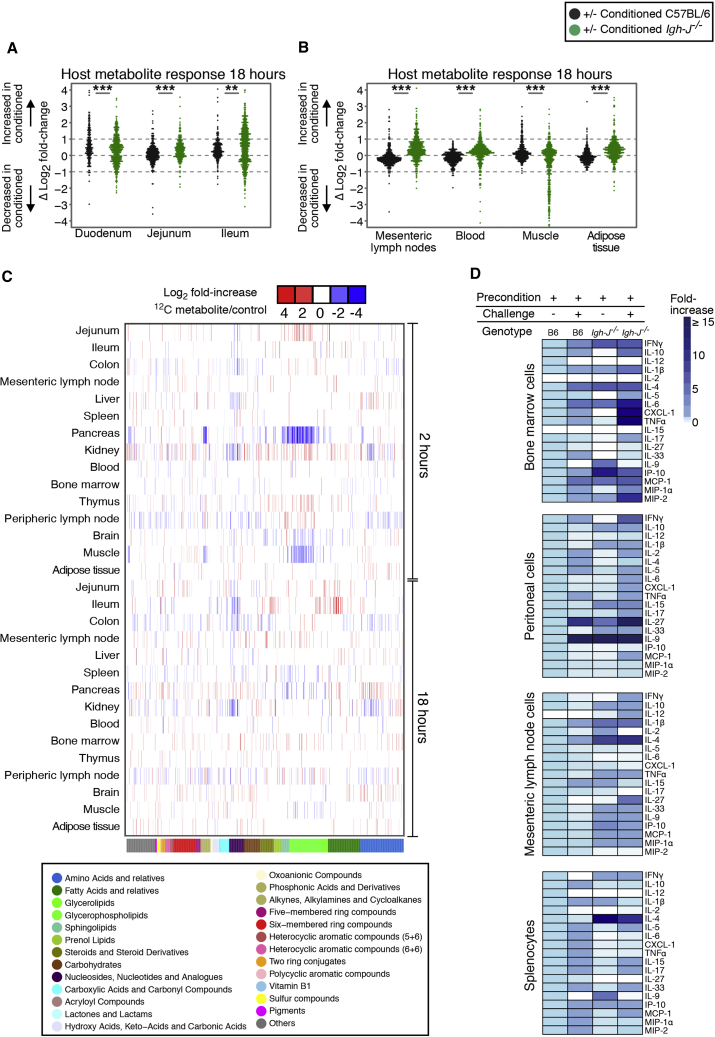
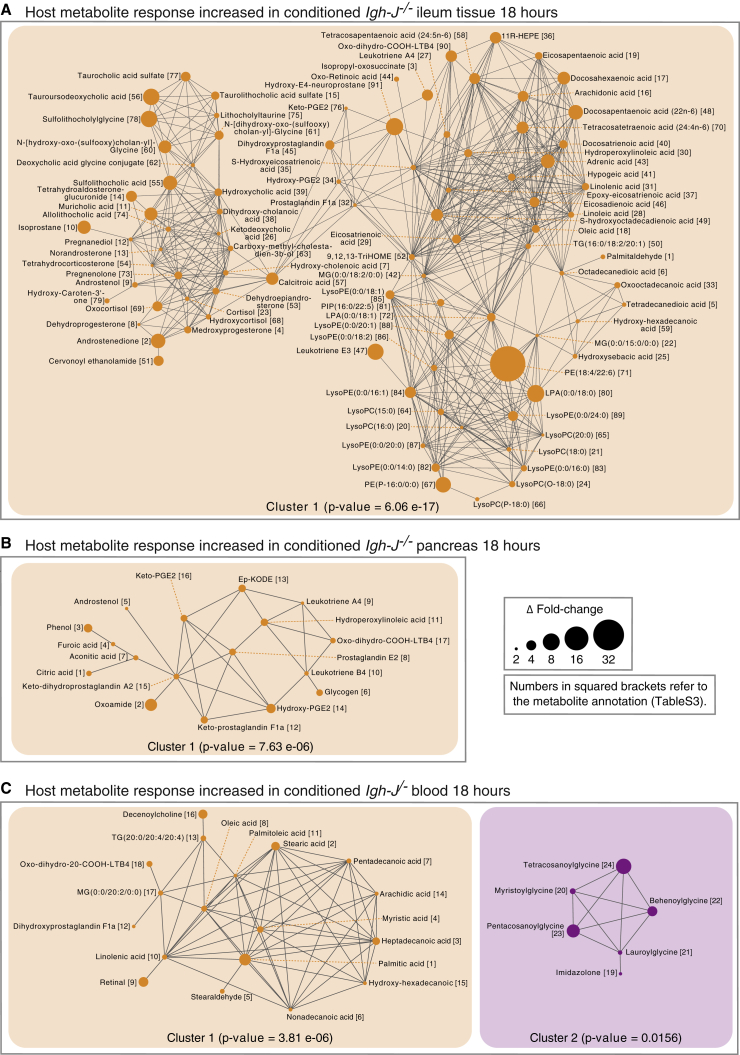
Although the mammalian microbiota is well contained within the intestine, it profoundly shapes development and metabolism of almost every host organ. We questioned the range and depth of microbial metabolite penetration into the host, and how this is modulated by intestinal immunity. Chemically identical microbial and host metabolites were distinguished by stable isotope tracing from 13C-labeled live non-replicating Escherichia coli, differentiating 12C host isotopes with high-resolution mass spectrometry. Hundreds of endogenous microbial compounds penetrated 23 host tissues and fluids after intestinal exposure: subsequent 12C host metabolome signatures included lipidemia, reduced glycolysis, and inflammation. Penetrant bacterial metabolites from the small intestine were rapidly cleared into the urine, whereas induced antibodies curtailed microbial metabolite exposure by accelerating intestinal bacterial transit into the colon where metabolite transport mechanisms are limiting. Pervasive penetration of microbial molecules can cause extensive host tissue responses: these are limited by immune and non-immune intestinal mucosal adaptations to the microbiota.

Keywords: (13)C-isotope tracing; IgA; colonization; germ free; inflammation; intestinal transit; lipidemia; metabolomics; microbial metabolites; microbiota.


Figures

None
Graphical abstract
Figure 1
Figure 1
Depth of Penetration of 13C-Labeled Bacterial Amino Acids from the Intestine to Systemic Sites of the Body Germ-free C57BL/6 mice were gavaged with 13C- or 12C-labeled HA107 or PBS as control (n = 3–4 mice per group). Differential ions detected in different host tissues after 2 hr annotated as fully 13C-labeled amino acids are indicated where the identical mass did not exhibit any significant change in the 12C to PBS comparison (positive Log2-fold change cutoff of 1 and p value < 0.05). Results are representative of three experiments. See also Figure S1.
Figure 2
Figure 2
Penetration of 13C-Labeled Bacterial Metabolites from the Intestine to Host Tissues and Fluids Germ-free C57BL/6 mice were gavaged with 13C-labeled HA107 or PBS as control (n = 3–4 mice per group). Fluid samples were collected 2 or 18 hr later and analyzed with Q-TOF mass spectrometry. All ions which were annotated as metabolite isotopes ≥75% 13C labeled are plotted. (A) Left panel shows samples from small intestinal fluid, peritoneal fluid, serum, and urine at 2 hr; lines connect identical metabolites. Inset shows small intestinal, cecal, and colon fluids also at 2 hr. Right panel shows 18 hr cecal, colon, peritoneal, serum, and urine fluid samples with (inset) small intestinal, cecum, and colon fluids. (B) Cluster analysis heatmap of all 13C-labeled annotated metabolites (p < 0.05, ≥3 mice/group) in different host fluids at 2 hr and 18 hr after gavage. Metabolite classes are shown in the lower color bar and legend. Results are representative of three experiments. (C) As for (B), except 13C-labeled annotated metabolites in host tissues are shown. See also Figure S2.
Figure 3
Figure 3
Kinetics of Metabolite Penetration and Durable Intestinal Conditioning Responses to E. coli HA107 (A and B) 14C-metabolically labeled E. coli HA107 was administered into the stomach (closed circles) or mixed directly with cecal contents (open circles) of germ-free C57BL/6 mice. For comparison, 14C-labeled E. coli JM83 (replication competent parent strain of HA107; red triangles) was administered into the stomach in a separate group. 14C-radioactivity in the urine (A) or serum (B) at 2, 8, and 18 hr. Results are expressed as a percentage of the gavage dose/g fluid over background. (C) RNA-seq analysis of small intestinal tissue from C57BL/6 germ-free mice primed with HA107 transitory colonization 2 weeks earlier, compared with control germ-free mice. Upper panel: volcano plot shows significantly altered gene expression (padj < 0.05, n ≥ 3) in HA107-preconditioned germ-free mice or in sham-treated germ-free mice. Immunoglobulin genes are annotated. Expanded box shows a STRING-DB representation of significantly upregulated non-immunoglobulin genes in preconditioned mice. (D) Expression of transcripts coding microbiocidal peptides (x¯ ± SEM, n ≥ 3). (E) Live intestinal microvascular endomicroscopy imaging. FITC-dextran (70 kD) fluorescence was visulized after i.v. injection into HA107-preconditioned C57BL/6 germ-free and control germ-free mice in the small intestinal villus microvasculature with live Cellvizio endomicroscopy. The x¯ ± SEM of endothelial/epithelial ratios of each group (n = 6) is indicated (t test p < 0.02). Results are representative of six experiments. See also Figure S3.
Figure 4
Figure 4
Transient Intestinal Microbial Conditioning Enhances Clearance of Bacteria and Their Metabolites from the Intestine of C57BL/6 Mice Compared with Antibody-Deficient Igh-J−/− Mice Germ-free C57BL/6 mice (red) or antibody-deficient Igh-J−/− mice (blue) were preconditioned with HA107 or control treated. Twelve days after all groups had returned to germ-free status, they were gavaged with 13C-labeled HA107 or PBS as control (n = 3–4 per group) and Log2 fold-changes were calculated (Figure S1Aii). (A) Samples from small intestinal, cecal, and colon fluids were collected at 2 hr and analyzed with Q-TOF mass spectrometry. Differences between the Log2-fold values of preconditioned and unconditioned mice are shown for ions annotated as metabolite isotopes with ≥75% 13C labeled. Fold-changes based on low abundant ions (counts < 200) were excluded. Mann-Whitney U test; ∗∗∗p < 0.001. (B) As for (A), but the plot shows individual compound classes. (C) Small intestinal transit of replication-deficient bacteria in wild-type mice and antibody-deficient mice. HA107 preconditioned C57BL/6 mice (red symbols) were compared with HA107 preconditioned antibody-deficient Igh-J−/− mice (blue) 2 hr after challenging with 107 colony forming units (CFU) HA107 delivered into the stomach. The small intestine was divided into 10 sections and CFU in luminal contents of each section were determined with auxtrophic supplements (x¯ ± SD n = 3, p < 0.05). (D) Whole intestinal transit of replication-deficient bacteria in wild-type mice and antibody-deficient mice. HA107 preconditioned C57BL/6 mice (red symbols) or antibody-deficient Igh-J−/− mice (blue) were gavaged with 108 CFU HA107. Feces were plated with auxotrophic supplements (p < 0.05). Results are representative of two experiments with ≥6 mice/group. See also Figure S4.
Figure 5
Figure 5
Transient Intestinal Microbial Conditioning Enhances Antibody-Independent Early Clearance of Bacterial Metabolites into the Urine Germ-free C57BL/6 mice (red symbols) or antibody-deficient Igh-J−/− mice (blue) were preconditioned with HA107 or control-treated, returning to germ-free status 12 days prior to re-challenge with a gastric dose of fully 13C-labeled or 12C- HA107 as in the Figure 4 legend. (A and B) Log2 fold differences between HA107-preconditioned and unconditioned germ-free mice for individual annotated ions representing metabolites containing ≥75% 13C are shown for peritoneal fluid, serum, or urine 2 hr (A) or 18 hr (B) after challenge. (C and D) As for (B) but showing persistent bacterial metabolites in intestinal (C) or systemic (D) tissues of antibody-deficient mice at 18 hr. (E) Pairwise Tanimoto chemical similarity indices of more than 1.5-fold increased bacterial metabolites (≥75% 13C) in ileal tissues at 18 hr of conditioned antibody-deficient mice. Numbers in squared brackets show mass shifts of each metabolite and in round brackets denote chemical annotations for each metabolite in Table S1. Metabolites with Tanimoto chemical similarity ≥ 0.7 are interconnected and node size shows fold-increase. The paired Mann-Whitney U test was applied to calculate the p value of each network. (F) As (E), except analysis of blood metabolite networks. Results are representative of three experiments. See also Figure S5.
Figure 6
Figure 6
Exaggerated Host Metabolite Responses in Antibody-Deficient Mice after Microbial Challenge Germ-free C57BL/6 mice (black symbols) or antibody-deficient Igh-J−/− mice (green) were preconditioned with HA107 or control treated, returning to germ-free status 12 days prior to re-challenge with a gastric dose of fully 13C-labeled or 12C HA107. Tissue samples were collected after 18 hr for Q-TOF mass spectrometry. Annotated ions representing metabolites containing concordant changes from 13C and 12C pulsed mice without mass shift were plotted. (A and B) Log2 fold-change differences between preconditioned and control mice for each metabolite is shown for (A) duodenal, jejunal, and ileal tissues; (B) mesenteric lymph nodes, blood, muscle, and adipose tissues. (C) Heatmap showing cluster analysis of concordant increases (red) or losses (blue) of 12C-host annotated metabolites (p < 0.05, ≥3 mice/group) where the identical metabolite change was seen without a mass shift in both 13C- and 12C-HA107 challenged antibody-deficient mice. Lower color bar and legend shows metabolite classes. Results are representative of two experiments. (D) Preconditioned germ-free C57BL/6 mice or antibody-deficient Igh-J−/− mice were either re-challenged with a gastric dose of 1010 HA107 or left untreated. Total cells isolated from different lymphoid tissues were cultured for 2 hr prior to supernatant cytokine analysis. Results are calculated from two independent experiments with 3–4 mice/group. See also Figures S6 and S7.
Figure 7
Figure 7
Tanimoto Chemical Similarity Networks of Increased Metabolite Responses in Conditioned Antibody-Deficient Mice after Microbial Challenge Tanimoto chemical similarity indices of increased host response metabolites in both 13C- and 12C-pulsed mice without mass shift of the annotated ions were analyzed as described in Figure 5. Networks from the ileum (A), the pancreas (B), or the blood (C) are shown with interconnected chemical similarities ≥0.7. Numbers in squared brackets correspond to chemical annotations for each metabolite in Table S3. Node size represents the absolute value of Δ-fold change difference between conditioned and control germ-free Igh-J−/−. Paired Mann-Whitney U test was applied to calculate p value of each network. Results are representative of two independent experiments with 3–4 mice/group. See also Figures S6 and S7.

Comment in

  • Gone with the Antibody.
    Guglietta S, Rescigno M. Guglietta S, et al. Immunity. 2018 Sep 18;49(3):386-388. doi: 10.1016/j.immuni.2018.09.003. Immunity. 2018. PMID: 30231978

References

    1. Anders S., Pyl P.T., Huber W. HTSeq--a Python framework to work with high-throughput sequencing data. Bioinformatics. 2015;31:166–169. - PMC - PubMed
    1. Arpaia N., Campbell C., Fan X., Dikiy S., van der Veeken J., deRoos P., Liu H., Cross J.R., Pfeffer K., Coffer P.J., Rudensky A.Y. Metabolites produced by commensal bacteria promote peripheral regulatory T-cell generation. Nature. 2013;504:451–455. - PMC - PubMed
    1. Bäckhed F., Roswall J., Peng Y., Feng Q., Jia H., Kovatcheva-Datchary P., Li Y., Xia Y., Xie H., Zhong H. Dynamics and stabilization of the human gut microbiome during the first year of life. Cell Host Microbe. 2015;17:690–703. - PubMed
    1. Barupal D.K., Haldiya P.K., Wohlgemuth G., Kind T., Kothari S.L., Pinkerton K.E., Fiehn O. MetaMapp: mapping and visualizing metabolomic data by integrating information from biochemical pathways and chemical and mass spectral similarity. BMC Bioinformatics. 2012;13:99. - PMC - PubMed
    1. Beatty D.W., Napier B., Sinclair-Smith C.C., McCabe K., Hughes E.J. Secretory IgA synthesis in Kwashiorkor. J. Clin. Lab. Immunol. 1983;12:31–36. - PubMed

Publication types