. 2018 Oct 1;215(10):2655-2672.
doi: 10.1084/jem.20180483. Epub 2018 Sep 7.

Piezo1 and Gq/G11 promote endothelial inflammation depending on flow pattern and integrin activation

Affiliations

Piezo1 and Gq/G11 promote endothelial inflammation depending on flow pattern and integrin activation

Julián Albarrán-Juárez et al. J Exp Med. .

Abstract

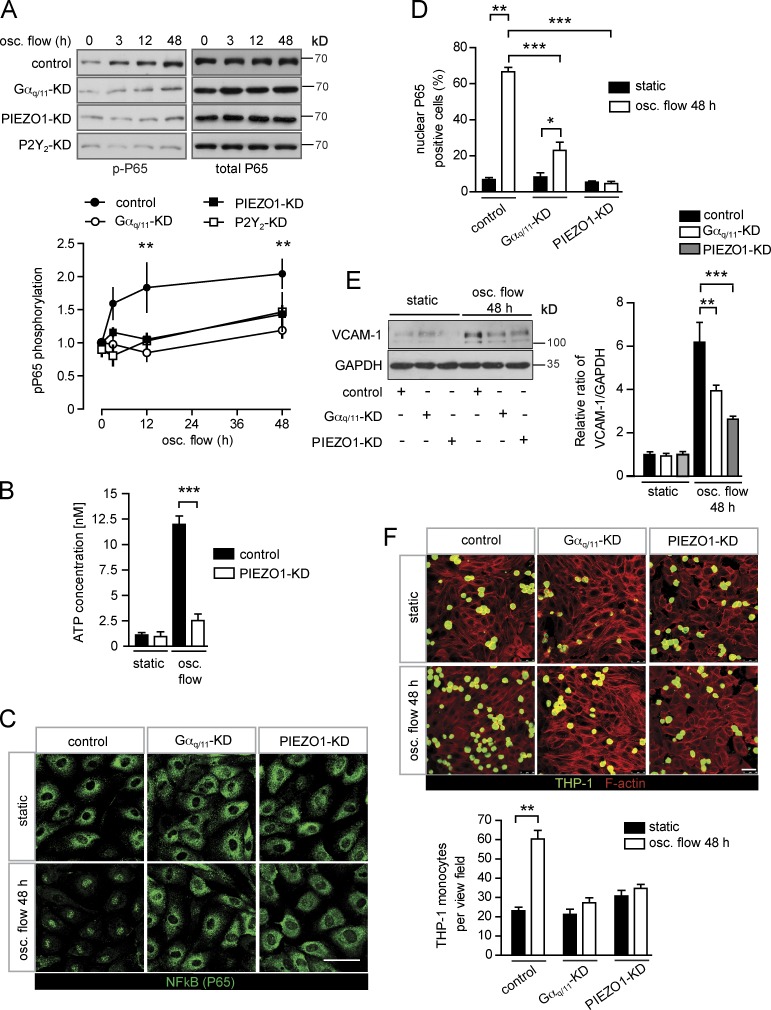
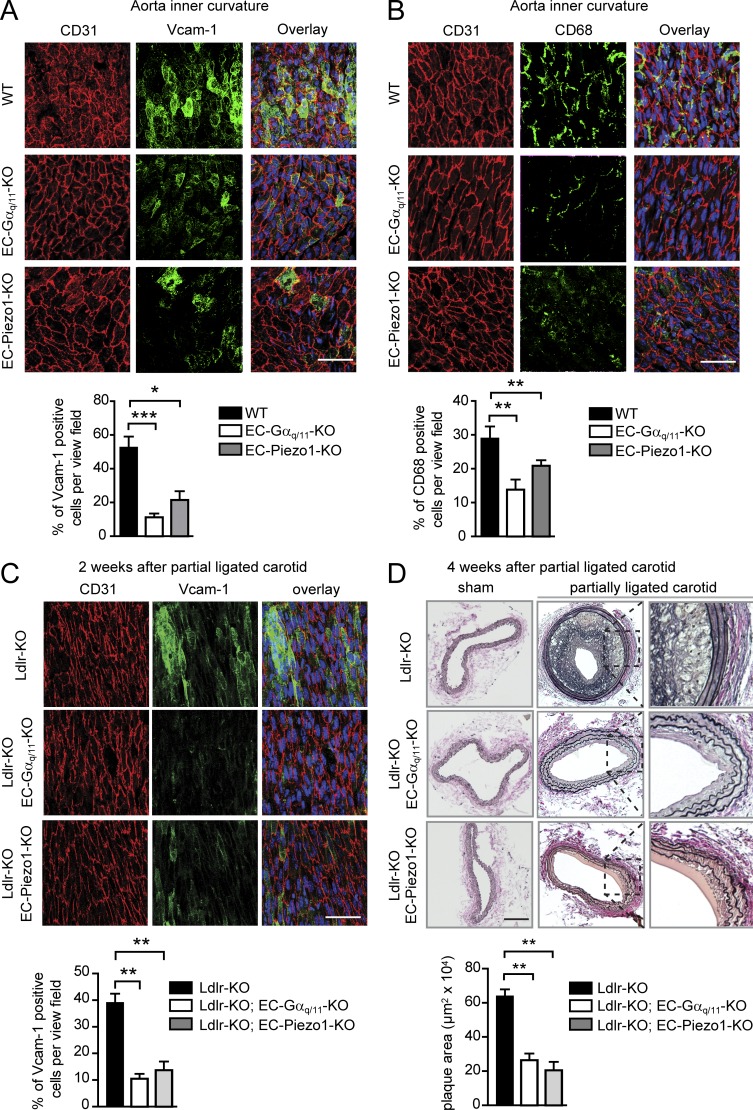
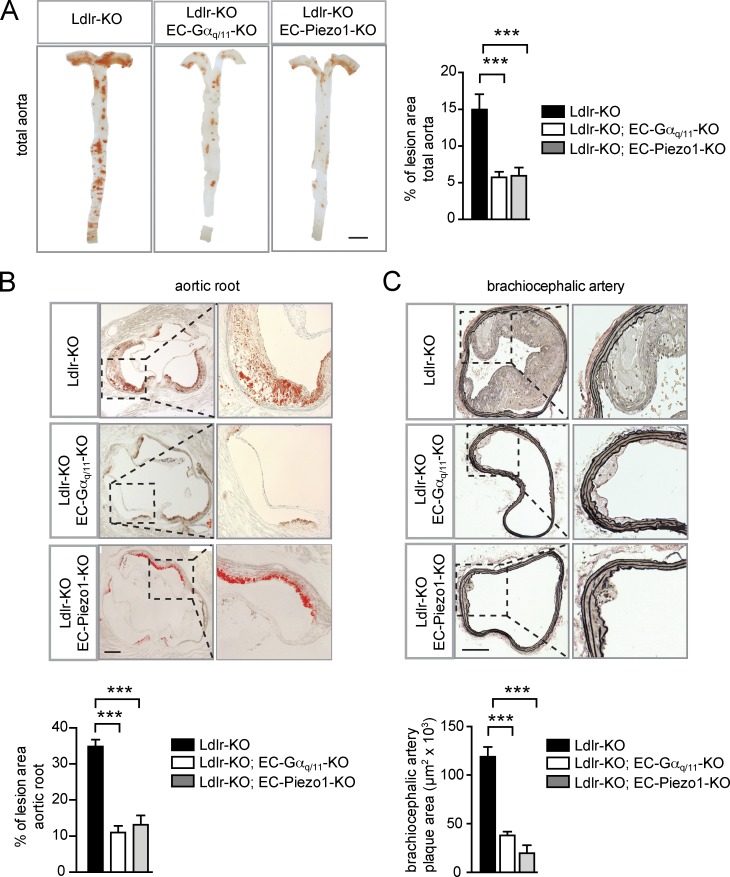
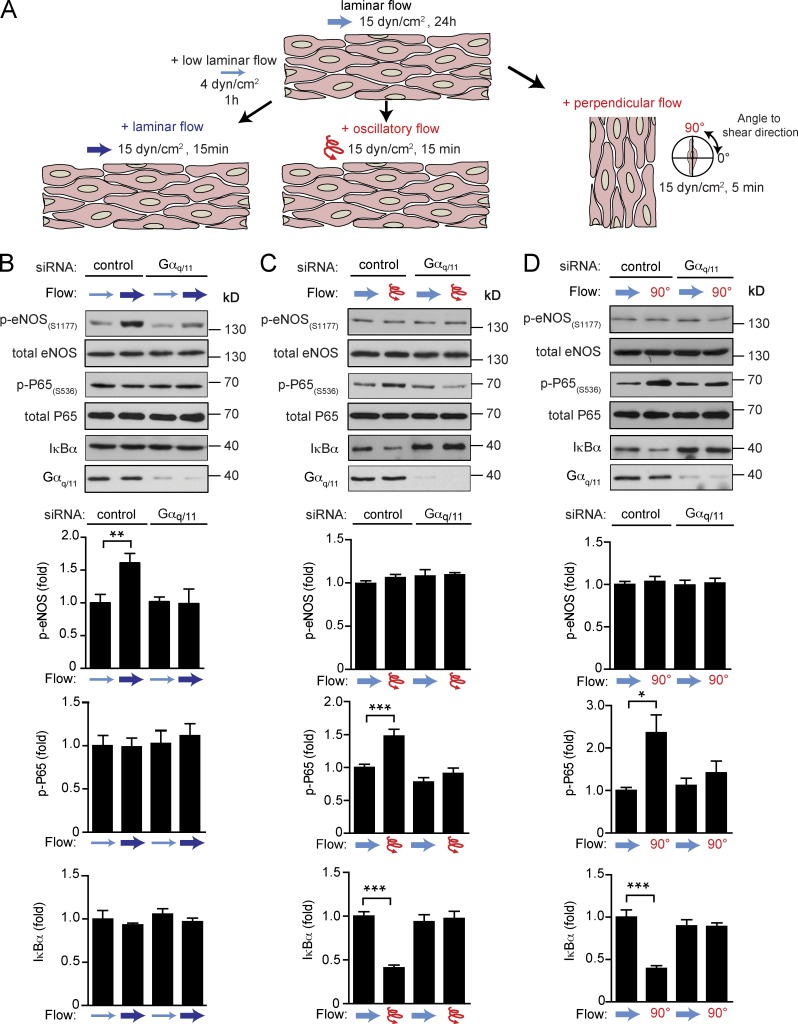
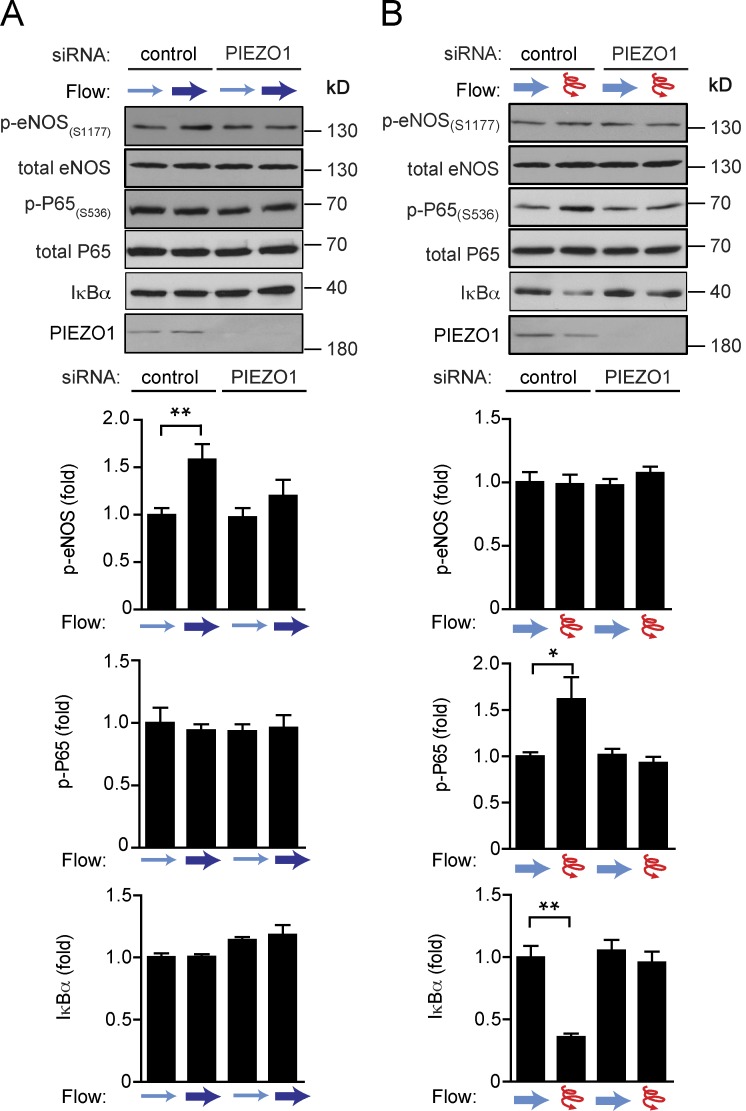
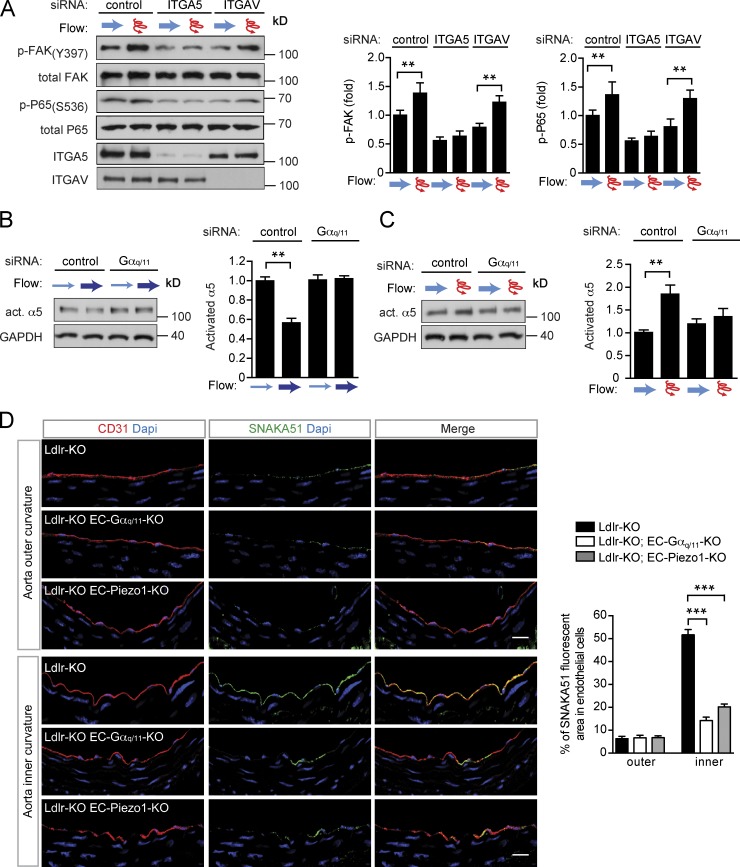
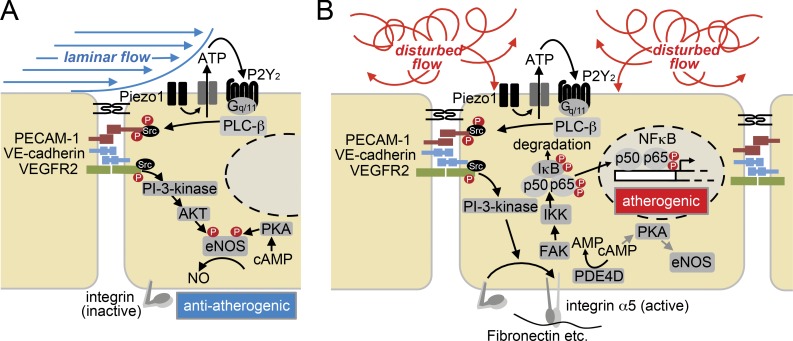
The vascular endothelium is constantly exposed to mechanical forces, including fluid shear stress exerted by the flowing blood. Endothelial cells can sense different flow patterns and convert the mechanical signal of laminar flow into atheroprotective signals, including eNOS activation, whereas disturbed flow in atheroprone areas induces inflammatory signaling, including NF-κB activation. How endothelial cells distinguish different flow patterns is poorly understood. Here we show that both laminar and disturbed flow activate the same initial pathway involving the mechanosensitive cation channel Piezo1, the purinergic P2Y2 receptor, and Gq/G11-mediated signaling. However, only disturbed flow leads to Piezo1- and Gq/G11-mediated integrin activation resulting in focal adhesion kinase-dependent NF-κB activation. Mice with induced endothelium-specific deficiency of Piezo1 or Gαq/Gα11 show reduced integrin activation, inflammatory signaling, and progression of atherosclerosis in atheroprone areas. Our data identify critical steps in endothelial mechanotransduction, which distinguish flow pattern-dependent activation of atheroprotective and atherogenic endothelial signaling and suggest novel therapeutic strategies to treat inflammatory vascular disorders such as atherosclerosis.


Figures

Figure 1.
Figure 1.
Endothelial inflammation induced by disturbed flow is mediated by Piezo1 and Gq/G11. (A–F) Confluent HUAECs were transfected with scrambled (control) siRNA, siRNA directed against Piezo1, P2Y2, or Gαq and Gα11. 24 h after second transfection, cells were further grown in the absence of flow (no flow) or were exposed to low and oscillatory (osc.) flow (4 dynes/cm2, 1 Hz) using a flow chamber (A and C–F) or a cone-plate viscometer (B), as described in Materials and methods, for the indicated time periods (A). NF-κB activation was determined by Western blotting for phosphorylated P65 (Ser536). Shown are representative blots. The linear diagram shows the densitometric evaluation of three to five independent experiments normalized to total P65. (B) Concentration of ATP in the supernatant of HUAECs kept under static conditions or under oscillatory flow (data are representative of a least three independent experiments). (C and D) Cellular P65 localization was determined by staining of cells with an anti-P65 antibody. Representative micrographs are shown to quantify nuclear translocation of P65, at least 100 cells were counted per condition for each experiment (data are representative of a least three independent experiments per group). (E) VCAM-1 immunoreactivity was determined by Western blotting (representative blots of four independent experiments). (F) To study monocyte cell adhesion to HUAECs, cells were preexposed to oscillatory flow for 48 h and were incubated with fluorescently labeled THP-1 cells for 30 min at 37°C. (Shown are representative micrographs from three independent experiments). Actin fibers were stained with anti–phalloidin-Alexa Fluor 568 and visualized by confocal microscopy. Bars, 50 µm. Data represent mean values ± SEM; **, P ≤ 0.01; ***, P ≤ 0.001 (two-way ANOVA and Bonferroni’s post hoc test [A, D, and E] and two-tailed Student’s t test [B and F]).
Figure 2.
Figure 2.
Endothelial Piezo1 and Gq/G11 deficiency results in decreased endothelial inflammation and reduced progression of atherosclerosis. (A and B) Shown are representative en face immuno-confocal microscopy images of the inner curvature from 12-wk-old wild-type and endothelium-specific Piezo1-KO (EC-Piezo1-KO) and Gαq/Gα11-KO (EC-Gαq/Gα11-KO) mice (n = 6 per genotype per condition). En face aortic arch preparations were triple stained with anti-CD31, anti–Vcam-1 (A) or anti-CD68 antibodies (B) and DAPI. Immunofluorescence staining was quantified as the percentage of Vcam-1–positive cells among CD31-positive cells per view field (A) and as the percentage of CD68-positive cells per view field (B). (C and D) Atherosclerosis-prone Ldlr-KO mice without (Ldlr-KO) or with endothelium-specific Piezo1 (Ldlr-KO; EC-Piezo1-KO) or Gαq/Gα11 deficiency (Ldlr-KO;EC-Gαq/11-KO) were sham operated or underwent partial carotid artery ligation. (C) 14 d after ligation, en face preparations of the left common carotid artery (ligated artery) were stained with DAPI and antibodies against CD31 and Vcam-1. Vcam-1 staining was quantified as percentage of positive cells per view field. (D) 28 d after ligation, carotid arteries were sectioned and stained with elastic stain. Bar graphs show quantification of the intimal plaque area (n = 6 mice per genotype per condition). Bars: 50 µm (A–C) and 100 µm (D). Data represent mean ± SEM; *, P ≤ 0.05; **, P ≤ 0.01; ***, P ≤ 0.001 (one-way ANOVA and Bonferroni’s post hoc test).
Figure 3.
Figure 3.
Deficiency of endothelial Piezo1 and Gq/G11 reduces atherosclerotic plaque formation. (A–C) Representative atherosclerotic lesions in Ldlr-KO mice without or with induced endothelium-specific Piezo1 deficiency (Tie2-CreER(T2);Piezo1flox/flox (Ldlr-KO;EC-Piezo1-KO)) or endothelium-specific Gαq/Gα11 deficiency (Cdh5-Cre;Gnaqflox/flox;Gna11−/− (Ldlr-KO;EC-Gαq/11-KO)) were fed a high-fat diet for 16 wk (n = 6–10 per genotype). (A) Representative images are shown of whole aortae that were prepared en face and stained with oil-red-O. En face atherosclerotic lesions are shown as percentage of total aorta area. (B) Representative oil-red-O–stained atherosclerotic lesions images in the aortic valve region (n = 6–10 per genotype). Dotted boxes are shown in higher magnifications in right panel. Plaque area was quantified as percentage of total aortic root area per genotype. (C) Representative images of atherosclerotic plaques observed in brachiocephalic arteries (innominate arteries). 5-µm paraffin cross sections were stained with elastic stain for assessment of morphological features. (n = 6–10 animals per genotype). Dotted boxes are shown in higher magnifications in right panel. Shown is the quantification of total plaque area in the brachiocephalic arteries. Data represent mean ± SEM; ***, P ≤ 0.001 (one-way ANOVA and Bonferroni’s post hoc test). Bars: 5 mm (A); 250 µm (B); 100 µm (C).
Figure 4.
Figure 4.
Endothelial Gq/G11 mediates atheroprotective or atheroprone signaling upon stimulation by different flow patterns. (A) Diagram of work flow. Endothelial cells were first exposed to laminar flow for 24 h. Thereafter, cells were reexposed to high laminar flow to induce atheroprotective signaling. Alternatively, cells were exposed to either disturbed flow (high frequency oscillatory flow) or flow direction was changed by 90 degrees to induce atherogenic signaling. (B–D) HUAECs were transfected with scrambled siRNA (control) or siRNA directed against Gαq and Gα11 (Gαq/11). Thereafter, cells were preflowed for 24 h (15 dynes/cm2) and then subjected to low flow for 1 h (4 dynes/cm2) and/or high flow for 15 min (15 dynes/cm2; B) or to oscillatory flow (15 dynes/cm2, 1 Hz for 15 min; C) or to perpendicular flow (90 degrees) for 5 min (D). Thereafter, cells were lysed and phosphorylated eNOS (Ser1177), phosphorylated P65 (Ser536), and total IκBα, eNOS, P65, and Gαq/Gα11 levels were analyzed by immunoblotting. Shown are representative blots from three to five independent experiments. Bar diagrams show the densitometric evaluation of corresponding immunoblots. Data represent mean ± SEM; *, P ≤ 0.05; **, P ≤ 0.01 ***, P ≤ 0.001 (two-tailed Student’s t test).
Figure 5.
Figure 5.
Endothelial Piezo1 mediates atheroprotective or atheroprone signaling depending on the flow pattern. (A and B) HUAECs were transfected with scrambled siRNA (control) or siRNAs directed against Piezo1 (PIEZO1). Thereafter, cells were preflowed for 24 h (15 dynes/cm2) and then reexposed to laminar flow as in Fig. 4 B (A) or to oscillatory flow as in Fig. 4 C (B). Cells were then lysed and phosphorylated eNOS (Ser1177), phosphorylated P65 (Ser536), and total levels of IκBα, eNOS, P65, and Piezo1 were analyzed by immunoblotting. Shown are representative blots from three to five independent experiments. Bar diagrams show the densitometric evaluation of corresponding immunoblots. Data represent mean ± SEM; *, P ≤ 0.05 (two-tailed Student’s t test).
Figure 6.
Figure 6.
FAK is differentially activated by different flow patterns via Piezo1 and Gq/G11. (A–E) HUAECs were transfected with scrambled siRNA (control) or siRNA directed against Gαq and Gα11 (Gαq/11; A–C) or against Piezo1 (D and E) and exposed to laminar or disturbed flow as described in Fig. 4 A. Activation of integrin signaling was determined by immunoblotting for phosphorylated focal adhesion kinase (pFAK, Y397). Bar diagrams show densitometric evaluation of immunoblots (quantification of three to five independent experiments). (F and G) Ldlr-KO mice without or with endothelium-specific Gαq/Gα11 deficiency (Ldlr-KO;EC-Gαq/11-KO; F) or endothelium-specific Piezo1 deficiency (Ldlr-KO;EC-Piezo1-KO) were fed a high-fat diet for 4 wk (n = 4–6 mice per genotype). Cross sections of the inner and outer curvatures of aortic arches were stained with antibodies against phosphorylated FAK (Y397, green) and against the endothelial marker CD31 (red) and with DAPI (blue). Data are representative of six to eight microscope field areas per animal. Bar diagrams show percentage of area stained by anti-pFAK antibody of total endothelial cell area defined by staining by anti-CD31 antibody (based on analysis of at least five sections each from at least four different animals). Bars, 50 µm. Data represent mean ± SEM; *, P ≤ 0.05; **, P ≤ 0.01; ***, P ≤ 0.001 (two-tailed Student’s t test).
Figure 7.
Figure 7.
Integrins are differentially activated by different flow patterns via Piezo1 and Gq/G11. (A–C) HUAECs were transfected with scrambled siRNA (control) or siRNA directed against ITGA5 and ITGAV (A) or against Gαq and Gα11 (Gαq/11; B and C) and were exposed to laminar or disturbed flow as described in Fig. 4 A. Activation of integrin signaling was determined by immunoblotting for phosphorylated focal adhesion kinase (pFAK, Y397; A) or by immunoprecipitation of activated α5 integrin (B and C). P65 activation was determined by anti–phospho-P65 (S536) antibodies (A). Bar diagrams show densitometric evaluation of immunoblots (quantification of three to five independent experiments). (D) Ldlr-KO mice without or with endothelium-specific Gαq/Gα11 deficiency (Ldlr-KO;EC-Gαq/11-KO) endothelium-specific Piezo1-deficiency (Ldlr-KO;EC-Piezo1-KO) were fed a high-fat diet for 4 wk (n = 4–6 mice per genotype). Cross sections of the inner and outer curvatures of aortic arches were immunostained with antibodies against activated α5 integrin (SNAKA51; green), against the endothelial marker CD31 (red) or with DAPI (blue). Bar diagrams show percentage of area stained by anti-activated α5 integrin antibody of total endothelial cell area defined by staining by anti-CD31 antibody (based on analysis of at least five sections each from at least four different animals). Bars, 25 µm. Data represent mean ± SEM; *, P ≤ 0.05; **, P ≤ 0.01; ***, P ≤ 0.001 (two-tailed Student’s t test).
Figure 8.
Figure 8.
Model of the role of Piezo1 and Gq/G11 proteins in endothelial response to different flow patterns. (A and B) Laminar flow (A) and disturbed flow (B) activate the same initial signaling processes involving the mechanosensitive cation channel Piezo1 and the purinergic receptor P2Y2, as well as Gq/G11-mediated signaling and activation of the mechanosignaling complex consisting of PECAM-1, VE-cadherin, and VEGFR2. In cells exposed to laminar flow, integrins are not activated and this initial signal transduction pathway promotes atheroprotective signaling including activation of eNOS through PI-3-kinase and AKT. Through incompletely understood pathways, eNOS is also activated by cAMP acting through protein kinase A (PKA). In cells exposed to disturbed flow, activation of the initial signaling pathway results in integrin activation, which promotes via focal adhesion kinase (FAK) NF-κB activation and atherogenic signaling, as well as reduced eNOS activation by promoting cAMP degradation via activation of phosphodiesterase 4D (PDE4D).

References

    1. Abramoff M.D., Magalhaes P.J., and Ram S.J.. 2004. Image Processing with ImageJ. Biophoton. Int. 11:36–42.
    1. Alva J.A., Zovein A.C., Monvoisin A., Murphy T., Salazar A., Harvey N.L., Carmeliet P., and Iruela-Arispe M.L.. 2006. VE-Cadherin-Cre-recombinase transgenic mouse: a tool for lineage analysis and gene deletion in endothelial cells. Dev. Dyn. 235:759–767. 10.1002/dvdy.20643 - DOI - PubMed
    1. Baeyens N., and Schwartz M.A.. 2016. Biomechanics of vascular mechanosensation and remodeling. Mol. Biol. Cell. 27:7–11. 10.1091/mbc.e14-11-1522 - DOI - PMC - PubMed
    1. Baeyens N., Mulligan-Kehoe M.J., Corti F., Simon D.D., Ross T.D., Rhodes J.M., Wang T.Z., Mejean C.O., Simons M., Humphrey J., and Schwartz M.A.. 2014. Syndecan 4 is required for endothelial alignment in flow and atheroprotective signaling. Proc. Natl. Acad. Sci. USA. 111:17308–17313. 10.1073/pnas.1413725111 - DOI - PMC - PubMed
    1. Bagi Z., Frangos J.A., Yeh J.C., White C.R., Kaley G., and Koller A.. 2005. PECAM-1 mediates NO-dependent dilation of arterioles to high temporal gradients of shear stress. Arterioscler. Thromb. Vasc. Biol. 25:1590–1595. 10.1161/01.ATV.0000170136.71970.5f - DOI - PubMed

Publication types

MeSH terms