. 2018 Sep 7;9(1):3640.
doi: 10.1038/s41467-018-06050-2.

Tropical peatland carbon storage linked to global latitudinal trends in peat recalcitrance

Affiliations

Tropical peatland carbon storage linked to global latitudinal trends in peat recalcitrance

Suzanne B Hodgkins et al. Nat Commun. .

Abstract

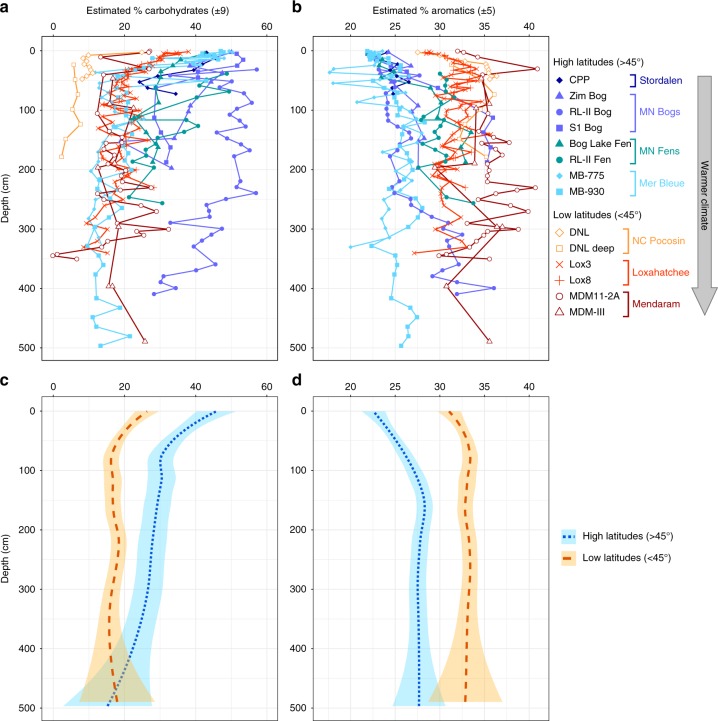
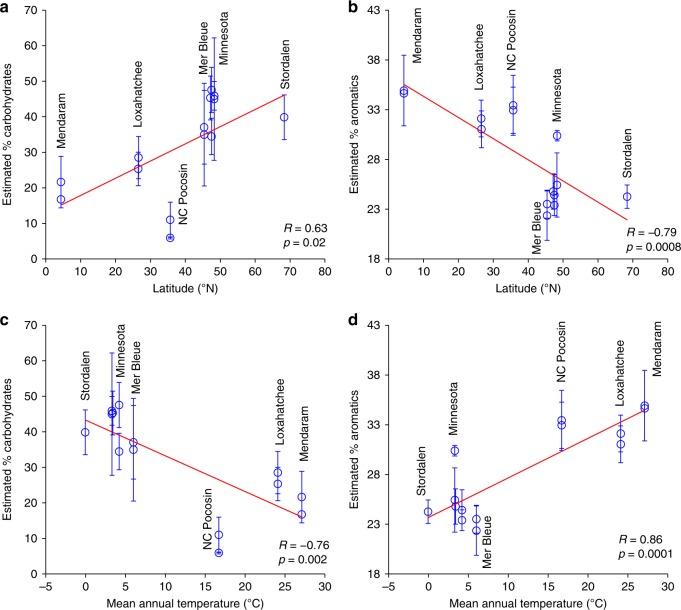
Peatlands represent large terrestrial carbon banks. Given that most peat accumulates in boreal regions, where low temperatures and water saturation preserve organic matter, the existence of peat in (sub)tropical regions remains enigmatic. Here we examined peat and plant chemistry across a latitudinal transect from the Arctic to the tropics. Near-surface low-latitude peat has lower carbohydrate and greater aromatic content than near-surface high-latitude peat, creating a reduced oxidation state and resulting recalcitrance. This recalcitrance allows peat to persist in the (sub)tropics despite warm temperatures. Because we observed similar declines in carbohydrate content with depth in high-latitude peat, our data explain recent field-scale deep peat warming experiments in which catotelm (deeper) peat remained stable despite temperature increases up to 9 °C. We suggest that high-latitude deep peat reservoirs may be stabilized in the face of climate change by their ultimately lower carbohydrate and higher aromatic composition, similar to tropical peats.


Conflict of interest statement

The authors declare no competing interests.

Figures

Fig. 1
Fig. 1
Locations of study sites along the global temperature gradient. Sites are shown as numbered white dots: (1) Stordalen (Sweden); (2) RL-II Bog and RL-II Fen (Minnesota, USA); (3) Zim Bog, S1 Bog, and Bog Lake Fen (Minnesota, USA); (4) Mer Bleue (Ontario, Canada); (5) NC Pocosin (North Carolina, USA); (6) Loxahatchee (Florida, USA); (7) Mendaram (Borneo, Brunei). The map shows global mean annual surface temperature in degrees Celsius (°C) (ref. )
Fig. 2
Fig. 2
Variations in peat chemistry depth profiles across the latitudinal transect. a, b Estimated weight percentages of a carbohydrates and b aromatics in individual samples, determined based on Fourier transform infrared spectroscopy (FTIR) peak heights (~1030 cm−1 for carbohydrates, and the sum of ~1510 and ~1630 cm−1 for aromatics) calibrated to wet chemistry measurements (see Methods). Errors listed in the x-axis for each measurement are the standard errors of the y estimates for the calibrations shown in Supplementary Fig. 2. These depth profiles are also shown separated by peatland category in Supplementary Fig. 4. c, d General trends for high-latitude and low-latitude peatlands illustrated with locally weighted polynomial regression (LOESS) smooth curves and shaded 95% confidence intervals (LOESS parameters: degree = 2, α = 0.75) for c carbohydrates and d aromatics, shown for individual cores in a and b, respectively
Fig. 3
Fig. 3
Correlations of estimated carbohydrate and aromatic contents with latitude and mean annual temperature. a Carbohydrates vs. latitude; b aromatics vs. latitude; c carbohydrates vs. temperature; d aromatics vs. temperature. Each point represents the average ± one standard deviation (SD) of core sections within the top 50 cm of each core (Supplementary Table 2)
Fig. 4
Fig. 4
Variations in overall spectra of peat and plant samples from across the latitudinal transect. These variations are illustrated with principal components analysis (PCA) of entire Fourier transform infrared (FTIR) spectra from two sample sets: a, b peat samples only, with the same color scheme as Fig. 2; and c, d all peat and plant samples (plants shown in Fig. 5 and Supplementary Table 3), with peat color-coded by depth. Vectors on score plots indicate the direction of the increasing gradient for each variable, with arrow lengths proportional to the strength of the correlation with the PCA. All correlations were significant at p ≤ 0.001. Due to the much larger number of peat samples (n = 300) compared to plant samples (n = 39), the clusters of points in d roughly correspond to those in b. The depth, latitude, and temperature vectors in d are based only on the peat samples. Carbohydrates_est; estimated % carbohydrates (as shown in Fig. 2a), aromatics_est; estimated % aromatics (as shown in Fig. 2b), aliphatic_rel_abund; aliphatic relative abundance (as shown in Supplementary Fig. 3a), temperature; mean annual temperature (°C), latitude; latitude (°N), and depth; depth below peat surface (cm)
Fig. 5
Fig. 5
Comparisons of plant and surface peat chemistry across the latitudinal transect. Each plot shows estimated a carbohydrate or b aromatic contents in dominant plant types at each site category (green), peat from ≤50 cm at each site category (brown), and the difference (peat – plants) (yellow). For peat samples, Boreal Bogs includes MN Bogs and Mer Bleue, and Boreal Fens includes MN Fens. Error bars represent standard deviations (1 SD) of the measured samples (shown individually as points), and do not account for uncertainty in species composition of peat-forming plants. Significance of differences between plants and peat (unpaired t test) are indicated with asterisks: *p ≤ 0.05; **p ≤ 0.01; ***p ≤ 0.001; ****p ≤ 0.0001; NS = not significant; N/A = significance could not be determined due to n = 1. Numbers of plant samples (Supplementary Table 3): Stordalen, n = 13; Boreal Bogs, n = 3; Boreal Fens, n = 8; NC Pocosin, n = 6; Loxahatchee, n = 1; and Mendaram, n = 8. Numbers of peat samples (Supplementary Table 2): Stordalen, n = 5; Boreal Bogs, n = 35; Boreal Fens, n = 7; NC Pocosin, n = 12; Loxahatchee, n = 22; and Mendaram, n = 6
Fig. 6
Fig. 6
Peat radiocarbon ages in selected sites. Ages are calibrated to calendar years before present (BP). Radiocarbon ages for sites CPP, DNL deep, and Lox3 are from this study, and ages for the other sites are from the literature (references in Methods). Each point represents the median and asymmetrical 95.4% confidence interval (2σ) of the calibrated age estimates (see Methods). Error bars not visible are within the symbols

References

    1. Yu Z, Loisel J, Brosseau DP, Beilman DW, Hunt SJ. Global peatland dynamics since the Last Glacial Maximum. Geophys. Res. Lett. 2010;37:L13402.
    1. Page SE, Rieley JO, Banks CJ. Global and regional importance of the tropical peatland carbon pool. Glob. Change Biol. 2011;17:798–818. doi: 10.1111/j.1365-2486.2010.02279.x. - DOI
    1. Dommain R, Couwenberg J, Glaser PH, Joosten H, Suryadiputra INN. Carbon storage and release in Indonesian peatlands since the last deglaciation. Quat. Sci. Rev. 2014;97:1–32. doi: 10.1016/j.quascirev.2014.05.002. - DOI
    1. Dargie GC, et al. Age, extent and carbon storage of the central Congo Basin peatland complex. Nature. 2017;542:86–90. doi: 10.1038/nature21048. - DOI - PubMed
    1. Clymo RS. The limits to peat bog growth. Philos. Trans. R. Soc. Lond. Ser. B. 1984;303:605–654. doi: 10.1098/rstb.1984.0002. - DOI

Publication types

LinkOut - more resources