. 2018 Sep 7;9(1):3642.
doi: 10.1038/s41467-018-05920-z.

Liquid-state quantitative SERS analyzer on self-ordered metal liquid-like plasmonic arrays

Affiliations

Liquid-state quantitative SERS analyzer on self-ordered metal liquid-like plasmonic arrays

Li Tian et al. Nat Commun. .

Abstract

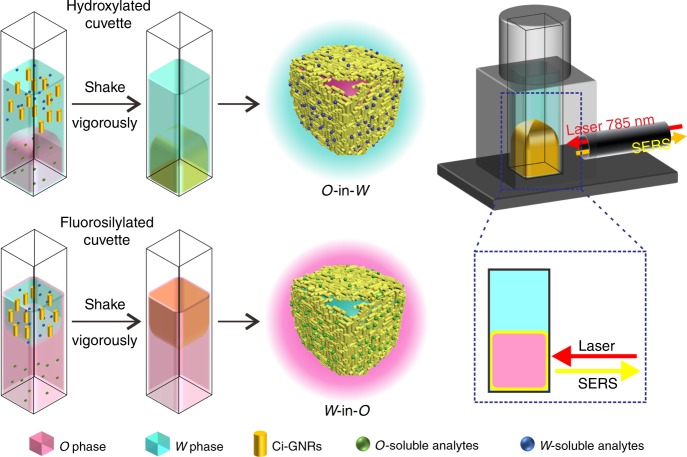
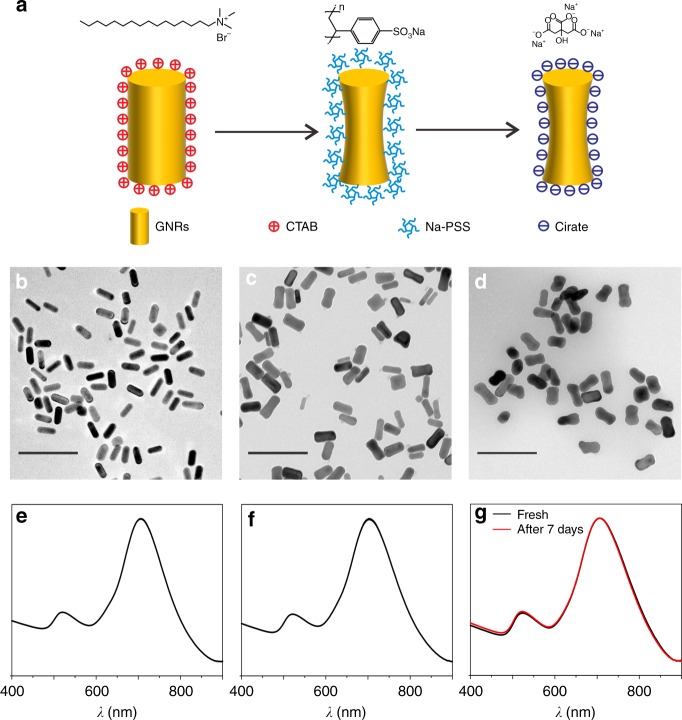
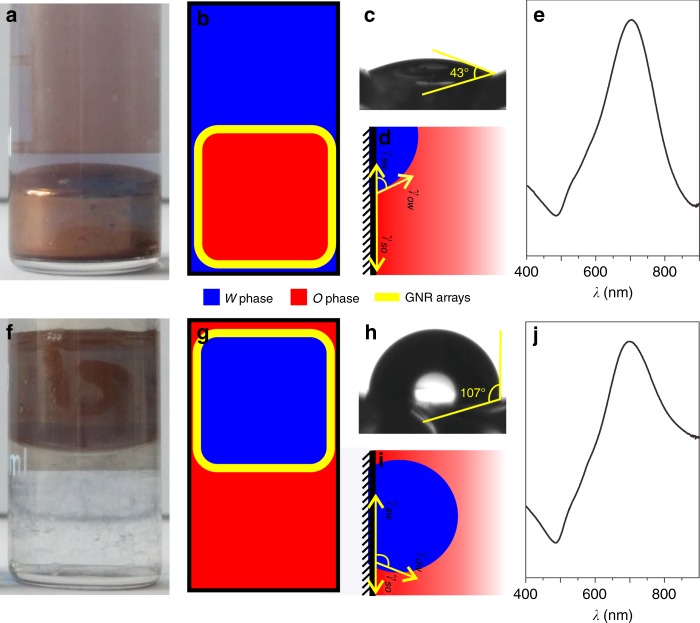
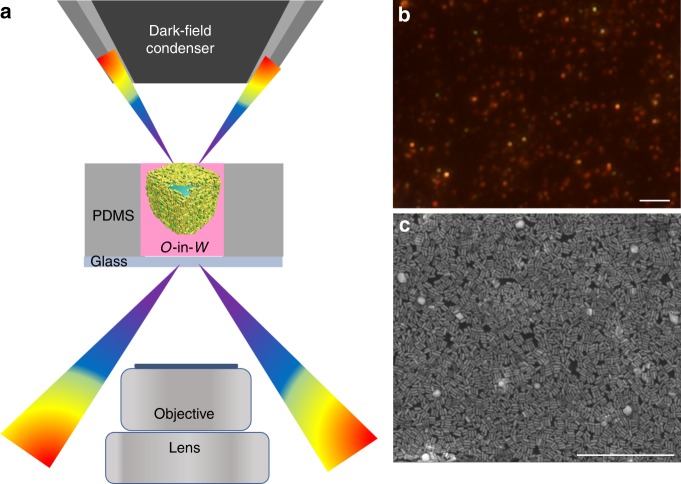
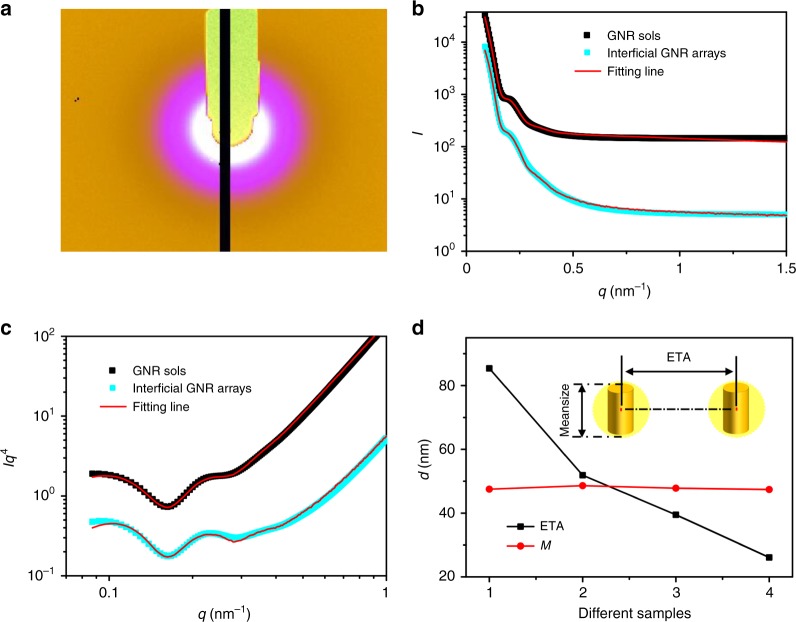
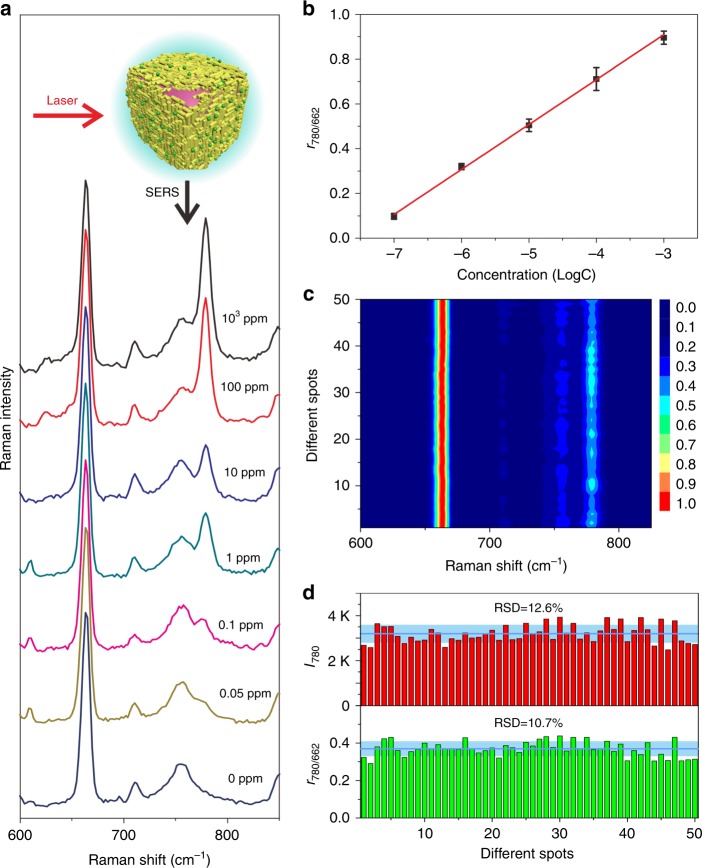
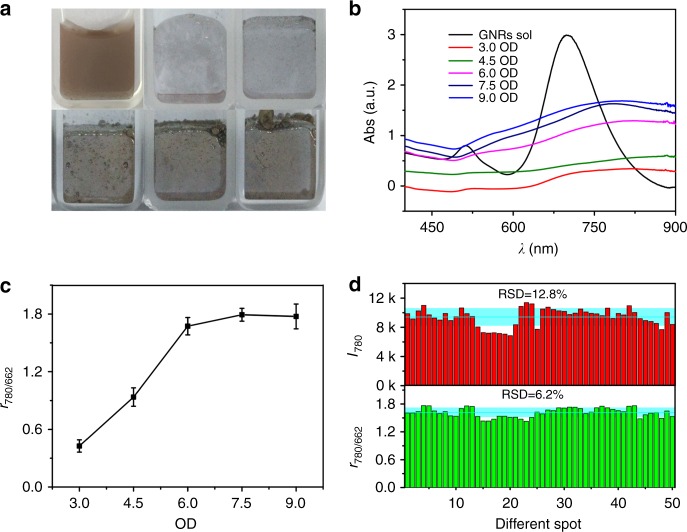
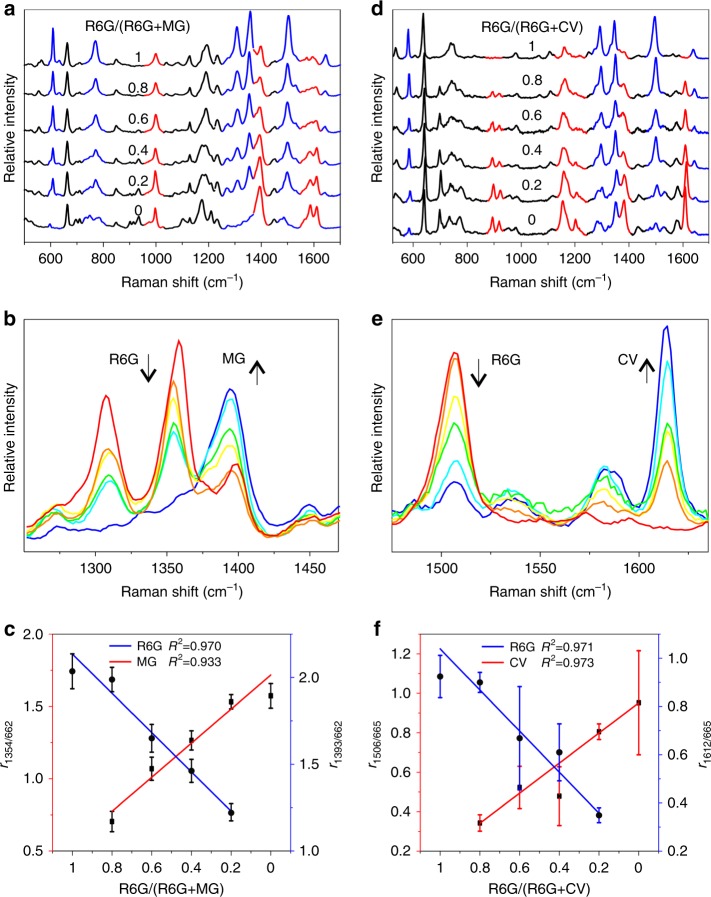
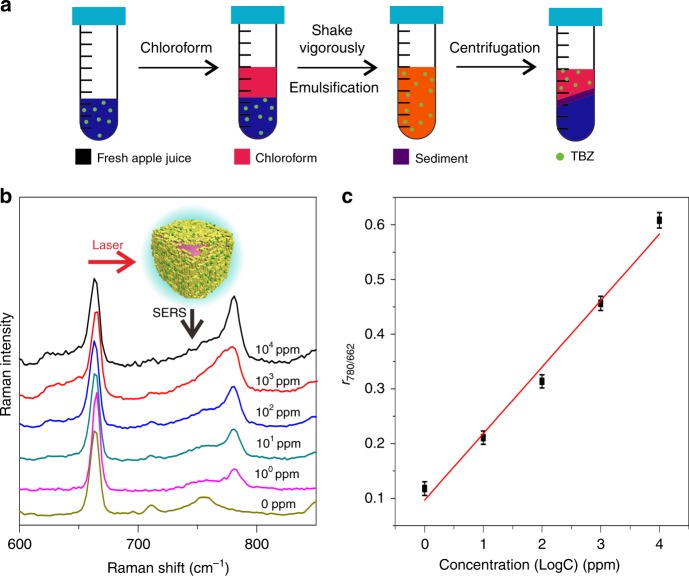
Liquid interfacial plasmonic platform is emerging for new sensors, catalysis, and tunable optical devices, but also promises an alternative for practical applications of surface-enhanced Raman spectroscopy (SERS). Here we show that vigorous mixing of chloroform with citrate-capped gold nanorod sols triggers the rapid self-assembly of three-dimensional plasmonic arrays at the chloroform/water (O/W) interface and produces a self-healing metal liquid-like brilliant golden droplet. The O phase itself generates stable SERS fingerprints and is a good homogeneous internal standard for quantitative analysis. This platform presents reversible O/W encasing in a common cuvette determined just by surface wettability of the container. Both O-in-W and W-in-O platforms exhibit excellent SERS sensitivity and reproducibility for different analytes by the use of a portable Raman device. It paves the way toward a practical and quantitative liquid-state SERS analyzer, likened to a simple UV-Vis spectrometer, that is far superior to typical solid substrate-based or nanoparticle sol-based analysis.


Conflict of interest statement

The authors declare no competing interests.

Figures

Fig. 1
Fig. 1
A multiphase liquid-state SERS analyzer. Reversible O/W encasing for self-assembly of metal liquid-like GNR arrays is realized in a common cuvette. Detailed experimental setups are shown in Supplementary Fig. 1
Fig. 2
Fig. 2
GNR surface modification. a Schematic illustration of the PSS-mediated surface modification from CTAB to citrate. TEM observations and the corresponding UV–Vis absorbance spectra of the as-prepared Ct-GNR sols (b, e), Pss-GNRs sols (c, f), and Ci-GNR sols (d, g). A UV–Vis spectrum of the Ci-GNR sols aged for 1 week (red line) was overlapped in g for contrast. All of the scale bars are 200 nm
Fig. 3
Fig. 3
Metal liquid-like self-ordered GNR arrays. a Optical image and b schematic of O-in-W encasing, c the corresponding water contact angle test, and d the hypothesized coexistence of S/O/W triple-phase boundary in a hydroxylated cuvette. f Optical image and g schematic of W-in-O encasing, h the corresponding water contact angle test, and i the hypothesized coexistence of S/O/W triple-phase boundary in fluorosilylated cuvette. e, j UV–Vis absorbance spectra of GNR arrays on O-in-W and W-in-O interfaces, respectively
Fig. 4
Fig. 4
Interfacial morphology of GNR arrays. a Dark-field imaging setup for metal liquid-like O-in-W GNR arrays in PDMS cavity. b DFM image of interfacial GNRs at 0.6 OD of 1 mL sols. The scale bar is 4 μm. c SEM image of close-packed GNR film dried on silicon wafer fabricated from 1 mL of 7 OD GNR sols. The scale bar is 1 μm
Fig. 5
Fig. 5
SR-SAXS examinations on interfacial structures of GNR arrays. a A typical 2D SR-SAXS pattern. b 1D SR-SAXS scattering data and fitting lines of GNR sols and interfacial GNR arrays, respectively, plotted as SR-SAXS intensity (I) vs. scattering vector modulus (q). c Transformed SR-SAXS curves in b, plotted as q4×I vs. q. d Calculated average scattering size (M) and center-to-center distance (ETA) of GNRs from different samples: 1, as-synthesized GNR sols of 3.0 OD; 2–4, interfacial arrays fabricated by GNR sols with varied OD values: 3.0, 6.0, and 9.0, respectively
Fig. 6
Fig. 6
Metal liquid-like GNR arrays on O-in-W interface for SERS analysis of TBZ. a SERS spectra of TBZ with concentrations of 0, 0.05, 0.1, 1, 10, 100, and 1000 ppm, respectively, dissolved in the O phase. b A linear relationship between the r780/662 values and logarithmic TBZ concentration. c Fifty random runs in triplicate SERS experiments generating a 2D spectral mapping of 10 ppm TBZ. d Statistical histograms of r780/662 and I780 values, respectively. The error bars represent the statistical RSD and were calculated from five different runs
Fig. 7
Fig. 7
Effect of GNR concentrations on SERS performance. a Optical images of as-synthesized GNR sols and metal liquid-like GNR arrays on O-in-W interface fabricated by 1 mL of GNR sols with variable OD values: 3.0, 4.5, 6.0, 7.5, and 9.0, respectively. b The corresponding UV–Vis absorbance spectra, c relative SERS strength, r780/662, collected on interfacial GNR arrays, and d statistical histograms of r780/662 and I780, respectively. The error bars represent the statistical RSD and were calculated from triplicate SERS experiments
Fig. 8
Fig. 8
A quantitative liquid-state SERS platform. a Multiphase analysis of MG dissolved in the W phase and R6G dissolved in the O phase. b Detailed spectral variations of the 1354 cm−1 band assigned to R6G and the 1393 cm−1 band assigned to MG in multiphase analysis. c The linear relationships between the R6G/MG molar ratios and the r values of MG (red) and R6G (blue), respectively. d Multiplex analysis of R6G and CV simultaneously dissolved in the O phase. e Detailed spectral variations of the 1506 cm−1 band assigned to RG and the 1612 cm−1 band assigned to CV in multiplex analysis. f The linear relationships between the R6G/CV molar ratios and the r values of CV (red) and R6G (blue), respectively. Total number of molecules in each experiment was 0.1 nmol, and the molar ratio was labeled on each spectrum. The error bars represent the statistical RSD and were calculated from triplicate SERS experiments
Fig. 9
Fig. 9
Quantitative SERS analysis of TBZ in fresh juice. a Schematic for separating and concentrating of TBZ from fresh apple juice. b SERS spectra of TBZ with concentrations of 100, 101, 102, 103, and 104 ppm, respectively. c A linear plot of r780/662 against logarithmic concentration of TBZ. The error bars represent the statistical RSD and were calculated from triplicate SERS experiments

References

    1. Li JF, et al. Shell-isolated nanoparticle-enhanced Raman spectroscopy. Nature. 2010;464:392–395. doi: 10.1038/nature08907. - DOI - PubMed
    1. Jiang YF, Sun DW, Pu HB, Wei QY. Surface enhanced Raman spectroscopy (SERS): a novel reliable technique for rapid detection of common harmful chemical residues. Trend Food Sci. Technol. 2018;75:10–22. doi: 10.1016/j.tifs.2018.02.020. - DOI
    1. Nie SM, Emery SR. Probing single molecules and single nanoparticles by surface-enhanced Raman scattering. Science. 1997;275:1102–1106. doi: 10.1126/science.275.5303.1102. - DOI - PubMed
    1. Ding SY, et al. Nanostructure-based plasmon-enhanced Raman spectroscopy for surface analysis of materials. Nat. Rev. Mater. 2016;1:16. doi: 10.1038/natrevmats.2016.21. - DOI
    1. Chen HJ, Shao L, Li Q, Wang JF. Gold nanorods and their plasmonic properties. Chem. Soc. Rev. 2013;42:2679–2724. doi: 10.1039/C2CS35367A. - DOI - PubMed

Publication types