. 2018 Sep 7;8(1):13455.
doi: 10.1038/s41598-018-31640-x.

Cell type-resolved human lung lipidome reveals cellular cooperation in lung function

Affiliations

Cell type-resolved human lung lipidome reveals cellular cooperation in lung function

Jennifer E Kyle et al. Sci Rep. .

Abstract

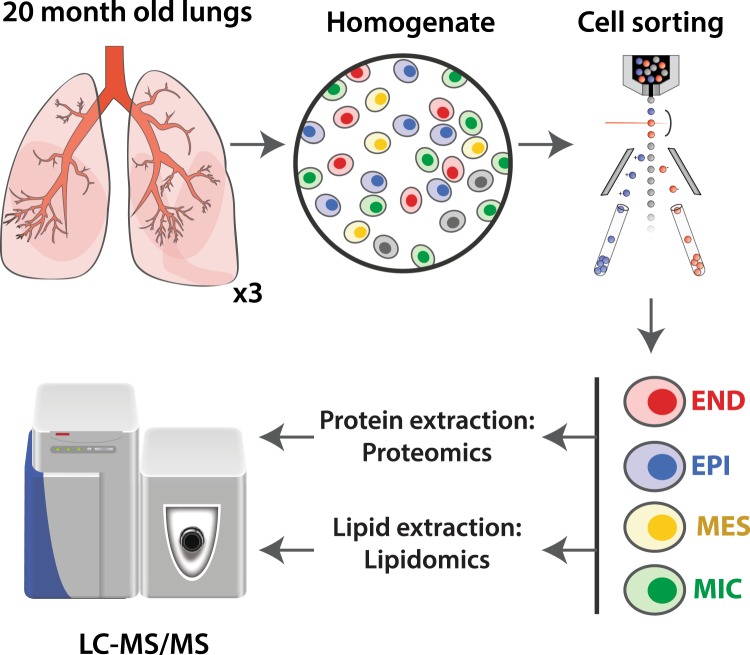
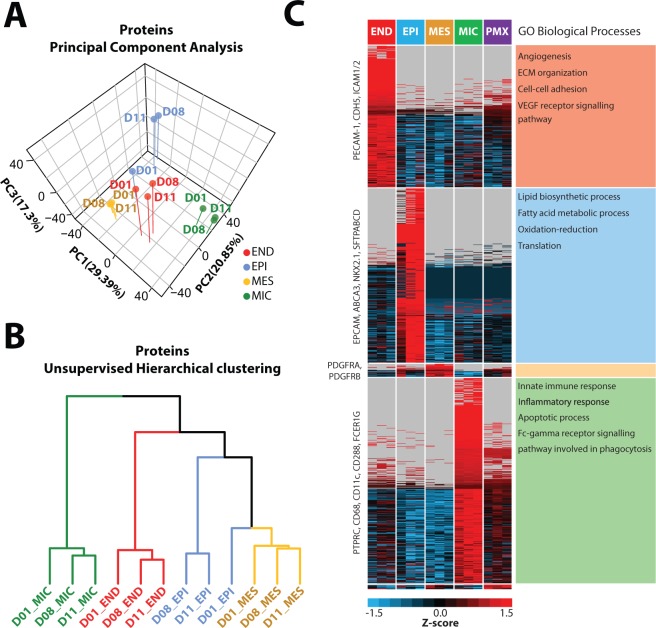
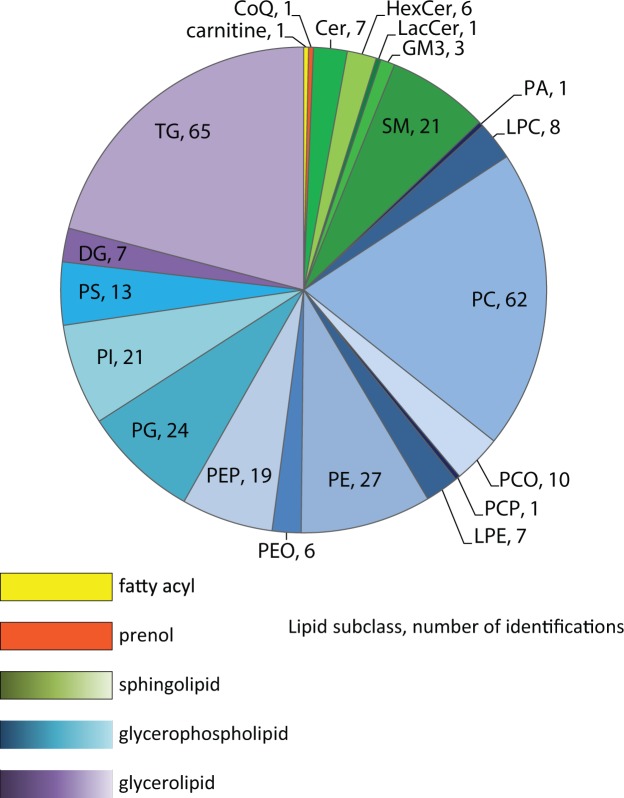
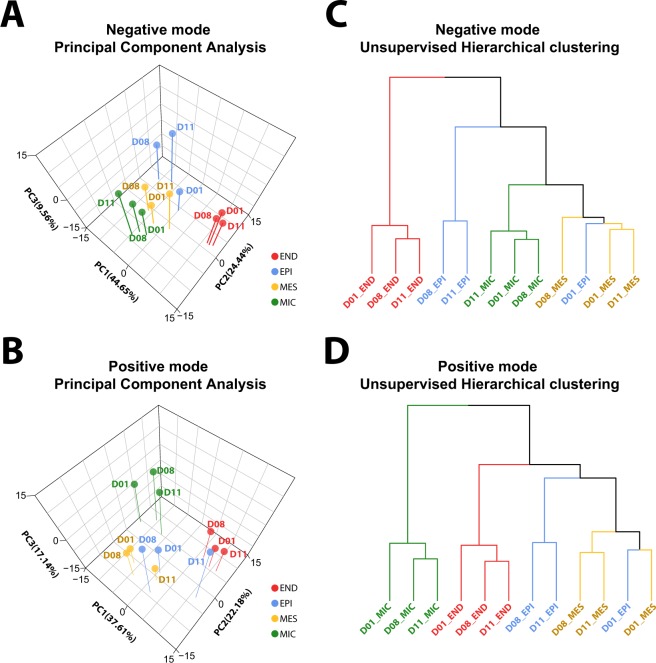
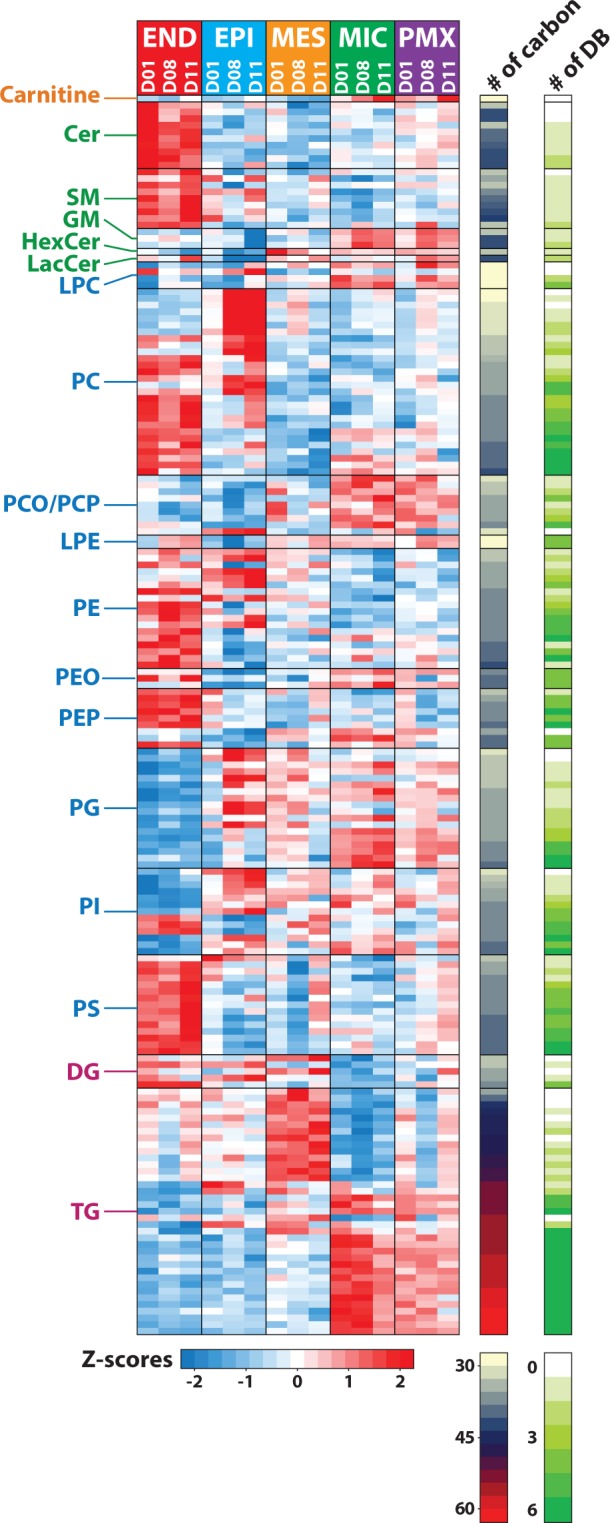
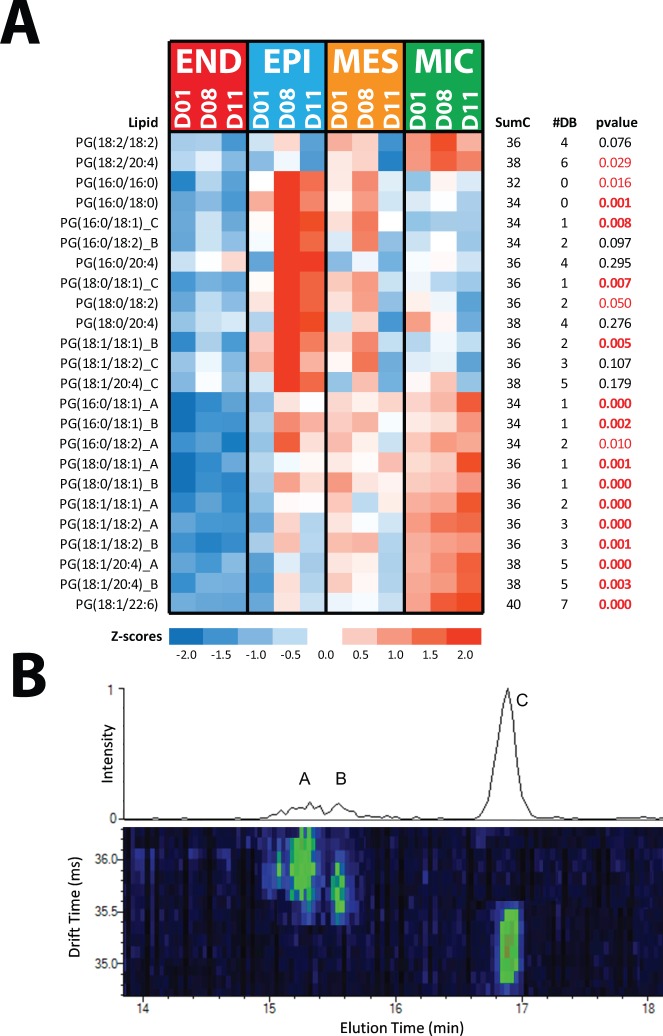
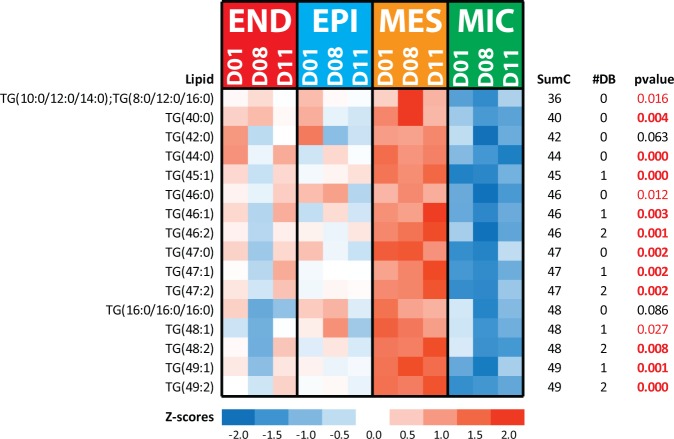
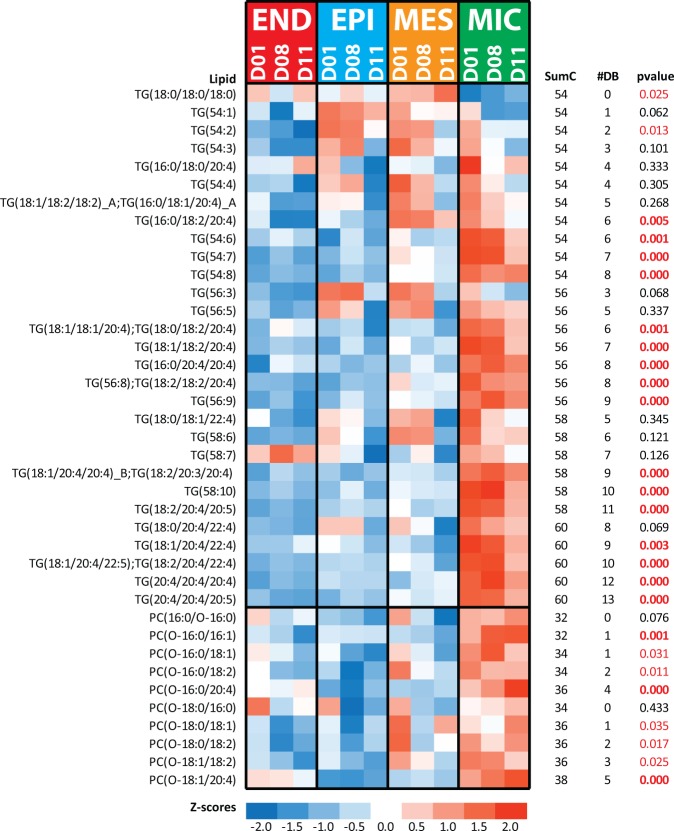
Cell type-resolved proteome analyses of the brain, heart and liver have been reported, however a similar effort on the lipidome is currently lacking. Here we applied liquid chromatography-tandem mass spectrometry to characterize the lipidome of major lung cell types isolated from human donors, representing the first lipidome map of any organ. We coupled this with cell type-resolved proteomics of the same samples (available at Lungmap.net). Complementary proteomics analyses substantiated the functional identity of the isolated cells. Lipidomics analyses showed significant variations in the lipidome across major human lung cell types, with differences most evident at the subclass and intra-subclass (i.e. total carbon length of the fatty acid chains) level. Further, lipidomic signatures revealed an overarching posture of high cellular cooperation within the human lung to support critical functions. Our complementary cell type-resolved lipid and protein datasets serve as a rich resource for analyses of human lung function.


Conflict of interest statement

The authors declare no competing interests.

Figures

Figure 1
Figure 1
Lipidomic and proteomic analysis of lung cell types. Schematic workflow for the cell-type-resolved lipidomics and proteomics of human lung.
Figure 2
Figure 2
Principle component analysis (A) and hierarchical clustering (B) of cell type-resolved proteomics data from three donors (D01, D08, D11). (C) Heatmap of proteins differential across four cell types isolated from donors. Data shows a high degree of similarity between cell types for all three donors. Known markers indicated within cell-specific clusters. Annotation enrichment analysis highlights physiological role of cells.
Figure 3
Figure 3
Distribution of lipids identified in cell-type resolved human lung. Total of 311 unique lipids identified across 5 lipid categories, including fatty acyls (yellow), prenol (orange), sphingolipids (greens), glycerophospholipid (blues), and glycerolipid (purples), and 21 subclasses. CoQ10 = coenzyme Q10; Cer = ceramide; HexCer = glucosyl- or galactosylceramide; LacCer = lactosylceramide; GM3 = ganglioside; SM = sphingomyelin; PA = diacylglycerophosphate; LPC = monoacylglycerophosphocholine; PC = diacylglycerophosphocholine, PCO = ether PC; PCP = plasmalogen PC; LPE monoacylglycero-phosphoethanolamine; PE = diacylglycerophosphoethanolmine; PEO = ether PE; PEP = plasmalogen PE; PG = diacylglycerophosphoglycerol OR bis(monoacylglycerol)phosphate; PI = diacylglycerophosphoinositol; PS = diacylglycerophosphoserine; DG = diacylglyceride; TG = triacylglyceride. Values beside each subclass annotation represents the number of lipids identified in that particular subclass.
Figure 4
Figure 4
Molecular similarity within cell types. Principle component analysis (PCA) and hierarchical clustering (HC) of cell type-resolved lipidomics data collected in negative (A) and positive (B) ionization modes from three donors (D01, D08, D11). Data shows a high degree of similarity within the cell types with the exception of D01 EPI, which appears more similar to the MES cells in the lipidome.
Figure 5
Figure 5
Lipid subclass and intra-subclass profiles across the four cell types. Heatmap visualization of statistically significant (p-values < 0.05) lipidome of sorted END (endothelial), EPI (epithelial), MES (mesenchymal), and immune (MIC) cells and unsorted control cells (PMX) for the three donor (D01, D08, D11) human lung samples. Data in the heatmap is z-scored and sorted at the subclass level based on the total hydrocarbon chain length and then the total of double bonds in hydrocarbon chains. CoQ10 = coenzyme Q10; Cer = ceramide, SM = sphingomyelin; GM3 = ganglioside; HexCer = glucosyl- or galactosylceramide; LacCer = lactosylceramide; PA = diacylglycerophosphate; LPC = monoacylglycerophosphocholine; PC = diacylglycerophosphocholine, PCOP = ether (O) and plasmalogen (P) PC; LPE monoacylglycerophosphoethanolamine; PE = diacylglycerophosphoethanolmine; PEO = ether PE; PEP = plasmalogen PE; PG = diacylglycerophosphoglycerol OR bis(monoacylglycerol)phosphate; PI = diacylglycerophosphoinositol; PS = diacylglycerophosphoserine; DG = diacylglyceride; TG = triacylglyceride.
Figure 6
Figure 6
LC-IMS-MS distinguishes PG from bis(monoacylglycerol)phosphate (BMP). (A) Heatmap of identified PG lipids. Data in the heatmap is z-scored. SumC represents the total number of carbons in the fatty acids chains, and #DB represents the total number of double bonds in the fatty acids chains. The p-values highlighted red are statistically significant (≤0.05) and in red bold text for those with p-values ≤ 0.01. (B) Representative LC_IMS-MS analysis of EPI shows three isomers of PG(16:0_18:1) noted as A, B, and C. In the IMS analyses, the structural sizes were found to be in the order of A>B>C, where A was only slightly bigger than B, but both were quite a bit larger than C (see drift time separation). Previously observed BMP were found to be larger than PG (Kyle et al.), illustrating that A and B are likely BMP isomers. In the LC separation, A and B eluted very close together and ~1.5 minutes earlier than C also fitting the LC elution time differences between BMP and PG. A PG(16:0_18:1) standard was evaluated and found to match the elution time of C. Taken together, the above observations indicate that A and B, the isomers enriched in MIC cells, are BMP isomers, and identifies the main isomer in EPI cells, C, as PG(16:0_18:1) the primary PG surfactant lipid.
Figure 7
Figure 7
Heatmap of TG lipids elevated in MES cells. Data in the heatmap is z-scored. SumC represents the total number of carbons in the fatty acids chains, and #DB represents the total number of double bonds in the fatty acids chains. The p-values highlighted red are statistically significant (p-value ≤ 0.05) and in red bold text for those with p-values ≤ 0.01. Note the elevated TG lipids have low sumC and #DB in the MES when compared to MIC cells (Fig. 8).
Figure 8
Figure 8
Heatmap of TG and PCO lipids elevated in the MIC cells. Data in the heatmap is z-scored. SumC represents the total number of carbons in the fatty acids chains, and #DB represents the total number of double bonds in the fatty acids chains. The p-values highlighted red are statistically significant (p-value ≤ 0.05) and in red bold text for those with p-values ≤ 0.01. Note the elevated TG lipids have higher sumC and #DB in the MIC when compared to the MES (Fig. 7).

References

    1. Sharma K, et al. Cell type- and brain region-resolved mouse brain proteome. Nature neuroscience. 2015;18:1819–1831. doi: 10.1038/nn.4160. - DOI - PMC - PubMed
    1. Azimifar SB, Nagaraj N, Cox J, Mann M. Cell-type-resolved quantitative proteomics of murine liver. Cell metabolism. 2014;20:1076–1087. doi: 10.1016/j.cmet.2014.11.002. - DOI - PubMed
    1. Doll, S. et al. Region and cell-type resolved quantitative proteomic map of the human heart. 8, 1469, 10.1038/s41467-017-01747-2 (2017). - PMC - PubMed
    1. Beauchemin KJ, et al. Temporal dynamics of the developing lung transcriptome in three common inbred strains of laboratory mice reveals multiple stages of postnatal alveolar development. PeerJ. 2016;4:e2318. doi: 10.7717/peerj.2318. - DOI - PMC - PubMed
    1. Clair G, et al. Spatially-ResolvedProteomics: Rapid Quantitative Analysis of Laser Capture Microdissected Alveolar Tissue Samples. Scientific reports. 2016;6:39223. doi: 10.1038/srep39223. - DOI - PMC - PubMed

Publication types

LinkOut - more resources