. 2018 Sep 7;8(1):13460.
doi: 10.1038/s41598-018-31824-5.

Projected amplification of food web bioaccumulation of MeHg and PCBs under climate change in the Northeastern Pacific

Affiliations

Projected amplification of food web bioaccumulation of MeHg and PCBs under climate change in the Northeastern Pacific

Juan José Alava et al. Sci Rep. .

Abstract

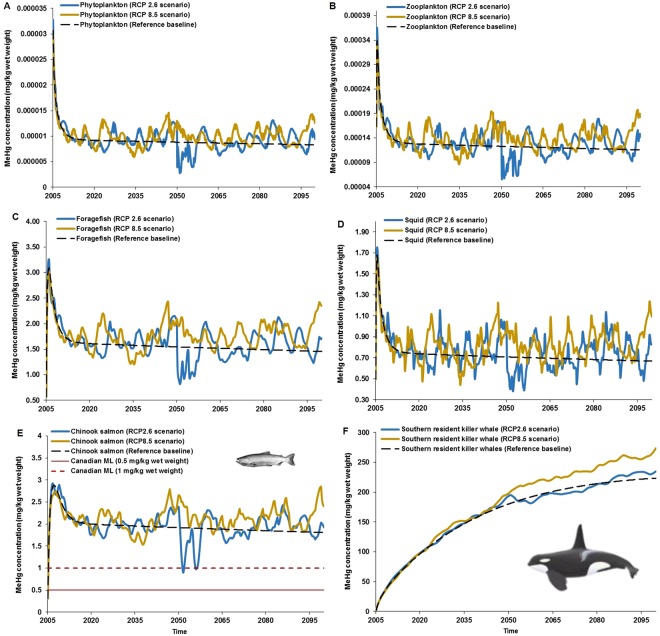
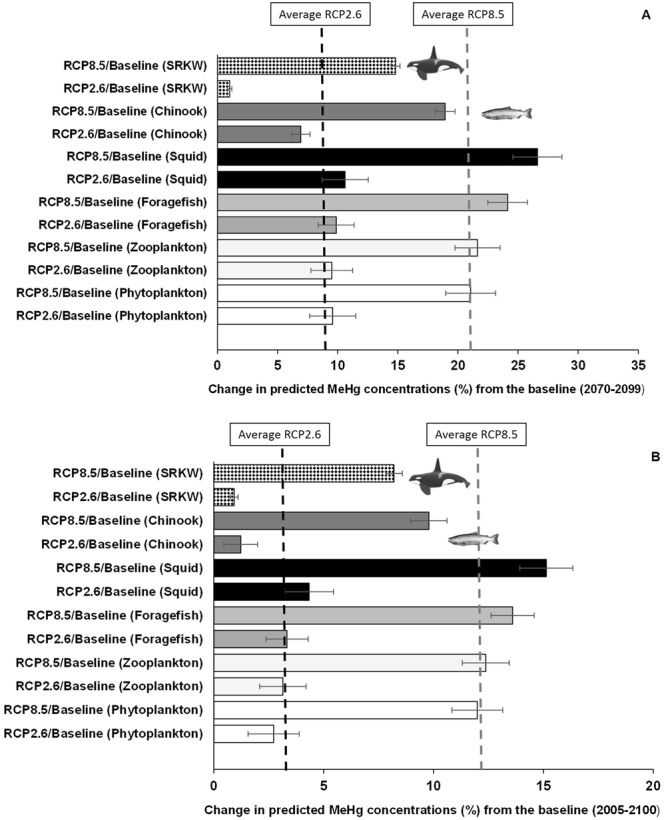
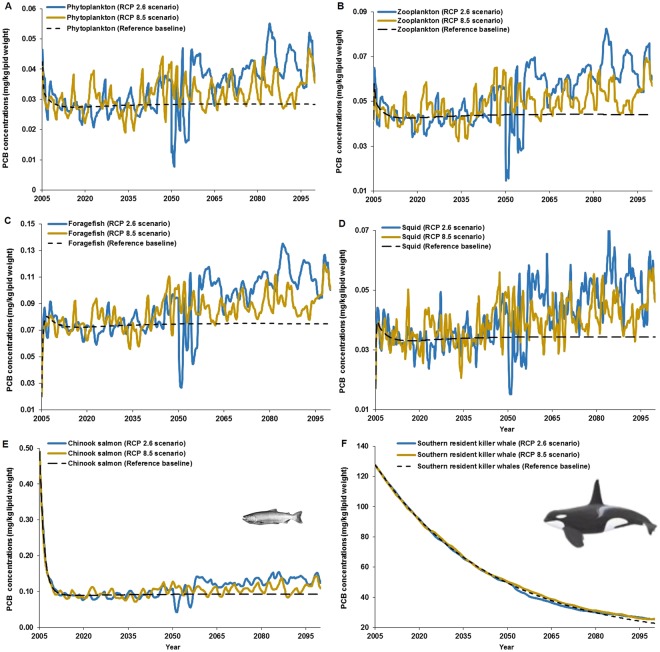
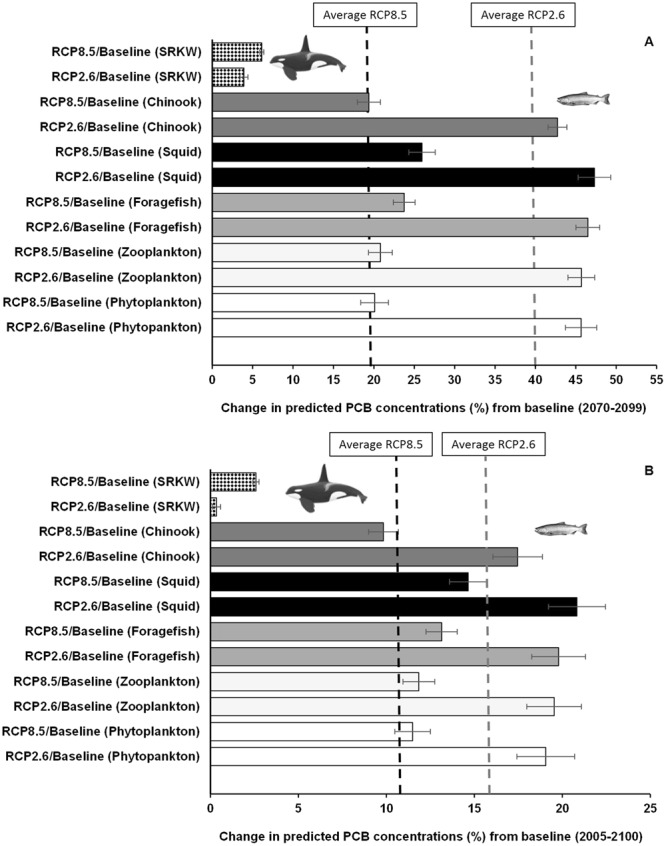
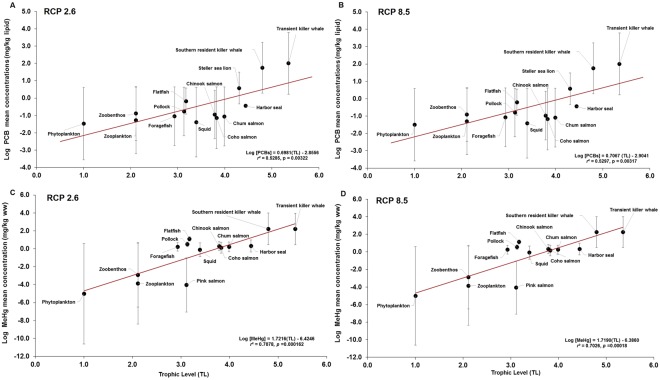
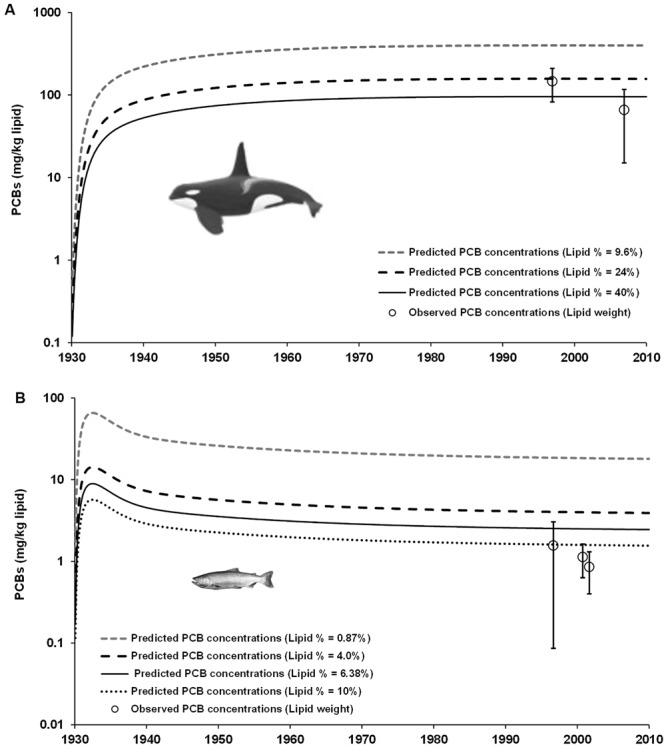
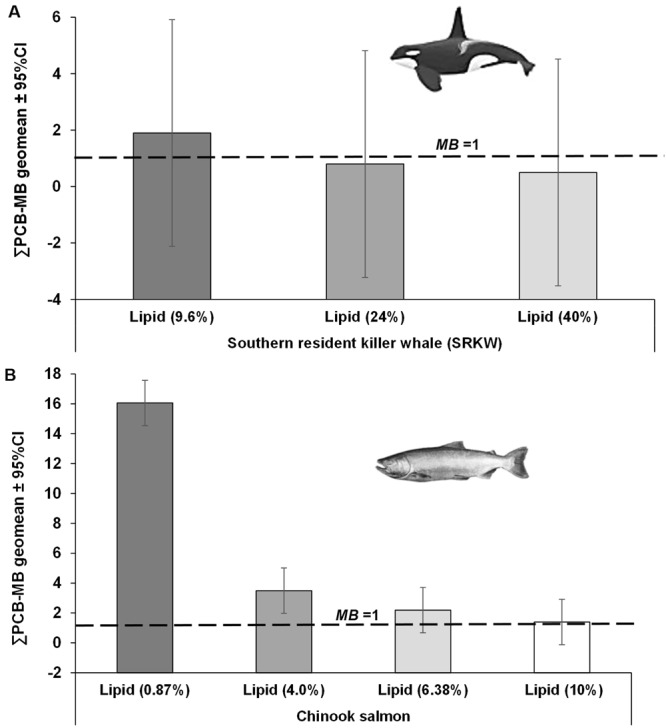
Climate change increases exposure and bioaccumulation of pollutants in marine organisms, posing substantial ecophysiological and ecotoxicological risks. Here, we applied a trophodynamic ecosystem model to examine the bioaccumulation of organic mercury (MeHg) and polychlorinated biphenyls (PCBs) in a Northeastern Pacific marine food web under climate change. We found largely heterogeneous sensitivity in climate-pollution impacts between chemicals and trophic groups. Concentration of MeHg and PCBs in top predators, including resident killer whales, is projected to be amplified by 8 and 3%, respectively, by 2100 under a high carbon emission scenario (Representative Concentration Pathway 8.5) relative to a no-climate change control scenario. However, the level of amplification increases with higher carbon emission scenario for MeHg, but decreases for PCBs. Such idiosyncratic responses are shaped by the differences in bioaccumulation pathways between MeHg and PCBs, and the modifications of food web dynamics between different levels of climate change. Climate-induced pollutant amplification in mid-trophic level predators (Chinook salmon) are projected to be higher (~10%) than killer whales. Overall, the predicted trophic magnification factor is ten-fold higher in MeHg than in PCBs under high CO2 emissions. This contribution highlights the importance of understanding the interactions with anthropogenic organic pollutants in assessing climate risks on marine ecosystems.


Conflict of interest statement

The authors declare no competing interests.

Figures

Figure 1
Figure 1
Projections of MeHg concentrations in the Chinook salmon-southern resident killer whale food web of the Northeastern Pacific. Simulations are shown for (A) phytoplankton, (B) zooplankton, (C) foragefish (i.e. functional group that includes Pacific sardine, Sardinops sagax caeruleus; California/northern anchovy, Engraulis mordax; Pacific herring, Clupea pallasi; sand lance, Ammodytes hexapterus; eulachon, Thaleichthys pacificus; American shad, Alosa sapidissima; surf smelt, Hypomesus pretiosus; whitebait smelt, Allosmerus elongates), (D) squid (Loligo), (E) Chinook salmon and (F) southern resident killer whales under RCP 2.6 and 8.5 scenarios and the reference baseline/no-climate change control scenario (black dashed line). For the MeHg predictions in Chinook salmon (panel E), the red solid and dashed lines represent the Canada’s maximum level (ML) mercury consumption limits of 0.5 mg/kg and 1.0 mg/kg wet weight, respectively. Public health implications concerning to the projected MeHg concentrations in salmon is available in the Supplementary Information.
Figure 2
Figure 2
Mean percentage change in MeHg concentrations projected in the food web from 2070 to 2099 (A) and for the entire simulation period (2005–2099) (B). Bars represent the mean ± 95% CI of changes under RCP 2.6 and RCP 8.5 scenarios relative to the reference baseline (i.e. no-climate change control) for phytoplankton, zooplankton, foragefish, squid, Chinook salmon and southern resident killer whales (SRKW). The black and grey dashed lines represent the average MeHg concentrations from 2070–2099 and from 2005–2099 under the ‘business-as-usual’ (RCP 8.5) and ‘strong mitigation’ (RCP 2.6) scenarios, respectively.
Figure 3
Figure 3
Projections of PCB concentrations in the Chinook salmon-southern resident killer whale food web from the Northeastern Pacific. Simulations of scenarios are shown for (A) phytoplankton, (B) zooplankton, (C) foragefish (i.e. functional group that includes Pacific sardine, Sardinops sagax caeruleus; California/northern anchovy, Engraulis mordax; Pacific herring, Clupea pallasi; sand lance, Ammodytes hexapterus; eulachon, Thaleichthys pacificus; American shad, Alosa sapidissima; surf smelt, Hypomesus pretiosus; whitebait smelt, Allosmerus elongates), (D) squid, (E) Chinook salmon and (F) southern resident killer whales. Simulations were conducted with the EwE model and Ecotracer module under RCP 2.6 and 8.5 scenarios, and the reference baseline scenario (no climate change forcing control: black dashed line).
Figure 4
Figure 4
Mean percentage change in PCB concentrations projected in the food web from 2070 to 2099 (A) and for the entire simulation period (2005–2099). (B) Bars represent the mean ± 95% CI of changes under RCP 2.6 and RCP 8.5 scenarios relative to the reference baseline (i.e. no-climate change control) for phytoplankton, zooplankton, foragefish, squid, Chinook salmon and southern resident killer whales (SRKW). The black and grey dashed lines represent the average PCB concentrations from 2070–2099 and from 2005–2099 under the ‘business-as-usual’ (RCP 8.5) and ‘strong mitigation’ (RCP 2.6) scenarios, respectively.
Figure 5
Figure 5
Relationships between the logarithm (log10) of projected contaminant concentrations, simulated under RCP 2.6 and RCP 8.5 scenarios, and trophic level (TL) throughout the entire simulation period in the marine food web. (A) log PCBs vs TL under RCP 2.6; (B) log PCBs vs TL under RCP 8.5; (C) log MeHg vs TL under RCP 2.6; and, (D) log MeHg vs TL under RCP 8.5. Data points (solid circles) represent the overall log average ± log SD (error bars) concentrations calculated for the entire simulation period (2005–2100). For reference purposes, PCB data predicted for harbor seals (Phoca vitulina), Steller sea lions (Eumetopias jubatus), and transient killer whales (O. orca) are also included as reference data points. The apparent trophic magnification factor (TMF) was calculated from the slopes of the relationships (see Table S6 in Supplementary Information).
Figure 6
Figure 6
Historical projections of PCB concentrations (mg/kg lipid) in southern resident killer whales (SRKW) (A) and Chinook salmon (B) simulated with the Ecotracer routine of the EwE model and adjusted to different values of lipid content (%). Projected PCB concentrations of PCBs lipid normalized to relatively normal values of lipid content reproduce concentrations close to empirical data observed in both species, as reported elsewhere. The open circles are the average PCB concentration observed in SRKW and Chinook salmon and error bars are 95% CI. By normalizing the PCB concentrations to low lipid fractions observed in killer whales (i.e. lipid content = 9.6%) and Chinook salmons (i.e. lipid content = 0.87%), the concentrations of PCBs are amplified in these species as an indication of a bioamplification process.
Figure 7
Figure 7
Geometric mean of the model bias (MB) of total PCBs (ΣPCB) for southern resident killer whale (SRKW) (A) and Chinook salmon (B). The error bars are 95% confidence intervals as indication of the uncertainty of model predictions. Lipid content for SRKW and Chinook salmon were retrieved from data reported elsewhere. Dashed line means MB = 1.0 (i.e., equal concentration values when comparing projected to observed data).

References

    1. Alava JJ, Cheung WWL, Ross PS, Sumaila RU. Climate change-contaminant interactions in marine food webs: Towards a conceptual framework. Glob. Change Biol. 2017;23:3984–4001. doi: 10.1111/gcb.13667. - DOI - PubMed
    1. United Nations Environmental Programme. Protecting the environment from Persistent Organic Pollutants and other persistent toxic substances. UNEP’s Action in the Framework of the Global Environment Facility (UNEP 2002).
    1. United Nations Environmental Programme. Global Mercury Assessment2013: Sources, Emissions, Releases and Environmental Transport. UNEP Chemicals Branch, (UNEP 2013).
    1. Krabbenhoft DP, Sunderland EM. Global change and mercury. Science. 2013;341:1457–1458. doi: 10.1126/science.1242838. - DOI - PubMed
    1. Nikinmaa M. Climate change and ocean acidification-Interactions with aquatic toxicology. Aquat. Toxicol. 2013;126:365–372. doi: 10.1016/j.aquatox.2012.09.006. - DOI - PubMed

Publication types

Substances