. 2018 Nov;596(22):5397-5414.
doi: 10.1113/JP275824. Epub 2018 Oct 14.

Sodium and potassium conductances in principal neurons of the mouse piriform cortex: a quantitative description

Affiliations

Sodium and potassium conductances in principal neurons of the mouse piriform cortex: a quantitative description

Kaori Ikeda et al. J Physiol. 2018 Nov.

Abstract

Key points: The primary olfactory (or piriform) cortex is a promising model system for understanding how the cerebral cortex processes sensory information, although an investigation of the piriform cortex is hindered by a lack of detailed information about the intrinsic electrical properties of its component neurons. In the present study, we quantify the properties of voltage-dependent sodium currents and voltage- and calcium-dependent potassium currents in two important classes of excitatory neurons in the main input layer of the piriform cortex. We identify several classes of these currents and show that their properties are similar to those found in better-studied cortical regions. Our detailed quantitative descriptions of these currents will be valuable to computational neuroscientists who aim to build models that explain how the piriform cortex encodes odours.

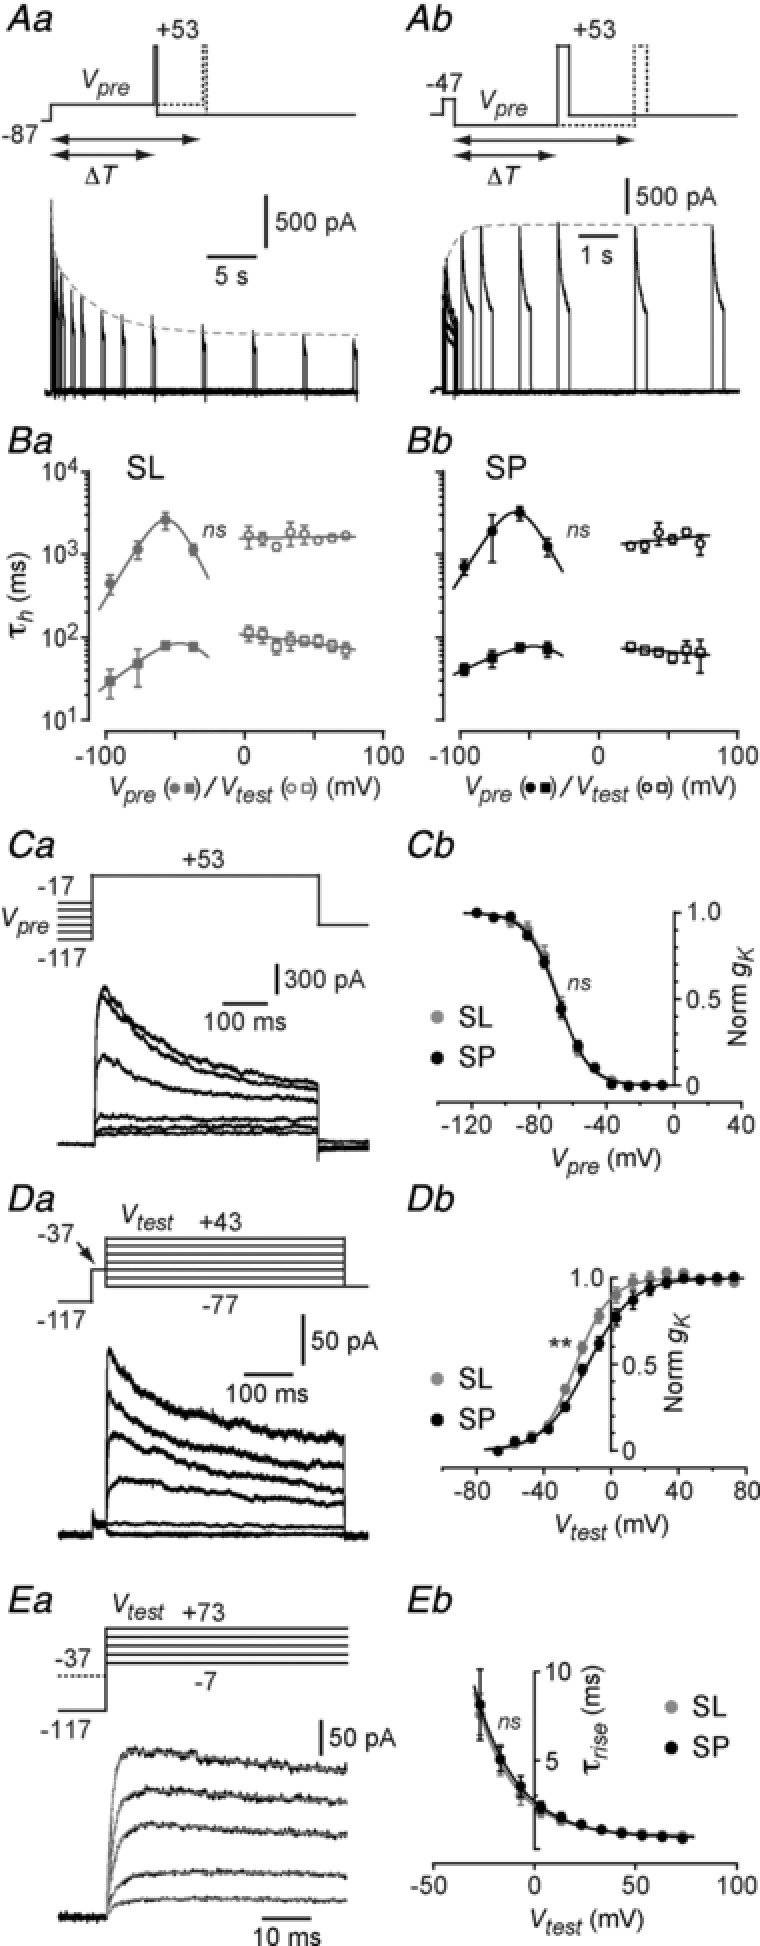
Abstract: The primary olfactory cortex (or piriform cortex, PC) is an anatomically simple palaeocortex that is increasingly used as a model system for investigating cortical sensory processing. However, little information is available on the intrinsic electrical conductances in neurons of the PC, hampering efforts to build realistic computational models of this cortex. In the present study, we used nucleated macropatches and whole-cell recordings to rigorously quantify the biophysical properties of voltage-gated sodium (NaV ), voltage-gated potassium (KV ) and calcium-activated potassium (KCa ) conductances in two major classes of glutamatergic neurons in layer 2 of the PC, semilunar (SL) cells and superficial pyramidal (SP) cells. We found that SL and SP cells both express a fast-inactivating NaV current, two types of KV current (A-type and delayed rectifier-type) and three types of KCa current (fast-, medium- and slow-afterhyperpolarization currents). The kinetic and voltage-dependent properties of the NaV and KV conductances were, with some exceptions, identical in SL and SP cells and similar to those found in neocortical pyramidal neurons. The KCa conductances were also similar across the different types of neurons. Our results are summarized in a series of empirical equations that should prove useful to computational neuroscientists seeking to model the PC. More broadly, our findings indicate that, at the level of single-cell electrical properties, this palaeocortex is not so different from the neocortex, vindicating efforts to use the PC as a model of cortical sensory processing in general.

Keywords: Hodgkin-Huxley analysis; olfactory cortex; patch clamp.


Figures

Figure 1
Figure 1. The two extreme types of glutamatergic principal neurons in layer 2 of the PC, SL cells and SP cells, differ in their dendritic morphology and electrical properties
A, tracing of the dendritic arbor of an SL cell (left) and an SP cell (right) in the anterior PC of a 20‐day‐old mouse. Approximate laminar boundaries are indicated. B, APs evoked by a 500 ms long current step, recorded from the SL cell (left column) and SP cell (right column) shown in (A). Top row, APs evoked by a step just above rheobase (SL: 99 pA; SP: 637 pA). For each cell, the region in the dashed box is expanded in the inset, showing the afterdepolarization that typifies SP cells (arrowhead, right inset). Bottom row, APs evoked by a strongly depolarizing current step (SL: 159 pA; SP: 1311 pA), showing the typical regular‐firing of the SL cell and the initial burst‐firing, followed by accommodation, of the SP cell.
Figure 2
Figure 2. Activation and inactivation properties of the transient voltage‐gated sodium current (I Na) measured in nucleated outside–out macropatches from the somas of SL and SP cells
Aa (top), protocol for measuring the kinetics of onset of inactivation of I Na. Membrane potential is stepped to a hyperpolarized potential (–96 mV) to partially remove inactivation, then held at a depolarized prepulse potential (V pre) for various times (ΔT) to favour inactivation, then stepped to a fixed test potential (–16 mV) to assess the fraction of channels not yet inactivated. Aa (bottom), typical I Na traces showing, superimposed, the responses to the test potential recorded after different times (ΔT = 0–25 ms, only a subset shown) at V pre = −66 mV (this is an SL cell). Potassium currents are blocked pharmacologically, and capacitive and linear leak currents are removed using an online leak subtraction protocol. Superimposed dashed grey curve is a single exponential fit with a time constant of 3.6 ms. Ab (top), similar protocol for measuring the kinetics of recovery from inactivation, with the difference being that the membrane potential is initially stepped to a depolarized potential (–26 mV) to inactivate I Na and V pre is more hyperpolarized to enable recovery. Ab (bottom), typical I Na responses to this protocol with V pre = −106 mV (SL cell). Superimposed dashed grey exponential has a time constant of 1.0 ms. B, summary plots of the mean ± SEM inactivation time constant (τh) vs. membrane potential for patches from n = 3–8 SL cells (Ba) and n = 4–8 SP cells (Bb). Filled symbols are from fits to inactivation recovery (circles) and onset (squares); open circles are from fits to the decay of I Na from an activation protocol (as in Ea). Superimposed smooth curves are empirical fits (Table 1). Ca, typical I Na steady‐state inactivation family (SP cell; pulse protocol shown at top; V pre is 30 ms long for all voltages). Cb, plots of the mean ± SEM normalized peak Na conductance (g Na) vs. inactivating prepulse potential (V pre) for SL cells (grey symbols, n = 10) and SP cells (black symbols, n = 9). Superimposed smooth curves are Boltzmann fits to the average data (Table 1). Da, typical I Na activation family (same SP cell as in Ca; pulse protocol at top; prepulse to −116 mV is 30 ms long). Db, plots of the mean ± SEM normalized g Na vs. amplitude of the test potential (V test; symbols as in Cb; SL: n = 11; SP: n = 9). Superimposed smooth curves are Boltzmann fits to the average data (Table 1). Ea, another I Na activation family from an SP cell showing fits of a Hodgkin–Huxley function (m 3 h; superimposed grey lines). Eb, plots of the mean ± SEM rise time constant (τrise) vs. V test, using the results of fits as in (Ea) (SL: n = 8; SP: n = 8). Superimposed smooth curves are Gaussian fits (Table 1). The averaged faster decay time constants (τh) from fits as in (Ea) are plotted in (Ba) and (Bb) (open circles). See text for details. ns, not significant; *0.01 ≤ P < 0.05.
Figure 3
Figure 3. A‐type (I A) and delayed rectifier‐type (I K) voltage‐activated potassium currents can be kinetically and pharmacologically distinguished in nucleated outside–out macropatches and whole‐cell recordings from SL and SP neurons
A, typical potassium current activation family recorded in a nucleated patch from an SP cell with no blockers in the external solution. Capacitive and linear leak currents have been subtracted and each trace is the average of four repetitions. Faster‐decaying (I A) and slower‐decaying (I K) outward currents are apparent. The brief inward transient at the beginning of the steps is I Na, and is not clearly seen on this time scale. B, current elicited in a nucleated patch by a step to +53 mV before (black trace) and after (grey trace) applying 5 mm 4‐AP in the external solution. Faster‐decaying I A is selectively blocked. C, superimposed currents elicited by steps to −27, −37 and −47 mV in a whole‐cell recording from an SL cell before (Ca) and after (Cb) puffer application of 1 μm phrixotoxin‐1 (PhTx) at the soma. The faster‐decaying I A is partially blocked. Bath and puffer solutions also contained 0.5 μm TTX to block I Na. D, an experiment similar to that in (B) with another nucleated patch in which 30 mm TEA was bath‐applied externally, inhibiting the slower‐decaying I K.
Figure 4
Figure 4. The activation and inactivation properties of I A in nucleated macropatches are similar in SL and SP cells
The layout here is identical to that of Fig. 2. A, typical data for measuring either the rate of onset of inactivation (Aa, V pre = −37 mV) or the rate of recovery from inactivation (Ab, V pre = −77 mV) for I A. Superimposed dashed grey curves are single exponential fits with time constants 6.3 ms (Aa) and 56.4 ms (Ab). Data are from the same SP cell. The pulse protocols (top) are similar to those used for I Na (Fig. 2 A) apart from the choice of V test and the longer ΔT values to capture the slower inactivation kinetics of I A. B, summary data from a series of experiments such as those in A, showing the mean ± SEM of the fitted exponential time constant (τh) vs. membrane potential for patches from n = 3–9 SL cells (Ba) and n = 5–7 SP cells (Bb). Filled circles are from fits to inactivation recovery and onset; open circles are from fits to the decay of I A from an activation protocol (as in Ea). Superimposed smooth curves are empirical fits (Table 2). Ca, typical I A steady‐state inactivation family (SL cell; pulse protocol at top; V pre is 400 ms long for all voltages). Cb, plots of averaged normalized peak I A conductance (g A) vs. V pre for SL cells (grey symbols, n = 7) and SP cells (black symbols, n = 5). Superimposed smooth curves are Boltzmann fits (Table 2). Da, typical I A activation family (SP cell; pulse protocol at top). Each trace was obtained as the difference between the currents measured with and without a prepulse that inactivates I A (–37 or −117 mV for 30 ms; see Methods). This protocol minimizes contamination by the delayed rectifier, I K, and removes capacitive and linear leak currents. Db, plots of averaged normalized peak I A conductance (g A) vs. V test for SL cells (grey symbols, n = 6) and SP cells (black symbols, n = 7). Superimposed smooth curves are Boltzmann fits (Table 2). Ea, I A activation family from an SL cell, obtained using the prepulse protocol as in (Da), showing Hodgkin–Huxley fits (m 3 h; superimposed grey lines). Eb, plots of the mean ± SEM rise time constant (τrise) vs. V test, using the results of fits as in (Ea) (SL: n = 11; SP: n = 8). Superimposed smooth curves are exponential fits (Table 2). The averaged decay time constants (τh) from fits as in (Ea) are plotted in (Ba) and (Bb) (open circles). ns, not significant; *0.01 ≤ P < 0.05; ***0 < P < 0.001.
Figure 5
Figure 5. The activation and inactivation properties of I K in nucleated macropatches are similar for SL and SP cells
The layout here is identical to that of Figs. 2 and 4. A, typical data used for measuring inactivation onset (Aa, V pre = −57 mV) or recovery (Ab, V pre = −97 mV) for I K. Data are from the same SP cell. Superimposed dashed grey curves are fits to a sum of two exponentials plus a constant. The protocol is similar to that used in Fig. 4, except that ΔT is longer to suit the slower inactivation kinetics of I K. Also, leak subtraction was not used. B, summary data from a series of experiments such as those in (A), showing the mean ± SEM of the fitted exponential time constants (τh) vs. membrane potential for patches from n = 3–12 SL cells (Ba) and n = 4–10 SP cells (Bb). Filled symbols are from fits to inactivation recovery and onset (as in A); open symbols are from fits to the decay of I K from an activation protocol (as in Ea). Superimposed smooth curves and lines are empirical fits (Table 3). Ca, typical I K steady‐state inactivation family (SP cell; protocol at top; V pre was 1–10 s long, depending on the voltage; for details, see text). Note that leak subtraction was not used in this protocol. Cb, plots of averaged normalized peak I K conductance (gK) vs. V pre for SL cells (grey symbols, n = 4) and SP cells (black symbols, n = 4). Superimposed smooth curves are Boltzmann fits (Table 3). Da, I K activation family (SP cell; protocol at top). For each trace, the test pulse was preceded by a 30 ms long prepulse to −37 mV to inactivate I A. Capacitive and linear leak currents have been subtracted. Db, plots of averaged normalized peak g K vs. V test for SL cells (grey symbols, n = 5) and SP cells (black symbols, n = 4). Superimposed smooth curves are Boltzmann fits (Table 3). Ea, I K activation family from an SL cell, obtained using the prepulse protocol as in (Da), showing fits to a function of the form mh (i.e. mNh with N = 1; superimposed grey lines). Eb, plots of the mean ± SEM rise time constant (τrise) vs. V test, using the results of fits as in (Ea) (SL: n = 10; SP: n = 8). Superimposed smooth curves are exponential fits (Table 3). The averaged decay time constants from fits as in (Ea) are plotted in (Ba) and (Bb) (open symbols). ns, not significant; **0.001 ≤ P < 0.01.
Figure 6
Figure 6. SL and SP cells both contain a BK‐type KCa current, which is involved in determining the AP spike width but not firing patterns in response to a depolarizing current step
Aa, APs elicited by a current step in an SL cell (left) and an SP cell (right) in control solution (top) and after perisomatic application of 1 μm charybdotoxin (ChTx; bottom). The amplitude of the 200 ms long current step was adjusted to elicit at least six APs (SL: Control, 175 pA; ChTx: 97 pA; SP: Control, 350 pA; ChTx, 233 pA). Horizontal dashed lines indicate 0 mV. Ab, The first APs in the trains shown in (Aa), expanded and superimposed (left, SL cell; right, SP cell; grey, with ChTx). B, plots of the mean instantaneous AP firing frequency vs. the number of the interval between successive APs, calculated from data as in (A) when applying either ChTx or paxilline (Pax, 1 μm), for SL cells (left, n = 9) and SP cells (right, n = 13). ChTx/Pax had no effect on the plots (P = 0.2). C, plots of the mean AP halfwidth vs. the AP number, again from combined ChTx/Pax data, measured in SL cells (left, n = 9) and SP cells (right, n = 13). ChTx and Pax both significantly increased the halfwidth (P < 0.001). ns, not significant; *** P < 0.001.
Figure 7
Figure 7. SL and SP cells both contain an apamin‐sensitive SK current, the blockade of which accelerates spiking without affecting the accommodation pattern of either cell type
Both cell types also express a slow AHP. A, current clamp response of an SL cell to a current step (300 pA for 100 ms; bottom trace) before (black) and after (grey) application of apamin near the soma using local pressure ejection (1 μm apamin in the puffer pipette). Inset shows, expanded, the apamin‐sensitive medium AHP that follows the current step. Horizontal dashed line indicates 0 mV. B, voltage clamp version of the experiment in (A), shown on a longer timebase. The holding potential was −57 mV and V m was stepped to −7 mV for 100 ms (bottom trace). A slow AHP current was apparent both before (black) and after (grey) local application of apamin at the soma. Inset shows, expanded, the medium AHP current and its sensitivity to blockade by apamin. C, APs elicited by a current step in an SL cell before (left) and after (right) local application of apamin. Da, Averaged plots of the instantaneous AP firing frequency (normalized to the third interval) vs. the number of the interval between successive APs, calculated from data as in (C), for SL cells in control (black) and following apamin (grey, both n = 8). Apamin has no effect on the firing pattern. Db, averaged plot of the mean AP firing frequency during a current step (duration 200 ms) vs. the normalized amplitude of the current step (fI plot) in the same cells before (black) and after (grey) application of apamin (n = 9). Apamin significantly shifts the fI plot to the left. E, APs elicited by a current step in an SP cell before (left) and after (right) apamin. Fa, averaged normalized instantaneous firing plots for SP cells (n = 7) before (black) and after (grey) apamin. Apamin has no significant effect. Fb, averaged fI plots for SP cells before (black) and after (grey) apamin (n = 8). Apamin significantly shifts the fI plot to the left. ns, not significant; ***0 < P < 0.001.

Similar articles

Cited by

References

    1. Almog M & Korngreen A (2016). Is realistic neuronal modeling realistic? J Neurophysiol 116, 2180–2209. - PMC - PubMed
    1. Bekkers JM (2000. a). Distribution and activation of voltage‐gated potassium channels in cell‐attached and outside‐out patches from large layer 5 cortical pyramidal neurons of the rat. J Physiol 525, 611–620. - PMC - PubMed
    1. Bekkers JM (2000. b). Properties of voltage‐gated potassium currents in nucleated patches from large layer 5 cortical pyramidal neurons of the rat. J Physiol 525, 593–609. - PMC - PubMed
    1. Bekkers JM & Delaney AJ (2001). Modulation of excitability by α‐dendrotoxin‐sensitive potassium channels in neocortical pyramidal neurons. J Neurosci 21, 6553–6560. - PMC - PubMed
    1. Bekkers JM & Suzuki N (2013). Neurons and circuits for odor processing in the piriform cortex. Trends Neurosci 36, 429–438. - PubMed

Publication types

LinkOut - more resources