. 2018 Sep 26;7(3):269-283.e6.
doi: 10.1016/j.cels.2018.08.001. Epub 2018 Sep 5.

Machine Learning Predicts the Yeast Metabolome from the Quantitative Proteome of Kinase Knockouts

Affiliations

Machine Learning Predicts the Yeast Metabolome from the Quantitative Proteome of Kinase Knockouts

Aleksej Zelezniak et al. Cell Syst. .

Abstract

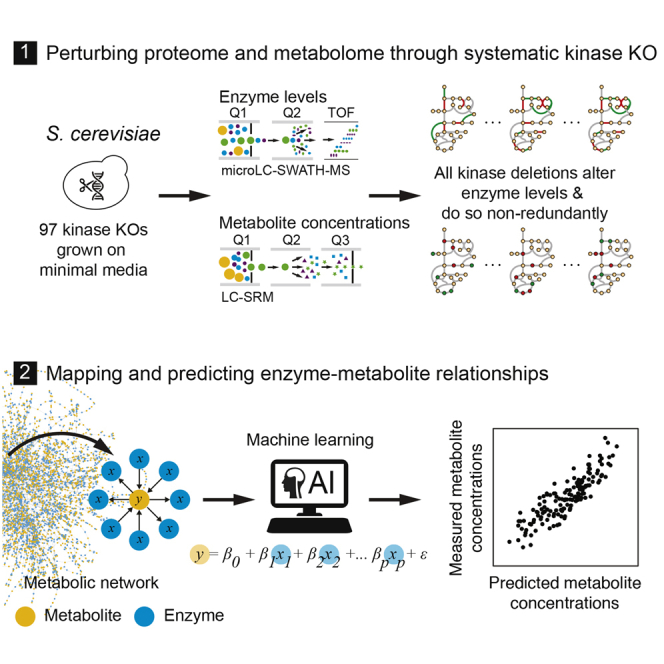
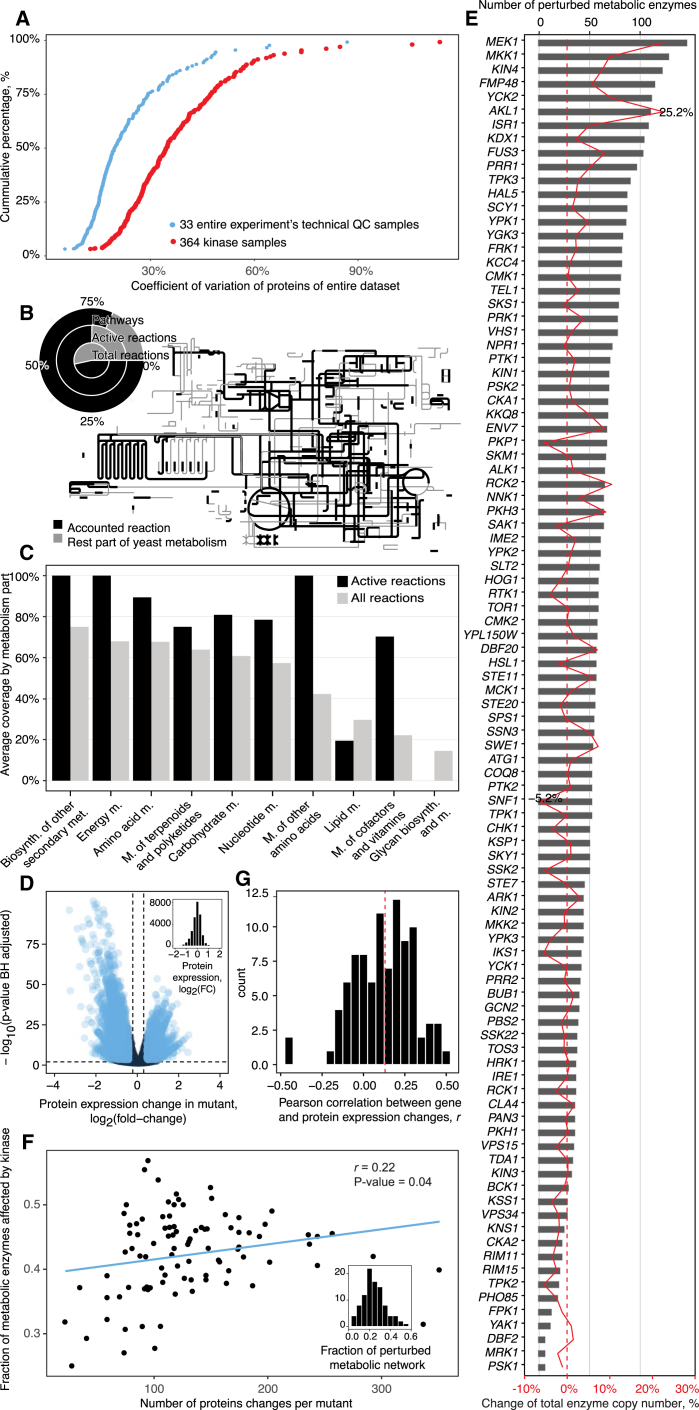
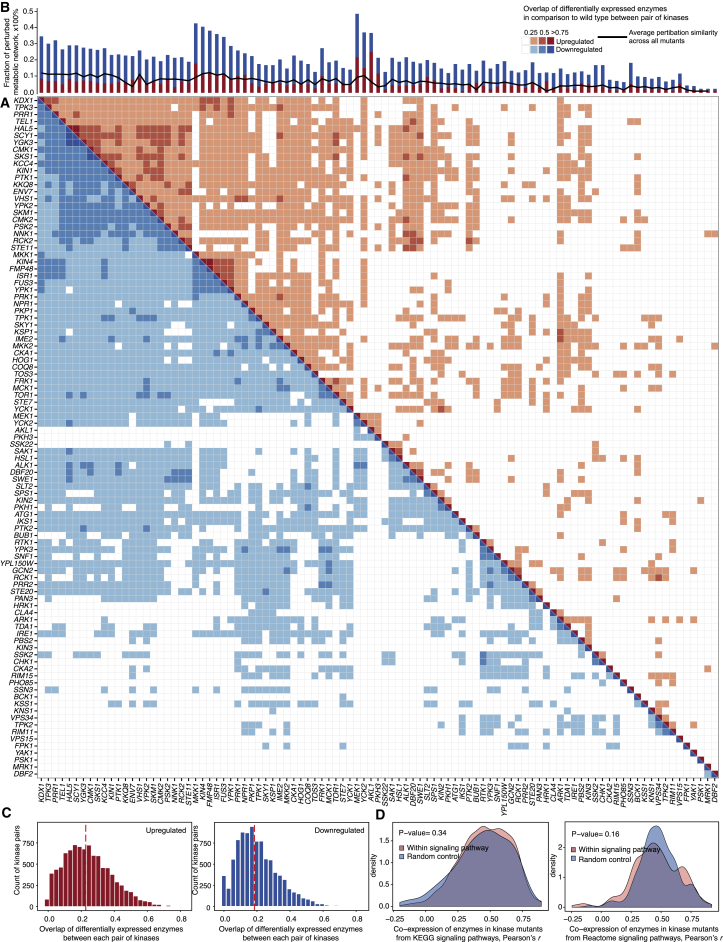
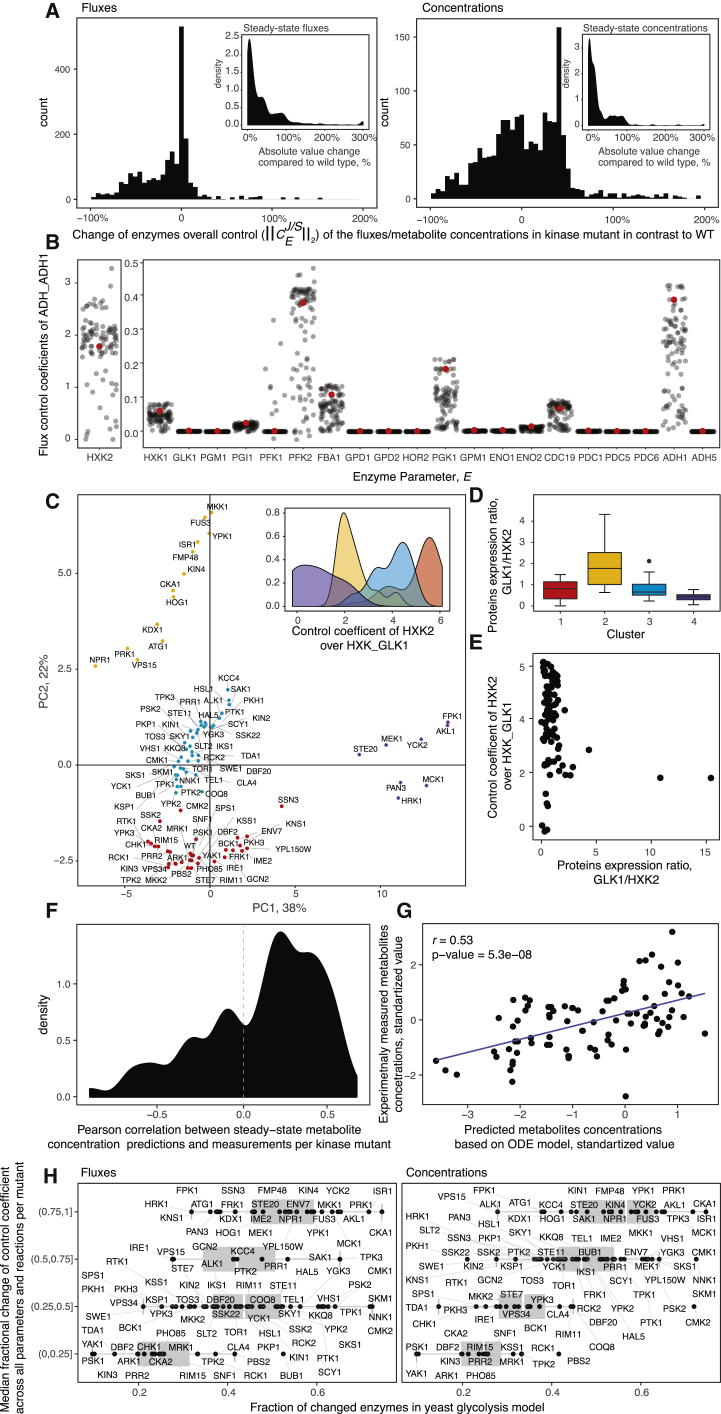
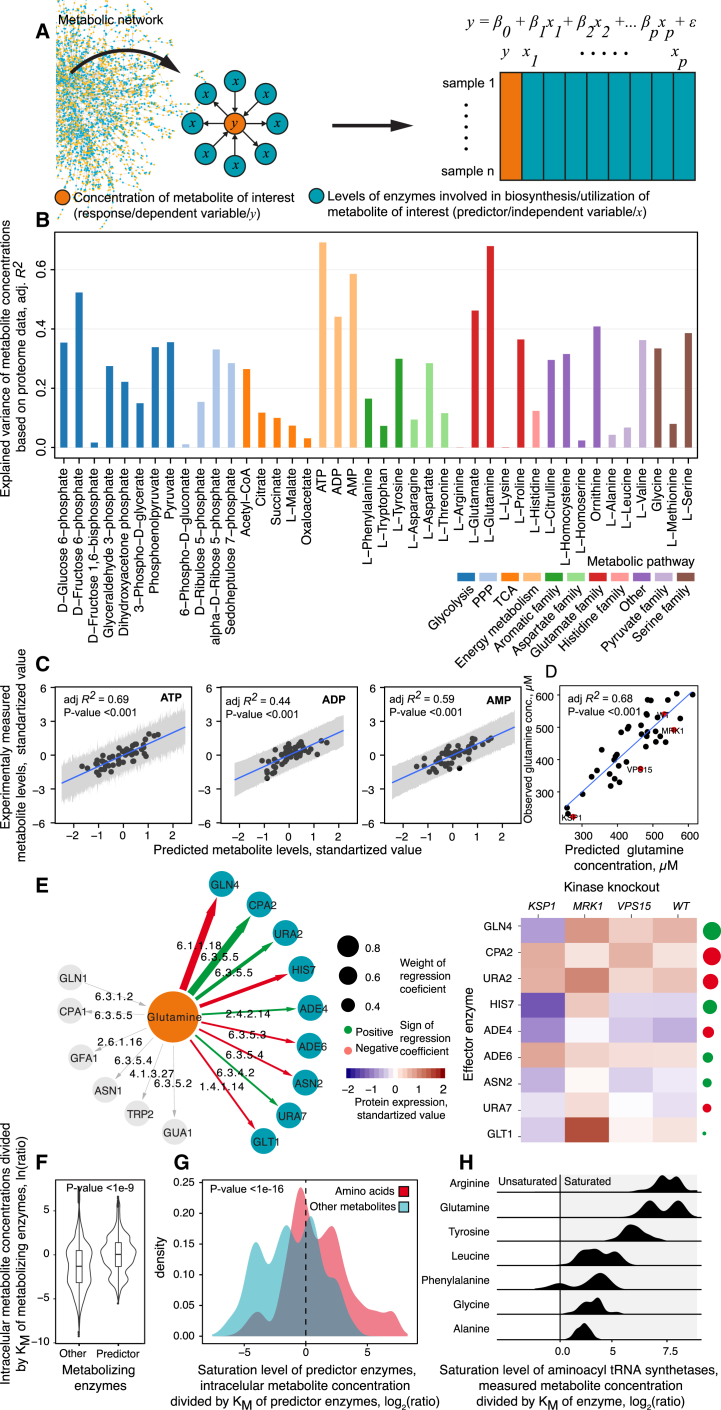
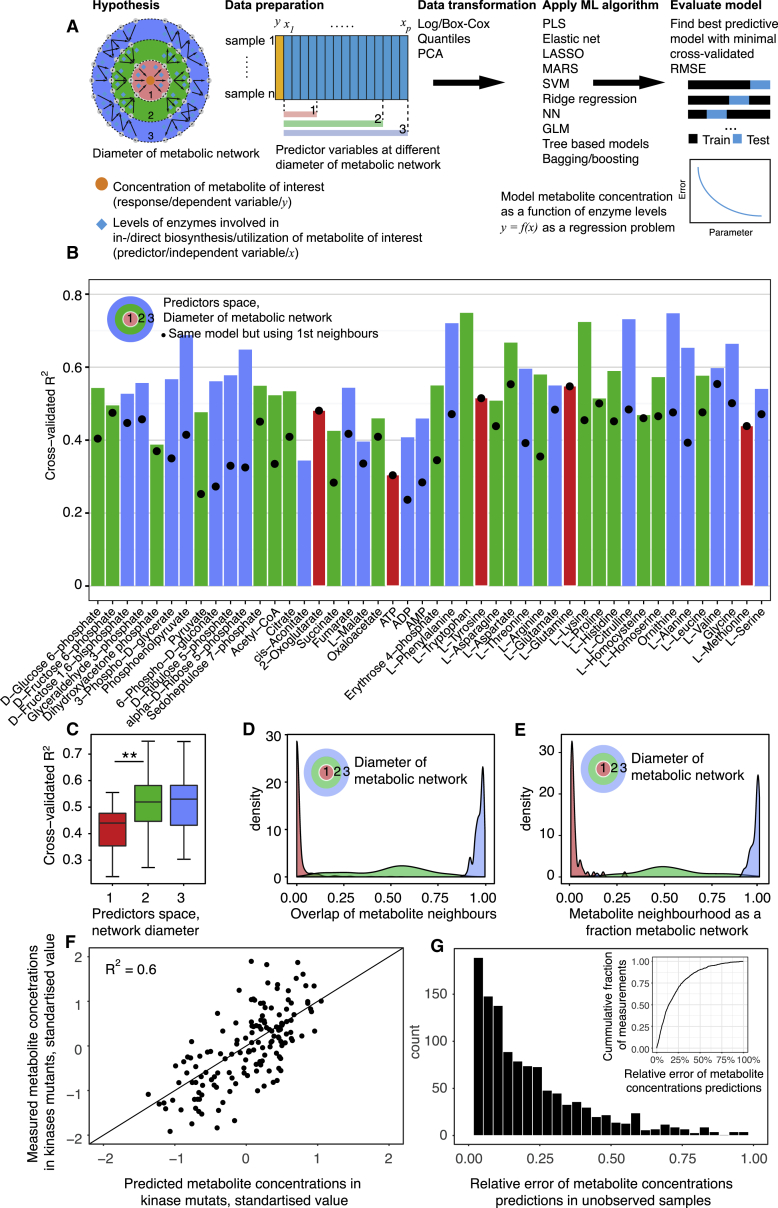
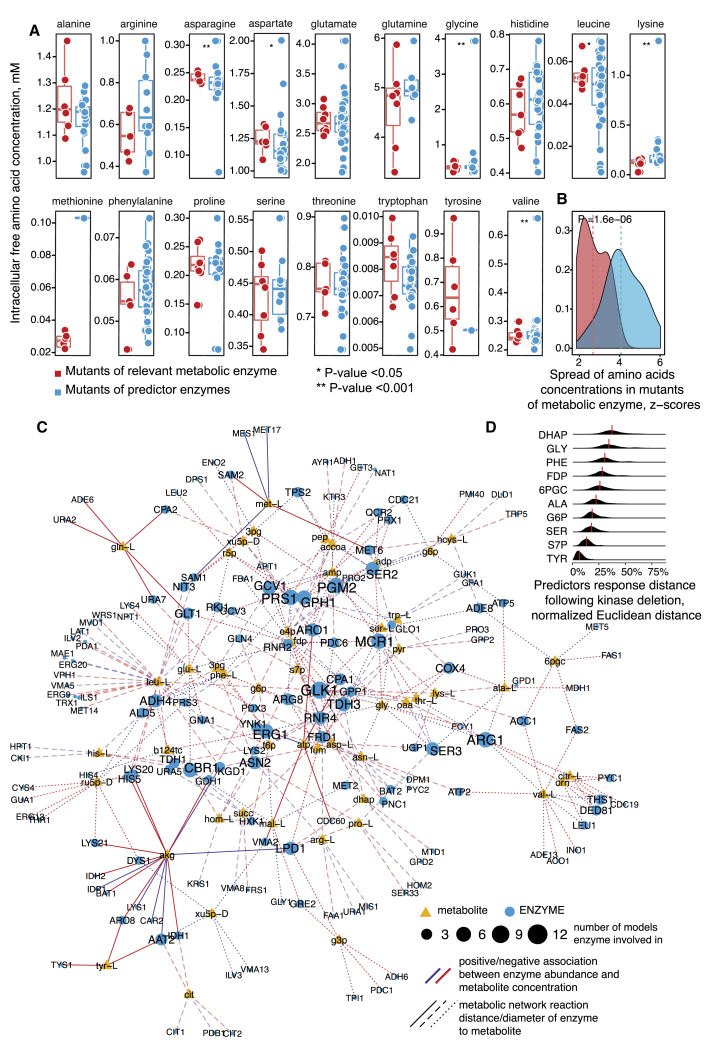
A challenge in solving the genotype-to-phenotype relationship is to predict a cell's metabolome, believed to correlate poorly with gene expression. Using comparative quantitative proteomics, we found that differential protein expression in 97 Saccharomyces cerevisiae kinase deletion strains is non-redundant and dominated by abundance changes in metabolic enzymes. Associating differential enzyme expression landscapes to corresponding metabolomes using network models provided reasoning for poor proteome-metabolome correlations; differential protein expression redistributes flux control between many enzymes acting in concert, a mechanism not captured by one-to-one correlation statistics. Mapping these regulatory patterns using machine learning enabled the prediction of metabolite concentrations, as well as identification of candidate genes important for the regulation of metabolism. Overall, our study reveals that a large part of metabolism regulation is explained through coordinated enzyme expression changes. Our quantitative data indicate that this mechanism explains more than half of metabolism regulation and underlies the interdependency between enzyme levels and metabolism, which renders the metabolome a predictable phenotype.

Keywords: enzyme abundance; genotype-phenotype problem; hierarchical regulation; high-throughput proteomics; machine learning; metabolic control analysis; metabolism; multi-omics.


Figures

None
Graphical abstract
Figure 1
Figure 1
A Deletion of Each of the 97 Non-essential Yeast Protein Kinases Triggers Broad and Quantitatively Strong Changes in Metabolic Enzyme Expression (A) Biological versus technical variability in a large-scale proteomic experiment. The coefficient of variation (CV) of enzymes at whole-process technical and biological levels. Cyan dots indicate CVs of a standardized proteome digest (quality control [QC] sample) that was used to monitor instrument performance over a 4-month acquisition period. QCs were used to normalize for batch effects, as well as to determine adequate cutoff values for determining differential protein expression. See also Figure S2 and STAR Methods. (B) Projection of quantified enzymes on the KEGG metabolic pathway map using iPath (Yamada et al., 2011) illustrates a connected network coverage, indicating comprehensive coverage of the active metabolic reactions by the proteome data. The black lines represent reactions catalyzed by at least one quantified enzyme; gray lines represent enzymatic reactions for which no enzyme was quantified. Circle plot: obtained coverage in comparison to all metabolic pathways’ theoretically active reactions (reactions that couple to biomass growth) in yeast as determined by flux-coupling analysis (Burgard et al., 2004) and compared to all KEGG-annotated reactions of the yeast metabolic network. (C) MicroLC-SWATH-MS proteomes capture large parts of the active enzymome. The representation of KEGG metabolic pathways by enzymes quantified in each proteome, shown as average coverage of metabolic pathways per KEGG metabolism category (KEGG BRITE hierarchy level B). A reaction was considered covered if >1 enzyme with the corresponding EC number was quantified. (D) Each of the 97 kinase deletions affects enzyme expression levels (volcano plot). Differential enzyme expression in all mutants is compared to the parental strain. Cutoffs were determined using repeated measurements on the control sample (STAR Methods) and determined as a fold change cutoff > |log2(1.4/0.714)|, Benjamini-Hochberg (Benjamini and Hochberg, 1995) adjusted p < 0.01, cyan colors indicate differentially expressed enzymes. Inset: the distribution of fold change values between mutants and parental strains. (E) The total number of metabolic enzymes affected by kinase deletions illustrated for each kinase. Red line: influence of the individual kinase deletion in relation to the total enzyme copy number in percent. Copy number changes were obtained by calibrating the proteome data according to the absolute values of protein expression (Kulak et al., 2014) (Details are given in the STAR Methods section). (F) Enzyme abundance changes account for a major fraction of all differentially expressed proteins as quantified in the kinase knockouts, and the relative contribution of enzymes has a low correlation with the total size of the proteomic perturbation. The y axis represents the fraction of the differentially expressed metabolic enzymes out of all quantified proteins. Inset: kinase deletions affect up to 49% of all quantified enzymes as denoted by the total of the metabolic network, summing up in all strains to 39% of the measured impact of the total kinome on protein expression. (G) Correlation of metabolic enzymes between proteome and transcriptomes (van Wageningen et al., 2010) expressed as fold changes. See also Figure S5.
Figure 2
Figure 2
The Deletion of Each Yeast Kinase Triggers a Unique Reconfiguration of Enzyme Expression in the Cell (A) Similarity and overlap between enzyme expression proteomes obtained upon kinase deletion in S. cerevisiae. Each cell represents the overlap in the compendium of differentially expressed enzymes (relative to the parental strain BY4741-pHLUM) between any pair of kinase knockouts. An enzyme is considered differentially expressed if the fold change > |log2(1.4/0.714)|, BH adj. p < 0.01. The matrix distinguishes between upregulated (red, upper right part of the matrix) and downregulated (blue, lower left part) enzymes. For illustration purposes, rows and columns are clustered according to the Jaccard distance between the proteomes, disregarding the directionality of the expression changes. The overlap between each pair of proteomes is shown as Jaccard similarity. (B) The fraction of differentially expressed metabolic enzymes in comparison to total differential protein expression in all kinase mutants (bar chart). The absolute average similarity of kinase deletion enzyme proteomes, across all kinase mutants, is depicted as a black line. The typical kinase deletion causes a unique enzyme expression signature, with a median dissimilarity between kinase proteome pairs of 88% (average overlap between enzymes differentially expressed = 12%). (C) The typical overlap of perturbed enzyme proteomes in kinases mutants is not more than ∼25% (dotted median line). (D) Enzyme expression changes (log2-fold change) are not better explained by the signaling pathway annotations as obtained from KEGG or Reactome databases compared to randomly assembled pathways. More comparisons are provided in Figures S9 and S10.
Figure 3
Figure 3
Enzyme Expression Affects Steady-State Metabolism through Redistributing Flux Control (A) Overall control coefficients of concentrations (CCC) and fluxes (FCC) are changed in kinase deletion strains comparing to WT due to the differential expression of multiple enzymes. The overall FCCs were calculated as described in Millard et al. (2017), i.e., taking for every enzyme the second norm over all its concentrations and FCCs that were parameterized on it (STAR Methods). Insets: simulated steady-state changes of fluxes and metabolite levels in kinase mutants in comparison to WT. (B) FCCs (CJE) over alcohol dehydrogenase (EC 1.1.1.1) reaction (y axis) by corresponding glycolytic enzymes (x axis) upon adjusting protein expression levels in a yeast glycolysis model as measured in each kinase knockout. Red dots indicate the WT strain values. To preserve the original scales, the control coefficients for HXK2 are plotted on a separate y axis. Differential enzyme expression substantially redistributes control coefficients in multiple kinases to different enzymes. (C) Principal-component analysis (PCA) of FCCs for every kinase gene deletion mutant reveals a distinct set of expression patterns that influences control over glycolysis. FCCs are not scaled (See also Figure S12). Axes labels represent the percentage of total variance explained by each of the PCs. Colors represent established flux regulatory clusters (STAR Methods). Cluster separation is mainly driven (inset) by control of HXK2 on GLK1 reaction. (D) Within each flux regulatory cluster, large differences between the GLK1/HXK2 expression ratio are observed. Corresponding p values for each pair of clusters using Wilcoxon rank-sum test (1 versus 2 p = 5.4e−05; 1 versus 3 p = 1.5e−02; 1 versus 4 p = 6.01e−01; 2 versus 3 p = 6.35e−05; 2 versus 4 p = 2.01e−03; 3 versus 4 p = 3.39e−01). (E) Flux control is a systemic property that depends on the coordinated expression of multiple enzymes. Even the most dominant single contributor (GLK1/HXK2 ratio, [x axis]) alone cannot explain the variation of flux control coefficients (y axis) as a result of differential enzyme expression. (F) Measured metabolite concentrations correlate with steady-state predictions by the enzyme-level adjusted kinetic models. (G) Correlation of model predictions and experimentally measured metabolite concentrations in the top 10 kinase mutants from (F). (H) The systems-nature of metabolism control: differential expression of a few individual pathway enzymes is sufficient to induce a redistribution of flux control among a broad set of enzymes. Fractions of differentially changed enzymes from the model are plotted on the x axis. The y axis shows the median change of control coefficient for each parameter comparing to the parental strain divided into 4 groups. Group (0.75, 1) has coefficients with the median change up to >100% in comparison to WT.
Figure 4
Figure 4
Multiple Linear Regression Identifies Multivariate Metabolite-Enzyme Relationships That Are Informative about Metabolite Concentration (A) Scheme: multiple linear regression (MLR) applied over the metabolic network topology to connect enzyme levels with metabolite concentrations. Metabolite concentrations (y) are expressed as a function of expression levels (x) of the closest enzyme neighbors in the metabolic network. Informative multivariate relationships between enzyme and metabolite concentrations are identified by exhaustive feature selection by computing all possible linear models and ranking them according to minimal Akaike information criterion (STAR Methods). (B) MLR reveals multivariate enzyme-metabolite relationships that explain metabolite concentrations in kinase knockouts. The bar plots indicate the coefficient of determination (adjusted R2) between predicted and experimentally determined metabolite concentrations across the kinase deletion strains. See also Figure S15. (C) The correlation of predicted and measured ATP, ADP, and AMP levels across kinase knockouts. x axis: predicted concentration from enzyme expression profiles, y axis: concentration as measured by liquid chromatography-selective reaction monitoring (LC-SRM). (D) The predicted and experimentally measured glutamine concentrations in kinase deletions correlate with an adjusted R2 = 0.68. Red dots highlight examples of enzyme expression patterns from (E) for representative in quartile of glutamine concentrations. (E) Left: graphical illustration of the 9 (out of 15) glutamine-metabolizing enzymes that are associated by the MLR approach to glutamine concentration. Right: as glutamine participates in multiple metabolic reactions, a correlation of the expression level of one glutamine-metabolizing enzyme at a time, as applied in many multi-omic studies, would fail to detect any correlation between enzyme expression and metabolism. (F) Enzymes that influence metabolite concentrations across kinase knockouts are more likely saturated compared to other enzymes connected to the same metabolites; KM values, as obtained from BRENDA (Chang et al., 2015), are compared to the concentration of the metabolites as measured in our study by LC-SRM. The level of saturation is expressed as a ratio between metabolite concentration and the enzyme’s KM value. (G) Enzymes that affect amino acid concentrations are more saturated compared to other enzymes associated with the rest of the metabolites. (H) Aminoacyl-tRNA synthetases, which are predictive of multiple amino acid concentrations, are typically saturated based on their in vitro kinetics.
Figure 5
Figure 5
Machine Learning Regression Predicts the Concentration of Metabolite Pools from Enzyme Abundance (A) Scheme: mapping the dependency of metabolite concentrations on enzyme expression levels by incorporating the structure of the metabolic network in a genome-scale application of machine learning (ML). Different data transformation techniques and twelve ML algorithms were applied over the metabolic network topology, and the obtained models were ranked according to their ability to predict metabolite concentrations from the enzym abundance (expressed as minimal cross-validated root-mean-square error [RMSE]). In comparison to MLR (Figure 4), the inclusion of ML enabled network expansion to the 2nd and 3rd order neighbors, upon which enzyme expression changes across the full metabolic network are incorporated (E). (B) ML enables the predictions of metabolite concentrations in the kinase knockouts on the basis of the enzyme abundances measured. Shown is the correlation of measured metabolite concentrations in relation to the predicted metabolite concentrations, expressed as 10-fold cross-validated R2. The median cross-validated R2 is 0.549, implying that at least half of metabolite concentration changes are explained by changes in enzyme abundance. The dots indicate the predictive power achieved with the directly metabolizing enzymes; the color indicates whether maximal predictability was reached upon including 1st, 2nd or 3rd order enzyme neighbors. (C) For most metabolites, the predictive power is concentrated within the directly metabolizing enzymes (1st order neighbors) or is partially improved upon incorporating also the 2nd order neighbors. Ruling out overfitting, the predictions did not improve upon further expansion of the predictor variable space to the full metabolic network. ∗∗ = Wilcoxon rank sum test p value < 0.01. (D) The commonality of enzyme predictors for the different metabolites, accounting for network diameter, reveals a spectrum of enzyme expression signatures that can regulate metabolite abundance. (E) The total fraction of enzymes associated with metabolite concentrations accounting for network distance. (F) Metabolic phenotype (all metabolites per mutant) predictions by ML in unobserved kinase knockout strains on the basis of their quantitative proteome. The phenotype prediction is based on individual metabolite models; the top 30 predicted kinase metabolomes are shown. (G) Distribution of relative errors (in %) in the prediction compared to experimental measurements of metabolite concentrations in all kinases knockout strains; ML predicts metabolite concentrations accurately.
Figure 6
Figure 6
Machine Learning Trained over the Metabolic Network Topology Reveals Genes and Metabolites Important for Metabolite Concentration Regulation (A) Enzymes whose abundance predicts metabolite concentrations in kinase knockouts cause metabolite concentration changes when deleted in a completely independent dataset (Mülleder et al., 2016a). (B) Summary of (A): the overall range of metabolite concentration changes is broader upon the deletion of enzymes associated with concentration changes, as it is upon the deletion of all other enzymes that convert the same metabolites. (C) Enzyme metabolite graph depicting hub proteins in the prediction of the yeast cell metabolome. Nodes represent metabolites (triangles) that are predictable using relevant enzyme abundances (circles). Edges represent positive and negative association represented by Pearson’s correlation between metabolite and enzymes levels. For visualization purposes, we retained only the most important enzymes (normalized weight of variable >90%, with up to 5 enzymes with highest absolute loading per component). (D) The concentration of several hub metabolites is affected by a spectrum of enzyme expression signatures, while for some metabolites only specific expression signatures were observed. More distant values (upper density plots) illustrate situations where a (kinase-deletion) unique combination of enzyme expression changes affects a particular metabolite. Contrarily, lower distances illustrate cases where multiple kinase deletions affect a metabolite via the same set of enzyme expression changes. The GAPDH substrate DHAP was the metabolite controlled by the highest number of divergent mechanisms, while tyrosine was the most uniformly regulated metabolite (for illustration purposes, only every 5th metabolite is depicted; the full figure is provided in Figure S18). To compare predictor responses between metabolites, the levels of associated enzymes were standardized (to zero mean and unit variance). The Euclidean distance of standardized enzyme expression was computed pairwise between each kinase mutant and normalized to 100% by the most distant kinase pair. Red vertical lines denote the median value for each enzyme. Abbreviations: amino acids are given in three letter IUPAC code; DHAP, dihydroxyacetone phosphate; FDP, Fructose 1,6 bisphosphate; 6PGC, 6-phosphogluconate; G6P, glucose 6-phosphate; S7P, sedoheptulose 7-P.

References

    1. Akaike H. A new look at the statistical model identification. IEEE Trans. Automat. Contr. 1974;19:716–723.
    1. Alam M.T., Zelezniak A., Mülleder M., Shliaha P., Schwarz R., Capuano F., Vowinckel J., Radmanesfahar E., Krüger A., Calvani E. The metabolic background is a global player in Saccharomyces gene expression epistasis. Nat. Microbiol. 2016;1:15030. - PMC - PubMed
    1. Alam M.T., Olin-Sandoval V., Stincone A., Keller M.A., Zelezniak A., Luisi B.F., Ralser M. The self-inhibitory nature of metabolic networks and its alleviation through compartmentalization. Nat. Commun. 2017;8:16018. - PMC - PubMed
    1. Benjamini Y., Hochberg Y. Controlling the false discovery rate: a practical and powerful approach to multiple testing. J. R. Stat. Soc. B. Stat. Methodol. 1995;57:289–300.
    1. Beyenbach K.W., Wieczorek H. The V-type H+ ATPase: molecular structure and function, physiological roles and regulation. J. Exp. Biol. 2006;209:577–589. - PubMed

Publication types