. 2018 Oct:86:109-119.
doi: 10.1016/j.jbi.2018.09.005. Epub 2018 Sep 7.

An evaluation of clinical order patterns machine-learned from clinician cohorts stratified by patient mortality outcomes

Affiliations

An evaluation of clinical order patterns machine-learned from clinician cohorts stratified by patient mortality outcomes

Jason K Wang et al. J Biomed Inform. 2018 Oct.

Abstract

Objective: Evaluate the quality of clinical order practice patterns machine-learned from clinician cohorts stratified by patient mortality outcomes.

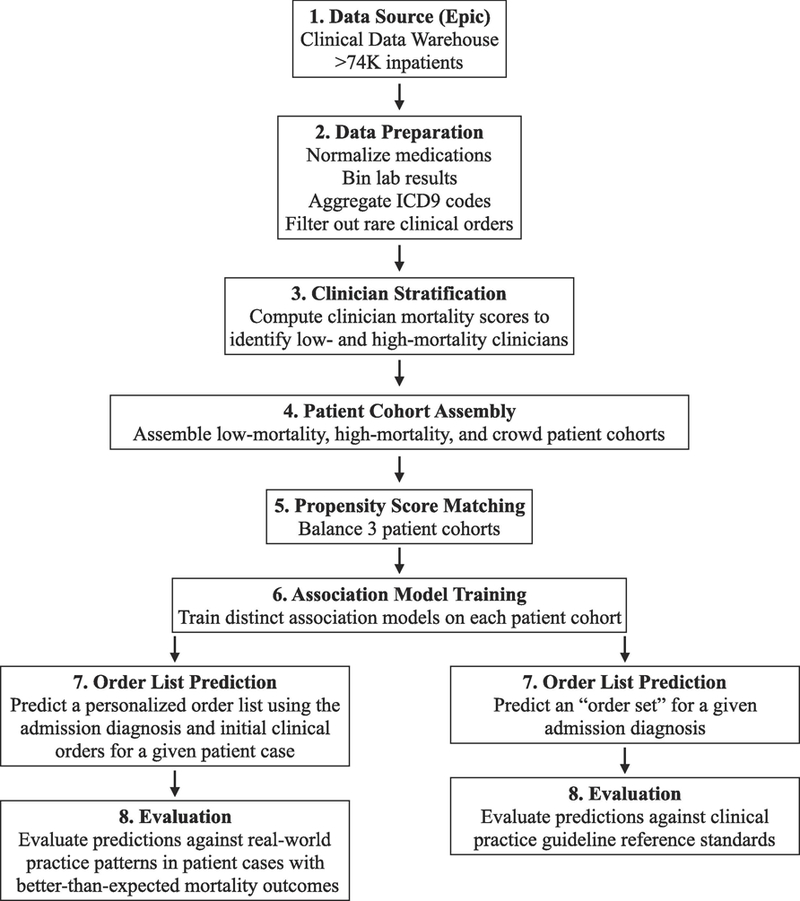
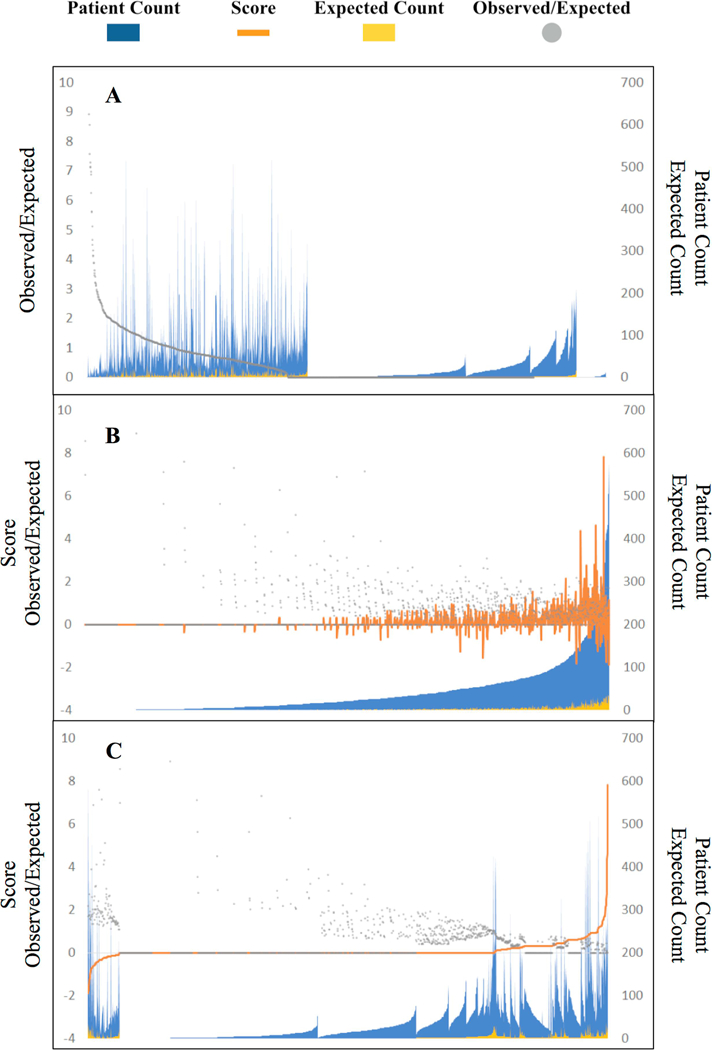
Materials and methods: Inpatient electronic health records from 2010 to 2013 were extracted from a tertiary academic hospital. Clinicians (n = 1822) were stratified into low-mortality (21.8%, n = 397) and high-mortality (6.0%, n = 110) extremes using a two-sided P-value score quantifying deviation of observed vs. expected 30-day patient mortality rates. Three patient cohorts were assembled: patients seen by low-mortality clinicians, high-mortality clinicians, and an unfiltered crowd of all clinicians (n = 1046, 1046, and 5230 post-propensity score matching, respectively). Predicted order lists were automatically generated from recommender system algorithms trained on each patient cohort and evaluated against (i) real-world practice patterns reflected in patient cases with better-than-expected mortality outcomes and (ii) reference standards derived from clinical practice guidelines.

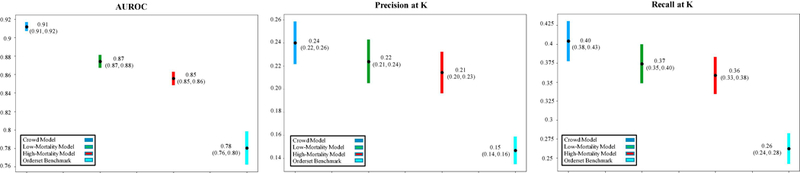
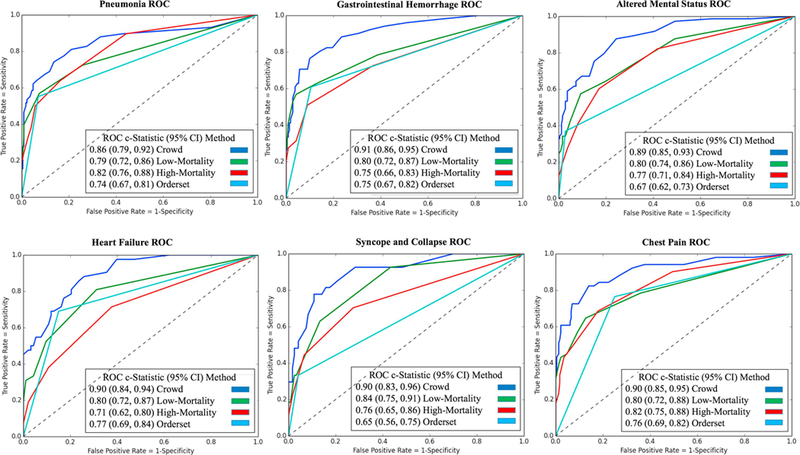
Results: Across six common admission diagnoses, order lists learned from the crowd demonstrated the greatest alignment with guideline references (AUROC range = 0.86-0.91), performing on par or better than those learned from low-mortality clinicians (0.79-0.84, P < 10-5) or manually-authored hospital order sets (0.65-0.77, P < 10-3). The same trend was observed in evaluating model predictions against better-than-expected patient cases, with the crowd model (AUROC mean = 0.91) outperforming the low-mortality model (0.87, P < 10-16) and order set benchmarks (0.78, P < 10-35).

Discussion: Whether machine-learning models are trained on all clinicians or a subset of experts illustrates a bias-variance tradeoff in data usage. Defining robust metrics to assess quality based on internal (e.g. practice patterns from better-than-expected patient cases) or external reference standards (e.g. clinical practice guidelines) is critical to assess decision support content.

Conclusion: Learning relevant decision support content from all clinicians is as, if not more, robust than learning from a select subgroup of clinicians favored by patient outcomes.

Keywords: Clinical decision support; Data mining; Electronic health records; Machine learning; Mortality.


Conflict of interest statement

COMPETING INTERESTS

The authors have no competing interests to declare.

Figures

Figure 1.
Figure 1.. Methodology Pipeline to Investigate Whether Clinician Stratification by Patient Mortality Yields Better Automatically Learned Practice Patterns.
1) Data source: de-identified, structured patient data was extracted from Stanford University Medical Center’s EHR (Epic). 2) Data preparation: patient data was processed to reduce complexity across medication, lab result, and diagnosis codings. 3) Clinician stratification: to mitigate confounding factors resulting from underlying patient characteristics, a L1-regularized logistic regression model was trained on 2008–2009 clinical data to predict a patient’s probability of mortality within 30 days based on treatment team, comorbidities, demographics, severity of illness, etc. and used to predict expected 30-day mortality counts for active clinicians in 2010–2013. Using a P-value-transformation of observed versus expected mortality counts and H&P authorship to identify clinician-patient relationships, clinicians at extremes were stratified into groups with lower or higher than expected patient mortality. 4) Patient cohort assembly: low-mortality (patients seen by low-mortality clinicians and no high-mortality clinicians), high-mortality (vice versa), and crowd patient cohorts (patients seen by any clinician) were assembled. 5) Propensity score matching: to further mitigate confounding factors, the three patient cohorts were balanced across covariates including medical history, treatment specialty, and demographic data, ensuring that the patient cohorts differed primarily in which class of clinicians they saw. 6) Recommender system training: applying association rule episode mining to clinical order data extracted from each patient cohort, three distinct recommender systems were trained, each reflecting the clinical order patterns of the corresponding clinician cohort. 7) Order list prediction: each recommender system outputted order suggestions for two predictions tasks: i) given an admission diagnosis and clinical orders administered up to the usage of an order set from a real-world patient case, predict a personalized order list; ii) given an admission diagnosis, predict a general diagnosis-specific order list. For (i), we considered patient cases with better-than-expected mortality outcomes from 2010–2013 EHR data, left-out from model training. For (ii), we considered six common admission diagnoses. 8) Evaluation: predictions generated by the three association models and corresponding hospital order set benchmarks were evaluated against: i) real-world practice patterns reflected in the actual 24 hours of orders administered after the order set usage instance; ii) practice guideline reference standards curated by two board-certified internal medicine physicians based on a review of clinical practice literature. EHR: electronic health record. H&P: history & physical examination note.
Figure 2.
Figure 2.. Distribution of clinician performance scores and corresponding patient cohort sizes among 2010–2013 clinicians.
Each x-axis position represents one clinician considered with blue peaks representing the number of patients whose treatment was attributed to the clinician. Figure 1A illustrates clinicians sorted purely by observed-to-expected patient mortality ratio (gray points). The raw ratio proves unstable as a metric. Nearly half of clinicians show a “perfect” ratio of 0, mostly due to small patient cohort size, and a small cluster of clinicians on the right show an undefined ratio when the expected death denominator is zero. Figure 1B sorts clinicians by total patient count attributed to them. The clinician performance score (orange curves) accounts for both effect size of observed-to-expected patient mortality as well as certainty in those rate estimates based on the quantity of patient data available for each clinician. Figure 1C sorts clinicians by performance score, illustrating that by design the majority of clinicians (72.2%, n=1315 of 1822) are left unstratified in the middle range with an Sj score of zero, largely given patient cohort sizes too small to draw statistically detectable conclusions. Only clinicians at the extremes who demonstrate substantial deviation from expected norms are stratified into low- and high-mortality cohorts.
Figure 3.
Figure 3.. Mean AUROC, precision, and recall metrics from evaluating predicted personalized order lists against real-world practice patterns reflected in patient cases with better-than-expected mortality outcomes (n=426 order set usage instances).
Predictions were generated each time a manually-authored hospital order set was used within 24 hours of a hospitalization. Each chart compares the performance of low-mortality, high-mortality, and crowd association models and corresponding hospital order set benchmarks in emulating the “successful” orders actually placed 24 hours post-order set usage. Mean values are plotted alongside 95% confidence interval bands empirically estimated by bootstrap resampling with replacement 1000 times. The crowd model emulates better-than-expected, real-world practice patterns as well as, or better than, the low-mortality model, high-mortality model, and order set benchmarks. K=the number of items in the corresponding hospital order set denoting the usage instance. AUROC: area under the receiver operating characteristic curve.
Figure 4.
Figure 4.. ROC plots evaluating predicted order lists against practice guideline reference standards for six example diagnoses.
Each plot compares an order set authored by the hospital and automated predictions from low-mortality, high-mortality, and crowd association models. Pre-authored order sets have no inherent ranking or scoring system to convey relative importance and are thus depicted as a single discrete point on the ROC curve. Area-under-curve (AUROC) is reported as c-statistics with 95% confidence intervals empirically estimated by bootstrap resampling with replacement 1000 times. The unfiltered crowd of clinicians generates predictions that align with clinical practice guidelines as much as or more robustly than a cherry-picked subset of clinicians or manually-authored order sets. ROC: receiver operating characteristic.

Similar articles

Cited by

References

    1. Richardson WC, Berwick DM, Bisgard JC. et al. Crossing the Quality Chasm: A New Health System for the 21st Century Washington DC: Natl Acad Press, Institute of Medicine, Committee on Quality of Health Care in America Committee on Quality of Health Care in America; 2001.
    1. Lauer MS, Bonds D. Eliminating the ‘expensive’ adjective for clinical trials. Am Heart J 2014;167:419–20. - PubMed
    1. Tricoci P, Allen JM, Kramer JM. et al. Scientific evidence underlying the ACC/AHA clinical practice guidelines. JAMA 2009;301:831–41. - PubMed
    1. Durack DT. The weight of medical knowledge. N Engl J Med 1978;298:773–5. - PubMed
    1. Kaushal R, Shojania KG, Bates DW. Effects of computerized physician order entry and clinical decision support systems on medication safety: a systematic review. Arch Intern Med 2003;163:1409–16. - PubMed

Publication types

LinkOut - more resources