. 2018 Nov 7;26(11):2696-2709.
doi: 10.1016/j.ymthe.2018.08.011. Epub 2018 Aug 16.

PDGF Restores the Defective Phenotype of Adipose-Derived Mesenchymal Stromal Cells from Diabetic Patients

Affiliations

PDGF Restores the Defective Phenotype of Adipose-Derived Mesenchymal Stromal Cells from Diabetic Patients

Vivian Capilla-González et al. Mol Ther. .

Abstract

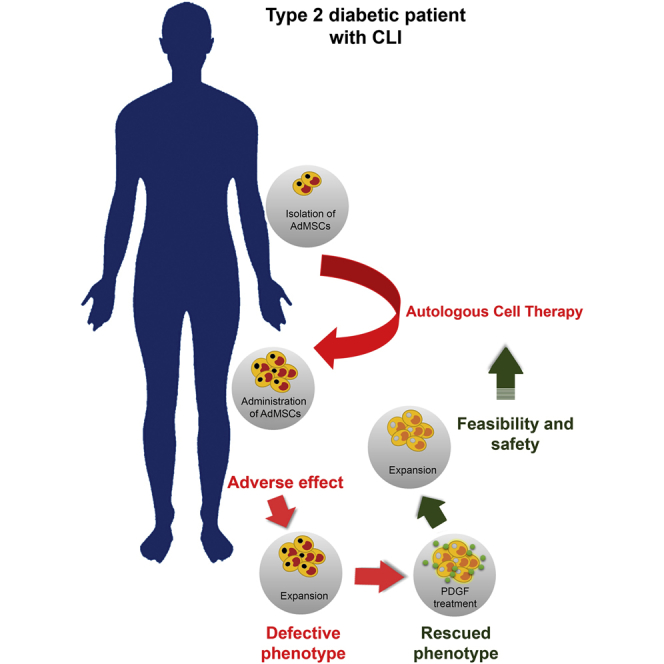
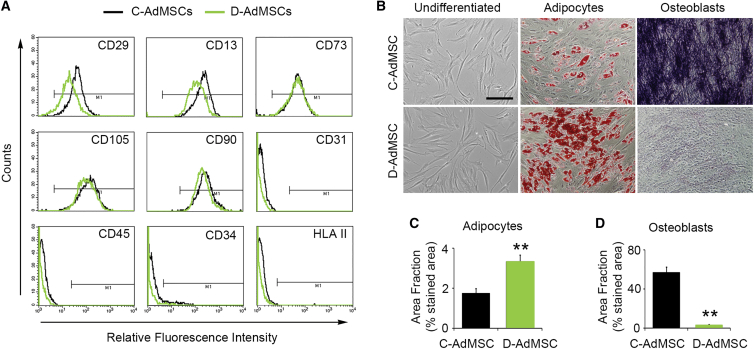
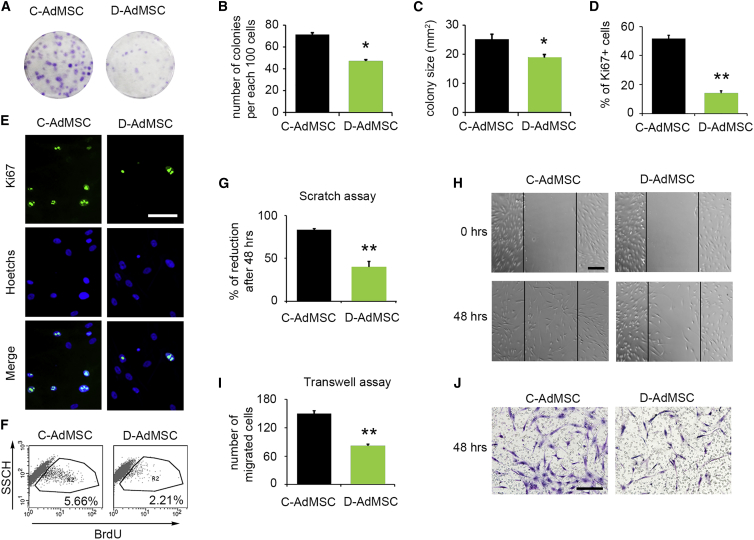
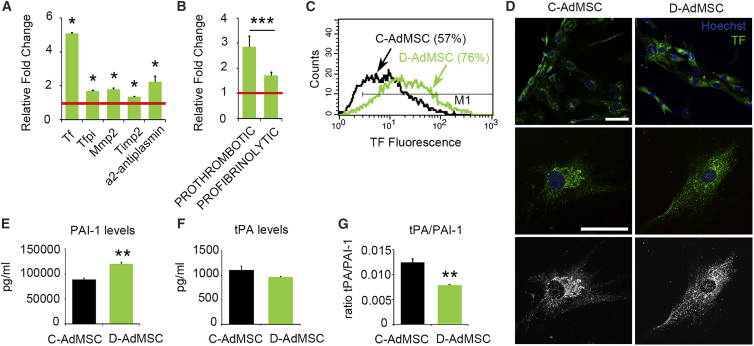
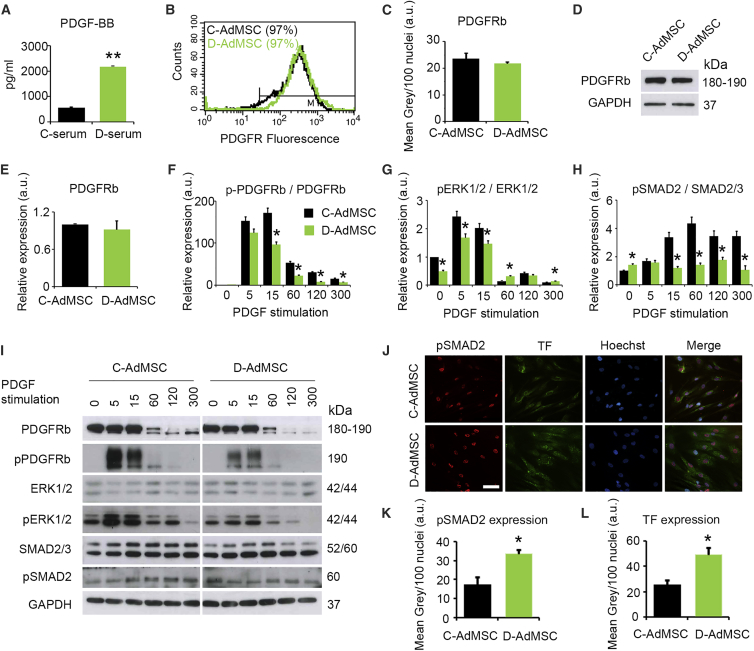
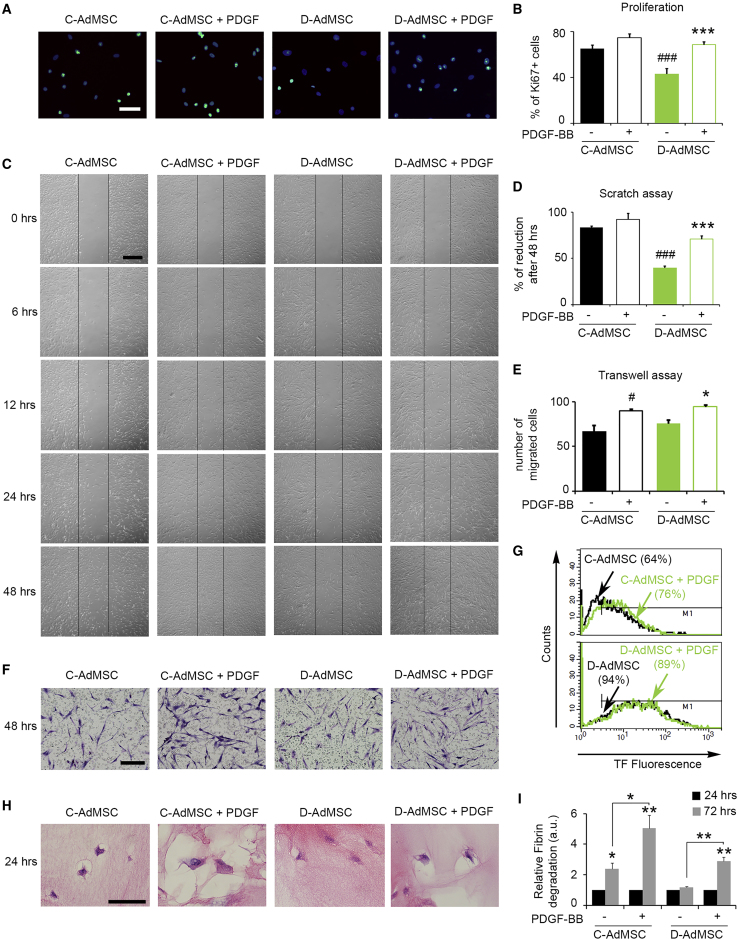
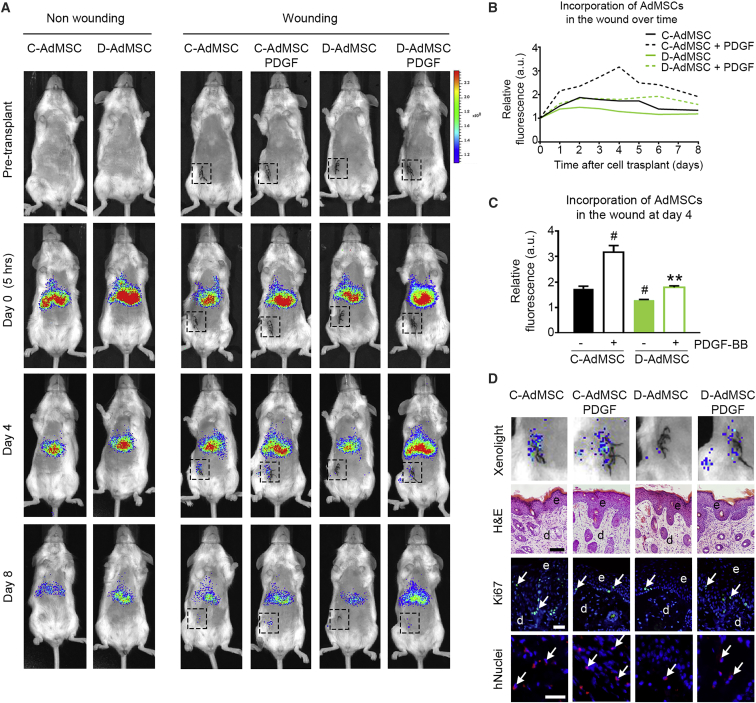
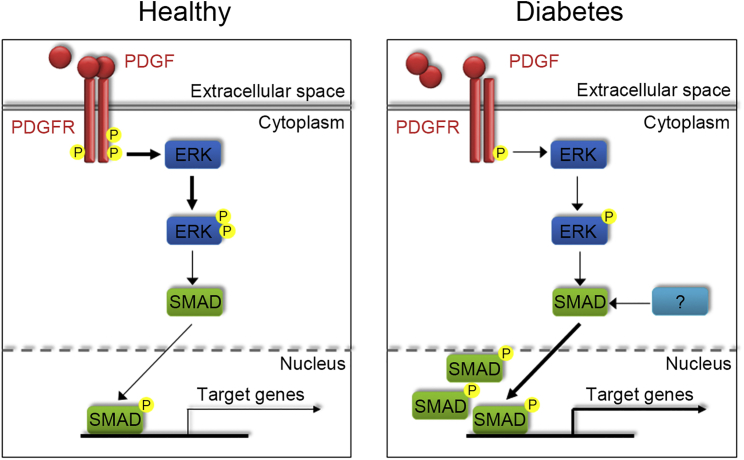
Diabetes is a chronic metabolic disorder that affects 415 million people worldwide. This pathology is often associated with long-term complications, such as critical limb ischemia (CLI), which increases the risk of limb loss and mortality. Mesenchymal stromal cells (MSCs) represent a promising option for the treatment of diabetes complications. Although MSCs are widely used in autologous cell-based therapy, their effects may be influenced by the constant crosstalk between the graft and the host, which could affect the MSC fate potential. In this context, we previously reported that MSCs derived from diabetic patients with CLI have a defective phenotype that manifests as reduced fibrinolytic activity, thereby enhancing the thrombotic risk and compromising patient safety. Here, we found that MSCs derived from diabetic patients with CLI not only exhibit a prothrombotic profile but also have altered multi-differentiation potential, reduced proliferation, and inhibited migration and homing to sites of inflammation. We further demonstrated that this aberrant cell phenotype is reversed by the platelet-derived growth factor (PDGF) BB, indicating that PDGF signaling is a key regulator of MSC functionality. These findings provide an attractive approach to improve the therapeutic efficacy of MSCs in autologous therapy for diabetic patients.

Keywords: PDGF; adipose-derived mesenchymal stromal cells; critical limb ischemia; diabetes; homing; migration; proliferation; thrombotic state.


Figures

None
Graphical abstract
Figure 1
Figure 1
Characterization of C-AdMSCs and D-AdMSCs (A) Flow cytometry analysis of cultured AdMSCs showing that both control and diabetic cells were positive for the MSC-specific markers CD29, CD13, CD73, CD105, and CD90, whereas they were negative for CD31, CD45, CD34, and HLA II. Respective isotype controls were used to define gate M1 and discard non-specific staining (less than 1%). (B) Phase contrast image of primary subconfluent cultures of C-AdMSCs and D-AdMSCs showing typical adherent fibroblast-like morphology, adipogenic differentiation (demonstrated by the presence of lipid droplets stained with oil red O), and osteogenic differentiation (demonstrated by alkaline phosphatase activity). (C) Quantification of the area occupied by the oil red O staining. (D) Quantification of the area occupied by the alkaline phosphatase staining. Scale bar: 100 μm in (B). Data are represented as mean ± SEM. **p < 0.01 (two-tailed t test).
Figure 2
Figure 2
Migratory and Proliferative Capacities of C-AdMSCs and D-AdMSCs (A) Representative image of colony-forming unit assays stained with cresyl violet from C-AdMSCs and D-AdMSCs. (B) Graph depicting the number of AdMSC colonies. Note the decreased number of colonies in D-AdMSCs. (C) Graph depicting the size of the AdMSC colonies. Note the decreased colony size in D-AdMSCs. (D) Quantification of Ki67+ cells, revealing a reduction in the percentage of proliferative cells in D-AdMSCs. (E) Immunocytochemistry against Ki67 (green) in C-AdMSCs and D-AdMSCs. Cell nuclei were stained with Hoechst dye (blue). (F) Representative flow cytometric analysis of BrdU incorporation by C-AdMSCs and D-AdMSCs. Percentage of cells expressing BrdU is indicated. Cells were exposed to BrdU for 3 hr before cell fixation. (G) Graph depicting the percentage of reduction of the scratched area after 48 hr. (H) Representative phase contrast images of a scratch assay showing the migration of AdMSCs after 48 hr. (I) Graph depicting the number of migrated cells through a transwell membrane after 48 hr. (J) Cresyl violet staining of AdMSCs that transmigrated through a transwell membrane after 48 hr. Scale bars: 100 μm in (E and H) and 50 μm in (J). Data are represented as mean ± SEM. *p < 0.05, **p < 0.001 (two-tailed t test).
Figure 3
Figure 3
Coagulation and Fibrinolytic Factors in C-AdMSCs and D-AdMSCs (A) qRT-PCR measurements for a selected set of genes involved in coagulation and fibrinolysis. The results were normalized to the internal controls Ppia and Rplp0. Note the increased expression of all tested genes in D-AdMSCs compared to C-AdMSCs (set as 1; red line). (B) Bar graph depicting the combined expression of prothrombotic (Tf, Timp2, and α2-antiplasmin) and profibrinolytic (Tfpi and Mmp2) genes assessed in (A). (C) Representative flow cytometry analysis determining the percentage of AdMSCs expressing the pro-coagulant marker TF. Note the higher expression of TF in the D-AdMSC population. (D) Immunocytochemistry staining for TF (green) in D-AdMSCs and C-AdMSCs. Cell nuclei were stained with Hoechst dye (blue). Staining for TF was more evident in the perinuclear region of C-AdMSCs, while it was homogeneously distributed in the surface and cytoplasm of D-AdMSCs. (E) Bar graph depicting a significant increase in the secretion of PAI-1 by cultured D-AdMSCs. (F) Bar graph depicting no differences in the secretion of tPA by cultured D-AdMSCs. (G) Bar graph depicting a significant decrease in the tPA/PAI-1 ratio of D-AdMSCs. Scale bar: 100 μm in (D). Data are represented as mean ± SEM. *p < 0.05, **p < 0.01, ***p < 0.001 (two-tailed t test).
Figure 4
Figure 4
PDGF Signaling in C-AdMSCs and D-AdMSCs (A) PDGF-BB levels detected in the serum of healthy (C-serum) and diabetic (D-serum) donors by ELISA, showing an increased concentration of PDGF-BB in D-serum. (B) Flow cytometry analysis determining the percentage of AdMSCs expressing PDGFRβ. (C) Quantification of PDGFRβ fluorescence intensity did not reveal significant differences between D-AdMSCs and C-AdMSCs. (D) Representative western blot for PDGFRβ protein levels in AdMSCs. Glyceraldehyde-3-phosphate dehydrogenase (GAPDH) was used as an internal control. (E) Densitometry analysis of western blots for PDGFRβ levels. (F) Densitometry analysis of western blots for phosphorylated PDGFRβ levels following PDGF stimulation. (G) Densitometry analysis of western blots for phosphorylated ERK1/2 levels following PDGF stimulation. (H) Densitometry analysis of western blots for phosphorylated SMAD2 levels following PDGF stimulation. (I) Representative western blot showing the expression levels of total and phosphorylated PDGFRβ, ERK1/2 and SMAD2/3 in AdMSCs. GAPDH was used as an internal control. (J) Immunocytochemistry staining for pSMAD2 (red) and TF (green) in AdMSCs. Cell nuclei were stained with Hoechst dye (blue). (K) Quantification of pSMAD2 fluorescence intensity in (J), revealing a significant increase in D-AdMSCs. (L) Quantification of TF fluorescence intensity in (J), revealing a significant increase in D-AdMSCs. Scale bar: 100 μm in (J). Data are represented as mean ± SEM. *p < 0.05, **p < 0.001 (two-tailed t test, two-way ANOVA).
Figure 5
Figure 5
Effects of PDGF-BB in Rescuing AdMSCs from the Diabetic Phenotype (A) Representative immunofluorescence images of proliferating cells using Ki67 (green) 5 hr after PDGF-BB stimulation. Cell nuclei were stained with Hoechst dye (blue). (B) Bar graph depicting the percentage of Ki67+ cells after PDGF-BB stimulation. (C) Representative phase contrast images of the scratch assay over time, with or without enrichment of PDGF-BB. (D) Bar graph depicting the percentage of reduced scratch area after 48 hr. PDGF-BB-enhanced cell migration in D-AdMSCs. (E) Bar graph depicting the number of migrated cells through a transwell membrane after 48 hr in media enriched or not with PDGF-BB. (F) Representative phase contrast images of the transwell assay in (D), stained with cresyl violet. (G) Flow cytometry analysis determining the percentage of AdMSCs expressing the pro-coagulant marker TF after PDGF-BB stimulation. Note the reduced expression of TF in D-AdMSC stimulated with PDGF-BB. (H) Representative images of the fibrin gel assay stained with H&E after 24 hr in culture. Note the clearing zone surrounding cells resulting from the AdMSC-mediated lysis of the fibrin clot. (I) Bar graphs depicting the levels of D-dimers in the media resulting from fibrin degradation over time (data were normalized relative to the 24 hr time point). Note the significant decrease in the fibrin degradation ability of D-AdMSCs and the subsequent rescue by PDGF. Scale bars: 100 μm in (A), 250 μm in (C), and 50 μm in (F and H). Data are represented as mean ± SEM. In (B), (D), and (E), ###p < 0.001 compared to C-AdMSCs, ***p < 0.001 compared to D-AdMSCs, #p < 0.05 compared to C-AdMSCs, and *p < 0.05 compared to D-AdMSCs (two-tailed t test, two-way ANOVA).
Figure 6
Figure 6
Biodistribution of Transplanted AdMSCs in an In Vivo Cutaneous Wound Model (A) XenoLight DiR-labeled AdMSCs were transplanted via tail veins into SCID mice the day after cutaneous incision. Images show bioluminescence activity in representative animals before and after (5 hr, days 4 and 8) cell transplantation. Black boxes delimit cutaneous incisions area. (B) Fluorescence in the wound area was quantified over an 8-day period. Values were normalized to the fluorescence in the wound area at day 0. The maximal fluorescence intensity was detected at day 4. (C) Quantification of the relative fluorescence in the wound area at day 4. Values were normalized to the fluorescence in the wound area at day 0. D-AdMSCs showed reduced invasion into the wound area, and this defect was rescued by PDGF stimulation. (D) Detailed analysis of the bioluminescence activity in the wound area at day 4. H&E staining of the wound tissue revealed a thickened epidermis (e, dark layer) over the dermis (d, light layer), as a result of post-wounding events. Immunohistochemistry against Ki67 (green) revealed proliferating cells (arrows) at the wound site. Immunohistochemistry against human nuclei (hNuclei; red) revealed the presence of AdMSCs (arrows) at the wound site. Cell nuclei were stained with Hoechst dye (blue). Scale bars: 100 μm (H&E) and 20 μm (immunohistochemistry [IHC]) in (D). Data are represented as mean ± SEM. #p < 0.05 compared to C-AdMSCs, **p < 0.01 compared to D-AdMSCs (two-tailed t test).
Figure 7
Figure 7
Schematic Representation of PDGFR, ERK, and SMAD Signaling in AdMSCs In AdMSCs from healthy donors, PDGF binding to its receptor activates ERK signaling, which in turn induces the translocation of SMAD to the nucleus and its phosphorylation. The activation of ERK and SMAD promotes the transcription of their target genes, including Tf. In AdMSCs derived from diabetic patients, PDGF signaling is downregulated, which results in partial inhibition of ERK1/2. However, SMAD is upregulated in AdMSCs derived from diabetic patients; consequently, TF expression is enhanced. This suggests that other pathways are involved in the sustained activation of SMAD observed in AdMSCs derived from diabetic patients.

Similar articles

Cited by

References

    1. Apelqvist J., Bakker K., van Houtum W.H., Nabuurs-Franssen M.H., Schaper N.C., International Working Group on the Diabetic Foot International consensus and practical guidelines on the management and the prevention of the diabetic foot. Diabetes Metab. Res. Rev. 2000;16(Suppl 1):S84–S92. - PubMed
    1. Ruiz-Salmeron R., de la Cuesta-Diaz A., Constantino-Bermejo M., Pérez-Camacho I., Marcos-Sánchez F., Hmadcha A., Soria B. Angiographic demonstration of neoangiogenesis after intra-arterial infusion of autologous bone marrow mononuclear cells in diabetic patients with critical limb ischemia. Cell Transplant. 2011;20:1629–1639. - PubMed
    1. Kim E.K., Li G., Lee T.J., Hong J.P. The effect of human adipose-derived stem cells on healing of ischemic wounds in a diabetic nude mouse model. Plast. Reconstr. Surg. 2011;128:387–394. - PubMed
    1. Maharlooei M.K., Bagheri M., Solhjou Z., Jahromi B.M., Akrami M., Rohani L., Monabati A., Noorafshan A., Omrani G.R. Adipose tissue derived mesenchymal stem cell (AD-MSC) promotes skin wound healing in diabetic rats. Diabetes Res. Clin. Pract. 2011;93:228–234. - PubMed
    1. Soria B., Montanya E., Martín F., Hmadcha A. A role for the host in the roadmap to diabetes stem cell therapy. Diabetes. 2016;65:1155–1157. - PubMed

Publication types

MeSH terms

Substances