. 2018 Sep 7:12:319-336.
doi: 10.1016/j.omtn.2018.05.015. Epub 2018 Jul 4.

MiR-663a Stimulates Proliferation and Suppresses Early Apoptosis of Human Spermatogonial Stem Cells by Targeting NFIX and Regulating Cell Cycle

Affiliations

MiR-663a Stimulates Proliferation and Suppresses Early Apoptosis of Human Spermatogonial Stem Cells by Targeting NFIX and Regulating Cell Cycle

Fan Zhou et al. Mol Ther Nucleic Acids. .

Abstract

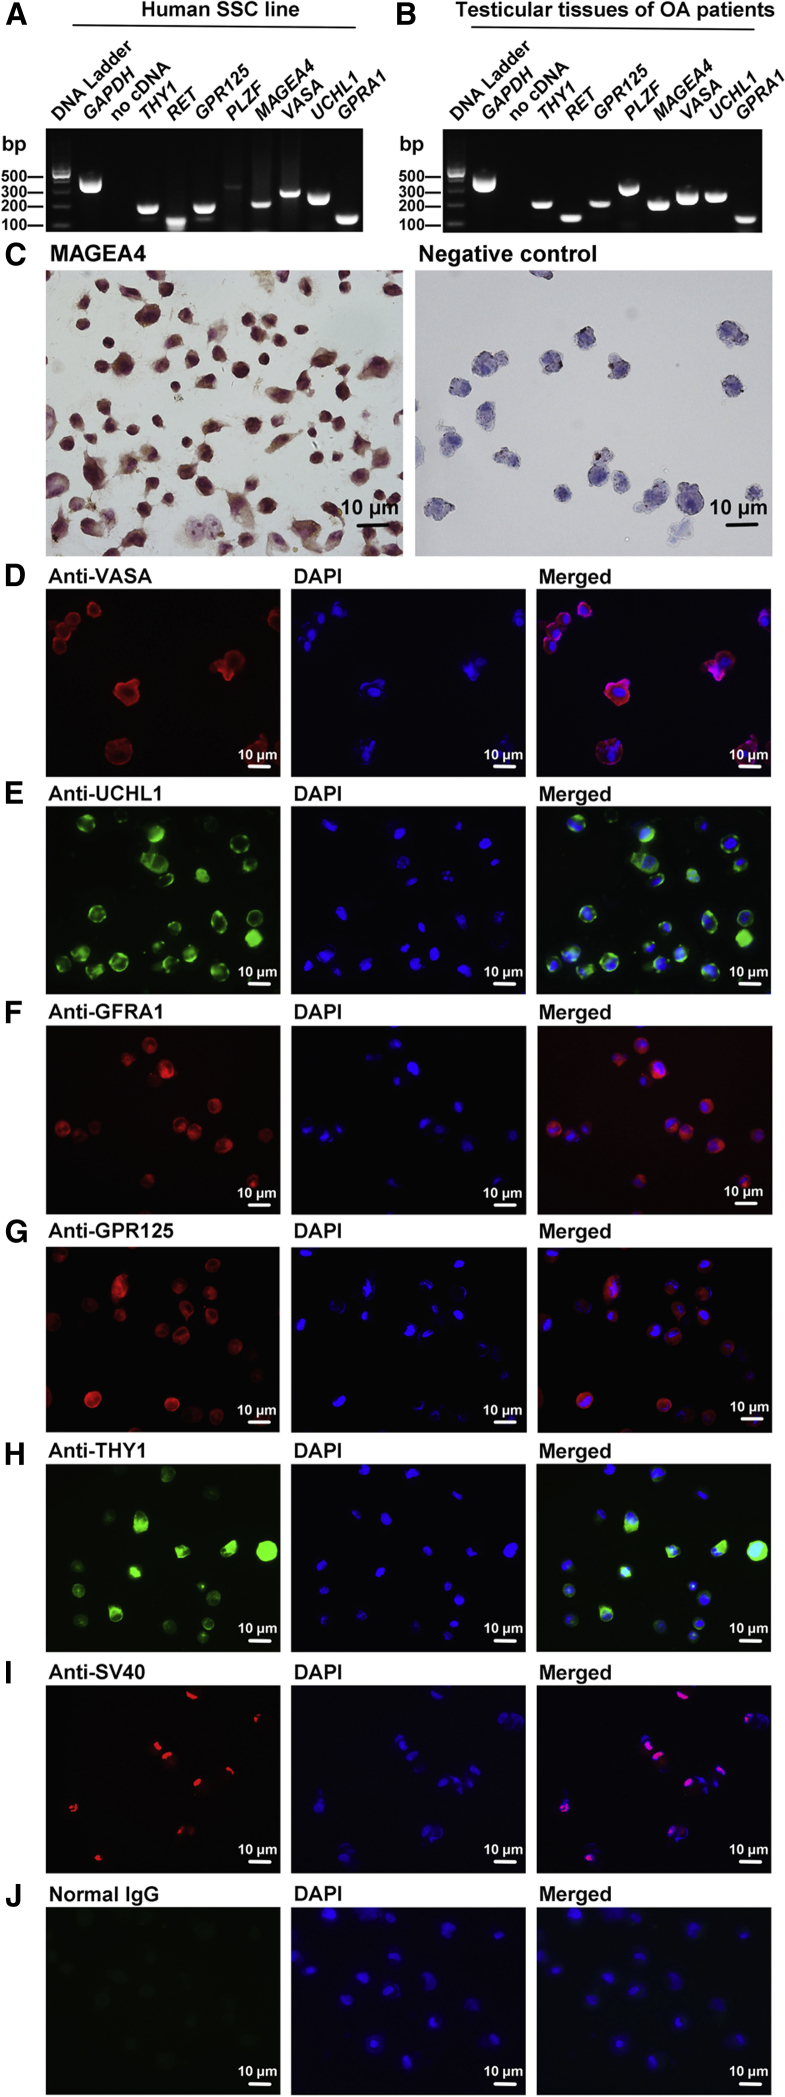
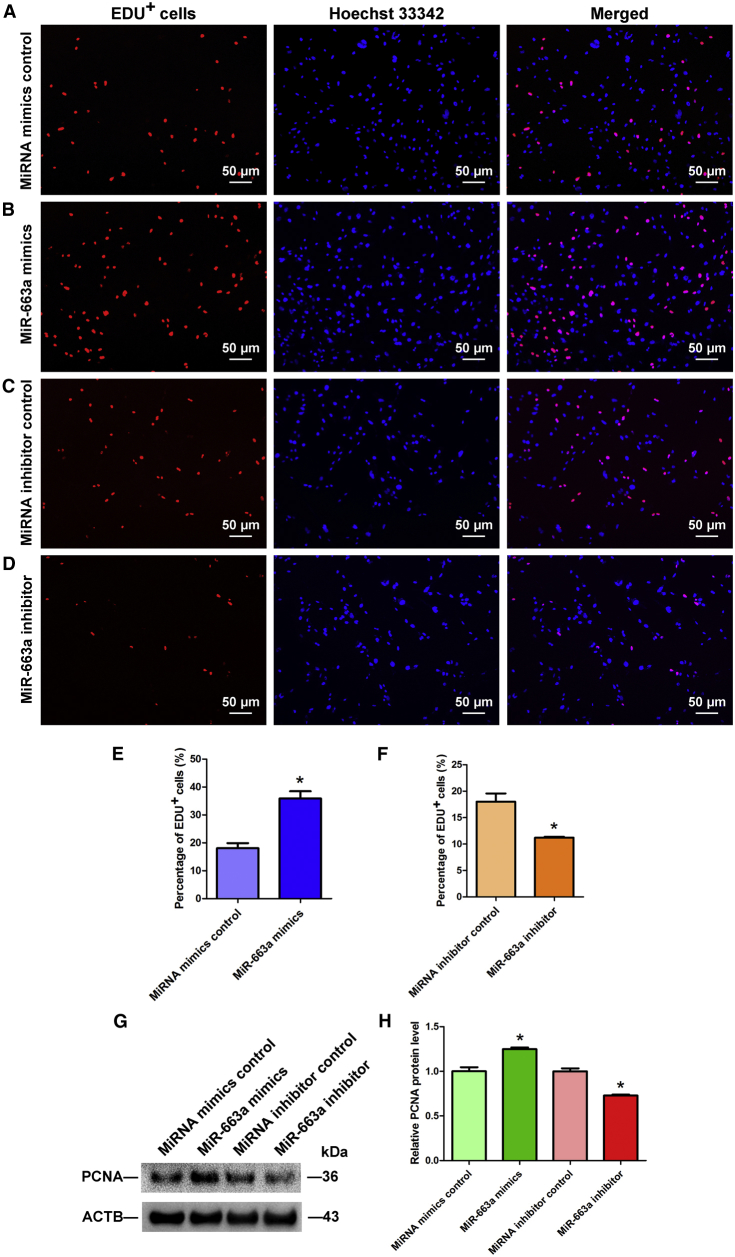
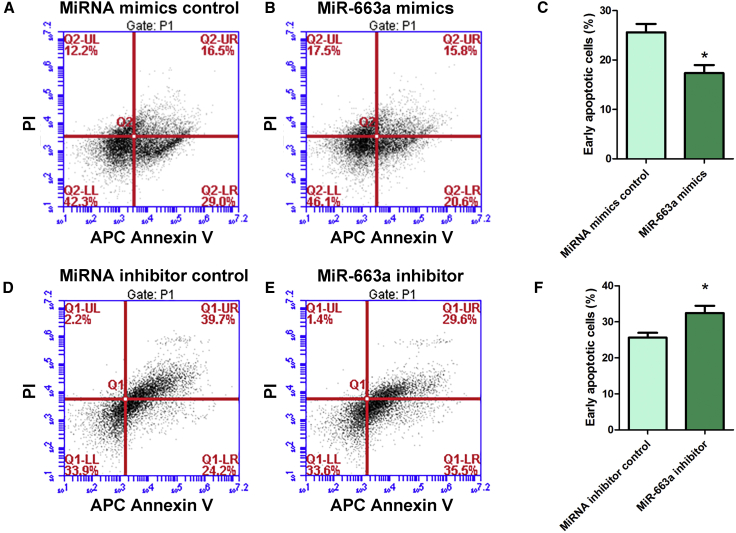
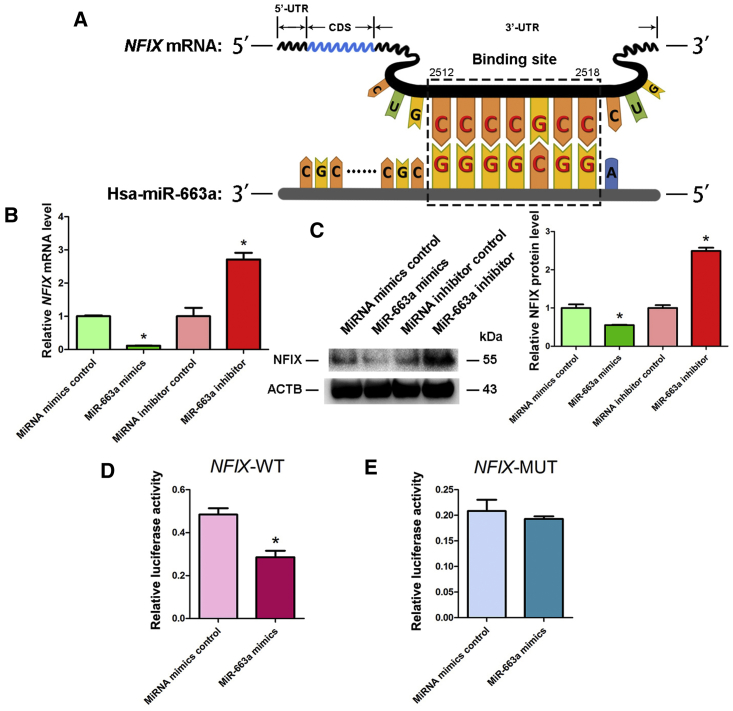
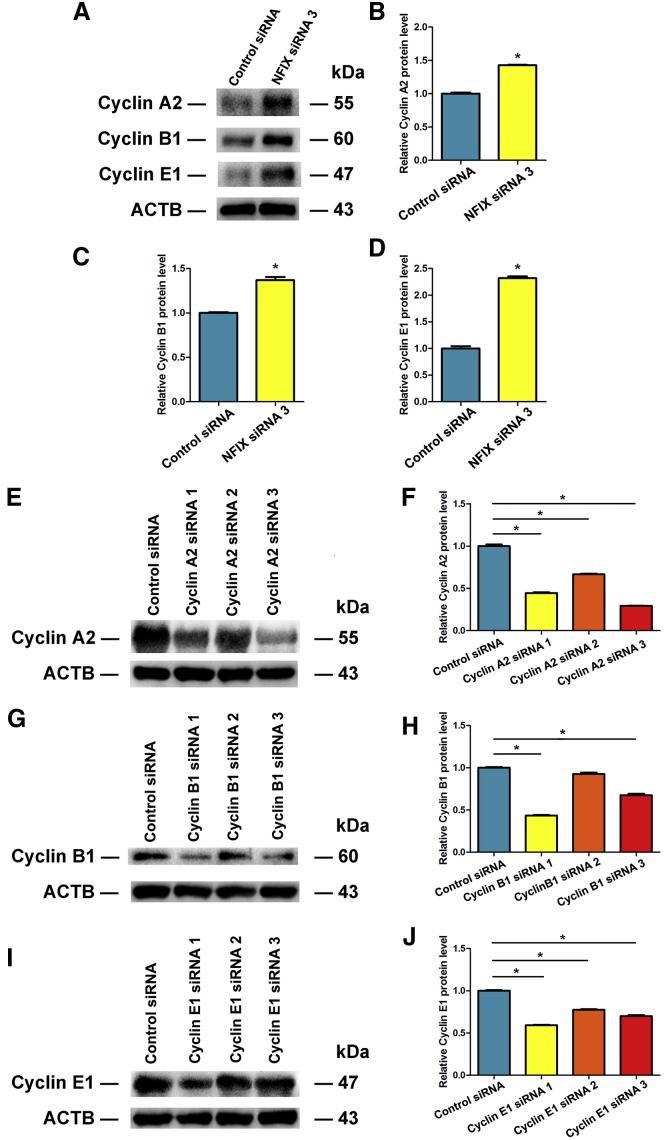
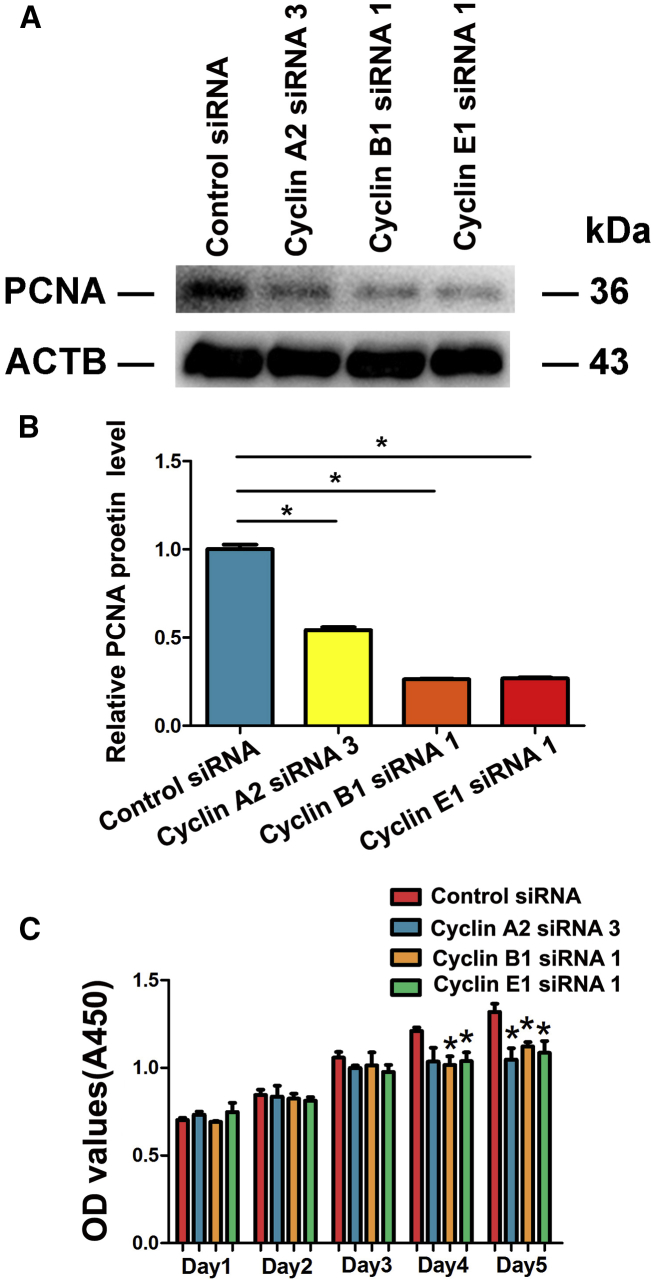
Human spermatogonial stem cells (SSCs) could have significant applications in reproductive medicine and regenerative medicine because of their great plasticity. The fate determinations of human SSCs are mediated by epigenetic factors. However, nothing is known about the regulation of non-coding RNA on human SSCs. Here we have explored for the first time the expression, function, and target of miR-663a in human SSCs. MiR-663a was upregulated in human spermatogonia compared with pachytene spermatocytes, as indicated by microRNA microarray and real-time PCR. CCK-8 and 5-Ethynyl-2'-deoxyuridine (EDU) assays revealed that miR-663a stimulated cell proliferation and DNA synthesis of human SSCs. Annexin V and propidium iodide (PI) staining and flow cytometry demonstrated that miR-663a inhibited early and late apoptosis of human SSCs. Furthermore, NFIX was predicted and verified as a direct target of miR-663a. NFIX silencing led to an enhancement of cell proliferation and DNA synthesis and a reduction of the early apoptosis of human SSCs. NFIX silencing neutralized the influence of miR-663a inhibitor on the proliferation and apoptosis of human SSCs. Finally, both miR-663a mimics and NFIX silencing upregulated the levels of cell cycle regulators, including Cyclin A2, Cyclin B1, and Cyclin E1, whereas miR-663a inhibitor had an adverse effect. Knockdown of Cyclin A2, Cyclin B1, and Cyclin E1 led to the decrease in the proliferation of human SSCs. Collectively, miR-663a has been identified as the first microRNA that promotes the proliferation and DNA synthesis and suppresses the early apoptosis of human SSCs by targeting NFIX via cell cycle regulators Cyclin A2, Cyclin B1, and Cyclin E1. This study thus provides novel insights into the molecular mechanisms underlying human spermatogenesis, and it could offer novel targets for treating male infertility and other human diseases.

Keywords: NFIX; apoptosis; cell cycle proteins; human spermatogonial stem cells; miRNA-663a; proliferation.


Figures

Figure 1
Figure 1
Isolation, Identification, and MiR-663a Expression of Human Spermatogonia and Pachytene Spermatocytes (A and B) Morphological characteristics of freshly isolated human spermatogonia (A) and pachytene spermatocytes (B) from testicular tissues of OA patients under phase-contrast microscope. (C) Real-time qPCR revealed the different expression levels of miR-663a in human spermatogonia and pachytene spermatocytes. *Statistically significant differences (p < 0.05) between human spermatogonia and pachytene spermatocytes. (D) RT-PCR revealed the expression of GPR125, GFRA1, UCHL1, and THY1 in human spermatogonia and testicular tissues of OA patients (positive control). (E) RT-PCR showed the transcripts of SYCP3, MLH1, and CREST in human pachytene spermatocytes and testicular tissues of OA patients (positive control). Samples without cDNA (no cDNA) but PCR with gene primers were employed as negative controls. GAPDH served as a loading control of total RNA. (F–I) Immunocytochemistry demonstrated the expression of GFRA1 (F), GPR125 (G), UCHL1 (H), and THY1 (I) proteins in freshly isolated human spermatogonia. Scale bars, 20 μm (F–I). (J) Meiotic spread assays displayed the co-expression of SYCP3 (red fluorescence), CREST (blue fluorescence), and MLH1 (green fluorescence) proteins in pachytene spermatocytes isolated from OA patients. Scale bar, 2 μm (J).
Figure 2
Figure 2
Identification of the Human SSC Line (A and B) RT-PCR showed the mRNA levels of VASA, MEGEA4, THY1, RET, GPR125, PLZF, UCHL1, and GFRA1 in the human SSC line (A) and testicular tissues of OA patients (B, positive control). Samples without cDNA (no cDNA) but PCR with gene primers were used as negative controls, and GAPDH served as a loading control of total RNA. (C) Immunocytochemistry of anti-MAGEA4 stained by diaminobenzine (DAB) showed the presence of MAGEA4 protein (left panel) in the human SSC line. Replacement of anti-MAGEA4 with isotype IgGs was used as a negative control (right panel). (D–I) Immunofluorescence demonstrated the expression of VASA (D), UCHL1 (E), GFRA1 (F), GPR125 (G), THY1 (H), and SV40 (I) in the human SSC line. (J) Normal IgG was substituted for primary antibodies as a negative control. Scale bars, 10 μm (C–J).
Figure 3
Figure 3
Transfection Efficiency of MiR-663a Mimics and Inhibitor in the Human SSC Line and the Effects of Overexpression and Knockdown of MiR-663a on the Proliferation of Human SSCs (A) Fluorescence microscope and phase-contrast microscope revealed transfection efficiency of miR-663a mimics and inhibitor using the FAM-labeled miRNA oligonucleotides. (B) Fluorescence microscope and phase-contrast microscope showed the control transfection of the cells treated by RNA oligonucleotides without FAM labeling. Scale bars, 20 μm (A and B). (C) Real-time qPCR revealed the relative levels of miR-663a in human SSCs after transfection of miR-663a mimics compared to miRNA mimics control and miR-663a inhibitor compared to miRNA inhibitor control. *Statistically significant differences (p < 0.05) between miRNA mimics- or inhibitor-treated groups and their control. (D and E) CCK-8 assays revealed the growth curve of the human SSC line treated with miR-663a mimics and miRNA mimics control for 5 days (D) or miR-663a inhibitor and miRNA inhibitor control for 5 days (E). *Statistically significant differences (p < 0.05) between miR-663a mimics- or inhibitor-treated groups and their controls.
Figure 4
Figure 4
Effects of Overexpression and Knockdown of MiR-663a on the DNA Synthesis of Human SSCs (A–D) EDU incorporation assay showed the percentages of EDU-positive cells in the human SSC line affected by miRNA mimics control (A), miR-663a mimics (B), miRNA inhibitor control (C), and miR-663a inhibitors (D) in human SSCs. Scale bars, 50 μm (A–D). *Statistically significant differences (p < 0.05) between miR-663a mimics- or inhibitor-treated groups and their controls. (E and F) Qualification of EDU-positive cells in the human SSC line affected by miRNA mimics control, miR-663a mimics (E), miRNA inhibitor control, and miR-663a inhibitors (F) in human SSCs. (G) Western blots demonstrated PCNA expression in human SSCs at day 3 after transfection of miRNA mimic control, miR-663a mimics, miRNA inhibitor control, and miR-663a inhibitor. ACTB served as the loading control of protein. (H) The relative expression of PCNA in human SSCs at day 3 after transfection of miR-663a mimics to miRNA mimics control and miR-663a inhibitor to miRNA inhibitor control through normalization to the signals of their loading control. *Statistically significant differences (p < 0.05) between miR-663a mimic- or inhibitor-treated groups and their controls.
Figure 5
Figure 5
Effect of Overexpression and Knockdown of MiR-663a on the Apoptosis of Human SSCs (A–C) APC Annexin V and PI staining and flow cytometry depicted the percentages of early apoptosis in human SSCs transfected with miRNA mimics control (A and C) and miR-663a mimics (B and C). (D–F) APC Annexin V and PI staining and flow cytometry depicted the percentages of early apoptosis in human SSCs transfected with miRNA inhibitor control (D and F) and miR-663a inhibitor (E and F). *Statistically significant differences (p < 0.05) between miR-663a mimics- or inhibitor-treated groups and their respective controls (C and F).
Figure 6
Figure 6
Identification and Verification of the Target NFIX of MiR-663a in Human SSCs (A) Schematic diagram illustrated the binding site of miR-663a to NFIX mRNA. (B) Real-time qPCR demonstrated NFIX expression changes in human SSCs at day 2 after transfection of miRNA mimics control, miR-663a mimics, miRNA inhibitor control, and miR-663a inhibitor. (C) Western blots depicted level of NFIX protein in human SSCs at day 3 after transfection of miRNA mimics control, miR-663a mimics, miRNA inhibitor control, and miR-663a inhibitor (left panel). ACTB served as the control of loading proteins. The relative expression levels of NFIX protein in human SSCs at day 3 after transfection of miR-663a mimics to miRNA mimics control and miR-663a inhibitor to miRNA inhibitor control after normalization to the signals of their loading control (right panel). (D) Validation of the targeting of miR-663a to NFIX by dual luciferase reporter assays. (E) Validation of the binding of miR-663a to mutated NFIX by dual luciferase reporter assays.*Statistically significant differences (p < 0.05) between miR-663a mimics- or inhibitor-treated group and the corresponding control.
Figure 7
Figure 7
Influence of NFIX Silencing on the Proliferation, DNA Synthesis, and Apoptosis of Human SSCs (A) Real-time qPCR showed changes of NFIX mRNA by NFIX siRNA 1, NFIX siRNA 2, and NFIX siRNA 3 in the human SSC line. (B) Western blots revealed changes of NFIX protein by NFIX siRNA 1, NFIX siRNA 2, and NFIX siRNA 3 in human SSCs. *Statistically significant differences (p < 0.05) of NFIX siRNA 1-, 2-, and 3-treated cells compared with the control siRNA. (C–E) EDU incorporation assay demonstrated the percentages of EDU-positive cells affected by control siRNA (C and E) and NFIX siRNA 3 (D and E) in human SSCs. Scale bars, 50 μm (C and D). *Statistically significant differences (p < 0.05) between NFIX siRNA 3-treated cells and the control siRNA. (F) CCK-8 assays showed the growth curve of human SSCs treated with control siRNA and NFIX siRNA 3 for 5 days. *Statistically significant differences (p < 0.05) between control siRNA and NFIX siRNA 3. (G and H) Western blots illustrated the changes of PCNA protein in human SSCs at day 3 after transfection of control siRNA, NFIX siRNA 1, NFIX siRNA 2, and NFIX siRNA 3. ACTB served as the control of the loading proteins. The relative protein level of PCNA in human SSCs at day 3 after transfection of NFIX siRNA 1, NFIX siRNA 2, and NFIX siRNA 3 to control siRNA through normalization to the signals of their loading control was shown. *Statistically significant differences (p < 0.05) between NFIX siRNA-treated groups and the control siRNA. (I–K) APC Annexin V and PI staining and flow cytometry depicted the percentages of early apoptosis in human SSCs transfected with control siRNA (I and K) and NFIX siRNA 3 (J and K). *Statistically significant differences (p < 0.05) between control siRNA and NFIX siRNA 3.
Figure 8
Figure 8
The Effects of MiR-663a Inhibitor and NFIX Silencing on DNA Synthesis and Proliferation of Human SSCs (A–D) EDU incorporation assay showed the percentages of EDU+ cells in the human SSC line treated with miRNA inhibitor control (A and D), miR-663a inhibitor (B and D), as well as miR-663a inhibitor and NFIX siRNA 3 (C and D). Scale bars, 50 μm (A–C). (E) CCK-8 assay displayed the proliferation of human SSC line treated with miRNA inhibitor control, miR-663a inhibitor, and miR-663a inhibitor and NFIX siRNA 3 for 5 days. *Statistically significant differences (p < 0.05).
Figure 9
Figure 9
The Effects of MiR-663a and NFIX Silencing on Apoptosis of Human SSCs (A–I) TUNEL assay revealed the percentages of TUNEL+ cells in the human SSC line treated with miRNA mimics control (A and F), miR-663a mimics (B and F), miRNA inhibitor control (C and G), miR-663a inhibitor (D and G), as well as miR-663a inhibitor and NFIX siRNA 3 (E and G), control siRNA (H and I), and NFIX siRNA 3 (H and I). Scale bars, 50 μm (A–E and H). (E) *Statistically significant differences (p < 0.05).
Figure 10
Figure 10
The Effect of MiR-663a on Levels of Cell Cycle Regulators Cyclin A2, Cyclin B1, Cyclin E1, and CDK2 in Human SSCs (A) Western blots showed the changes of Cyclin A2, Cyclin B1, Cyclin E1, and CDK2 proteins in human SSCs at day 3 after transfection of miRNA mimics control, miR-663a mimics, miRNA inhibitor control, and miR-663a inhibitor. ACTB served as the control of the loading proteins. (B–E) The relative levels of Cyclin A2 (B), Cyclin B1 (C), Cyclin E1 (D), and CDK2 (E) proteins in human SSCs at day 3 after transfection of miR-663a mimics to miRNA mimics control and miR-663a inhibitor to miRNA inhibitor control through normalization to the signals of their loading control. *Statistically significant differences (p < 0.05) between miR-663a mimics- or inhibitor-treated group and the corresponding control.
Figure 11
Figure 11
The Influence of NFIX and Cell Cycle Genes’ Silencing on the Levels of Cyclin A2, Cyclin B1, and Cyclin E1 in Human SSCs (A–D) Western blots illustrate the changes of Cyclin A2 (A and B), Cyclin B1 (A and C), and Cyclin E1 (A and D) in the human SSC line treated with control siRNA and NFIX siRNA. (E–J) Western blots show the modification of Cyclin A2 (E and F), Cyclin B1 (G and H), and Cyclin E1 (I and J) in the human SSC line treated with control siRNA and the siRNAs against cell cycle genes. *Statistically significant differences (p < 0.05).
Figure 12
Figure 12
The Effect of Cyclin A2, Cyclin B1, and Cyclin E1 Knockdown on the Proliferation of Human SSCs (A and B) Western blots show the level of PCNA in the human SSC line with treatment of Cyclin A2, Cyclin B1, and Cyclin E1 siRNAs. (C) CCK-8 assay displayed the cell number of the human SSC line affected by Cyclin A2, Cyclin B1, and Cyclin E1 siRNAs in the human SSC line for 5 days. *Statistically significant differences (p < 0.05).

Similar articles

Cited by

References

    1. Yang S., Ping P., Ma M., Li P., Tian R., Yang H., Liu Y., Gong Y., Zhang Z., Li Z., He Z. Generation of haploid spermatids with fertilization and development capacity from human spermatogonial stem cells of cryptorchid patients. Stem Cell Reports. 2014;3:663–675. - PMC - PubMed
    1. Kanatsu-Shinohara M., Inoue K., Lee J., Yoshimoto M., Ogonuki N., Miki H., Baba S., Kato T., Kazuki Y., Toyokuni S. Generation of pluripotent stem cells from neonatal mouse testis. Cell. 2004;119:1001–1012. - PubMed
    1. Seandel M., James D., Shmelkov S.V., Falciatori I., Kim J., Chavala S., Scherr D.S., Zhang F., Torres R., Gale N.W. Generation of functional multipotent adult stem cells from GPR125+ germline progenitors. Nature. 2007;449:346–350. - PMC - PubMed
    1. Kossack N., Meneses J., Shefi S., Nguyen H.N., Chavez S., Nicholas C., Gromoll J., Turek P.J., Reijo-Pera R.A. Isolation and characterization of pluripotent human spermatogonial stem cell-derived cells. Stem Cells. 2009;27:138–149. - PMC - PubMed
    1. Zhang Z., Gong Y., Guo Y., Hai Y., Yang H., Yang S., Liu Y., Ma M., Liu L., Li Z. Direct transdifferentiation of spermatogonial stem cells to morphological, phenotypic and functional hepatocyte-like cells via the ERK1/2 and Smad2/3 signaling pathways and the inactivation of cyclin A, cyclin B and cyclin E. Cell Commun. Signal. 2013;11:67. - PMC - PubMed