. 2018 Oct;35(7):691-705.
doi: 10.1007/s10585-018-9929-3. Epub 2018 Sep 8.

Heterogeneous distribution of trastuzumab in HER2-positive xenografts and metastases: role of the tumor microenvironment

Affiliations

Heterogeneous distribution of trastuzumab in HER2-positive xenografts and metastases: role of the tumor microenvironment

Jennifer Hazel Elizabeth Baker et al. Clin Exp Metastasis. 2018 Oct.

Abstract

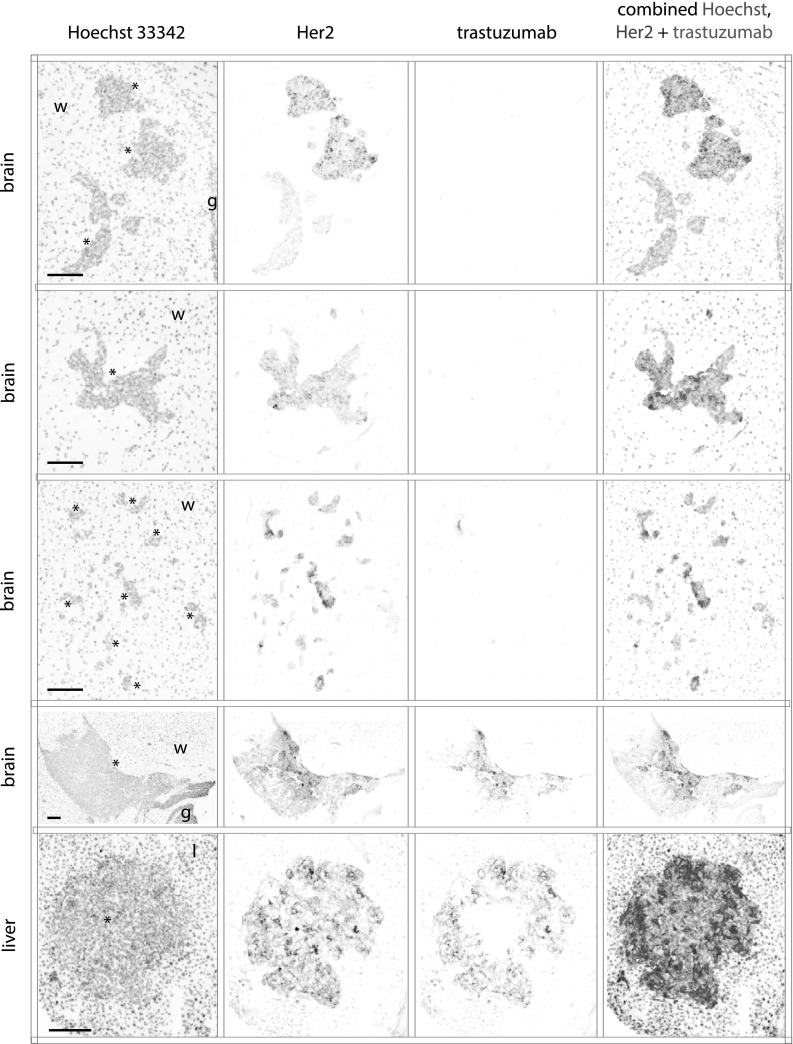
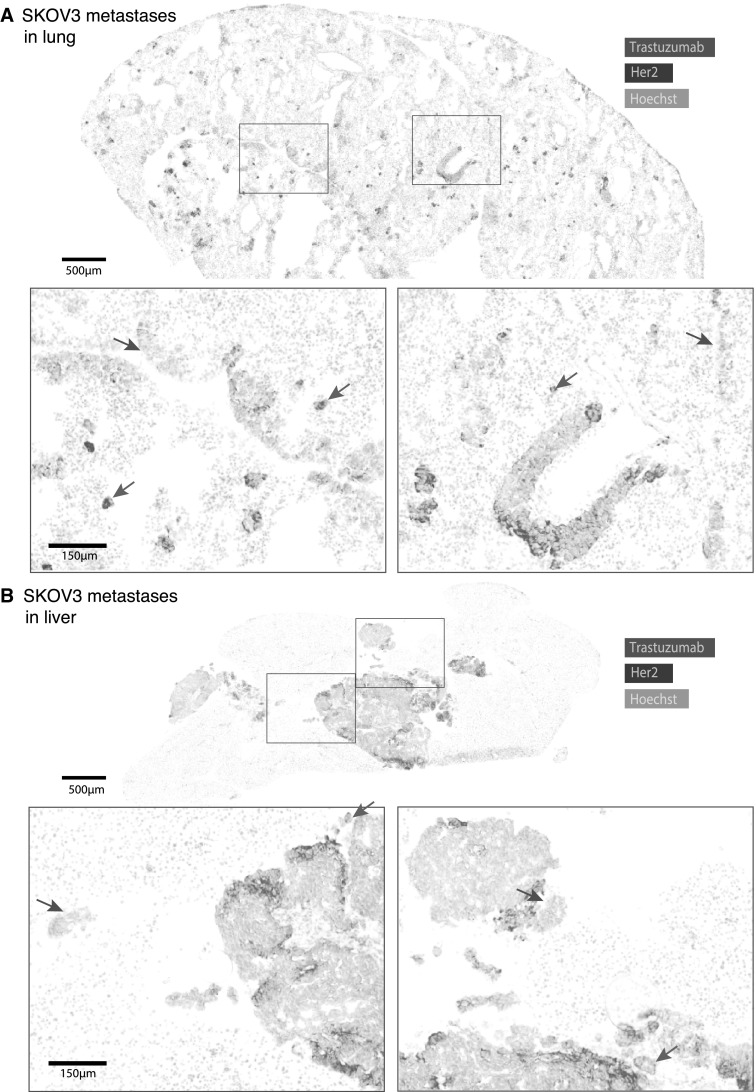
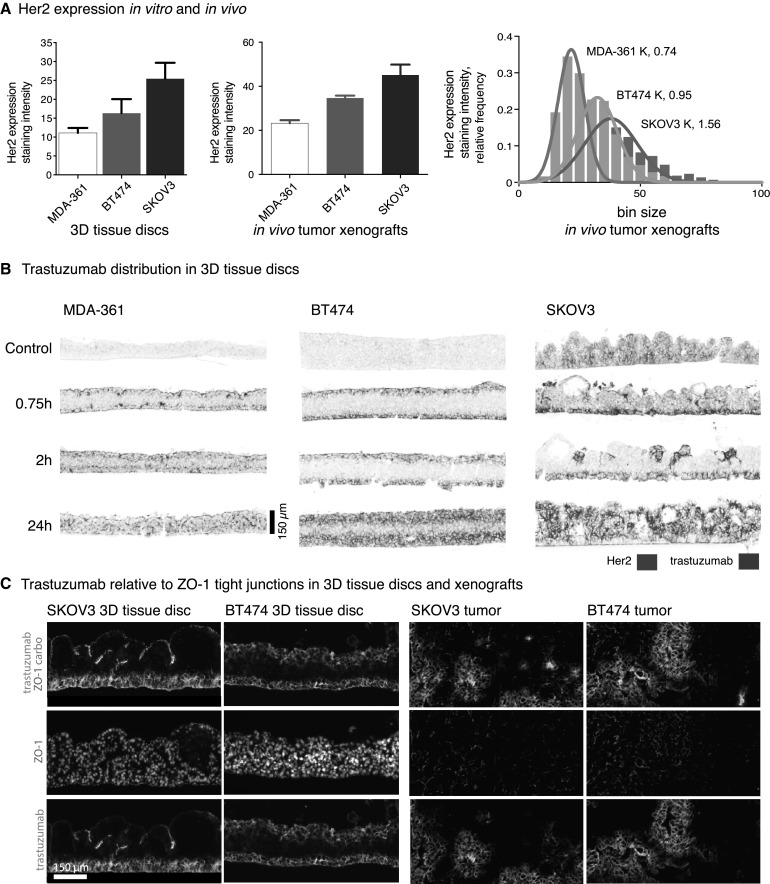
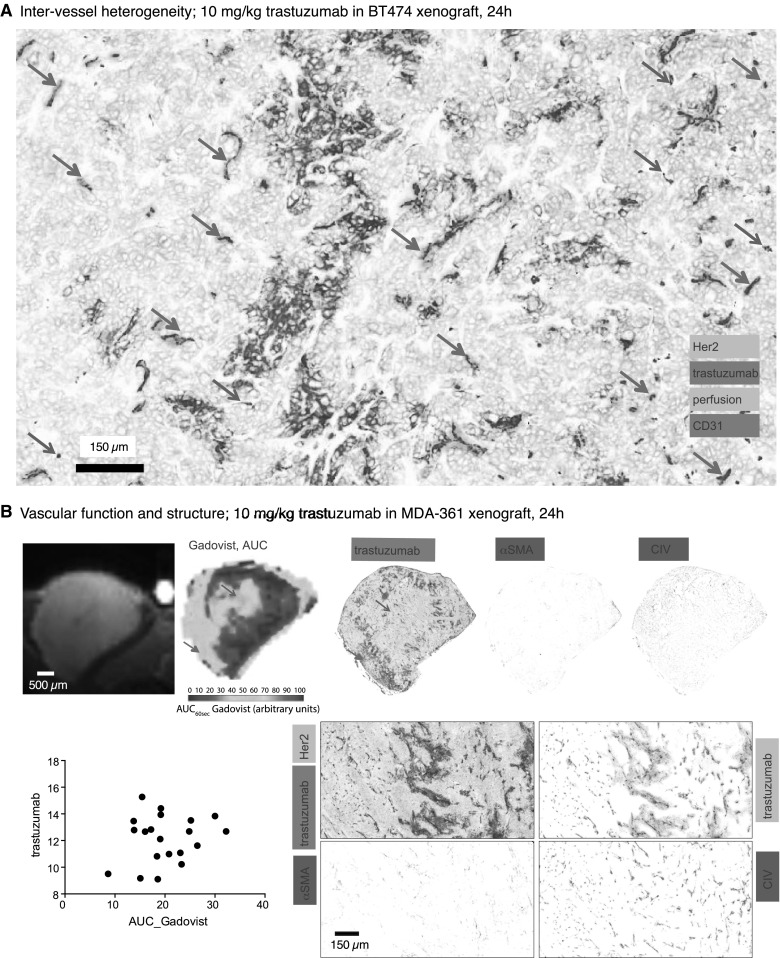
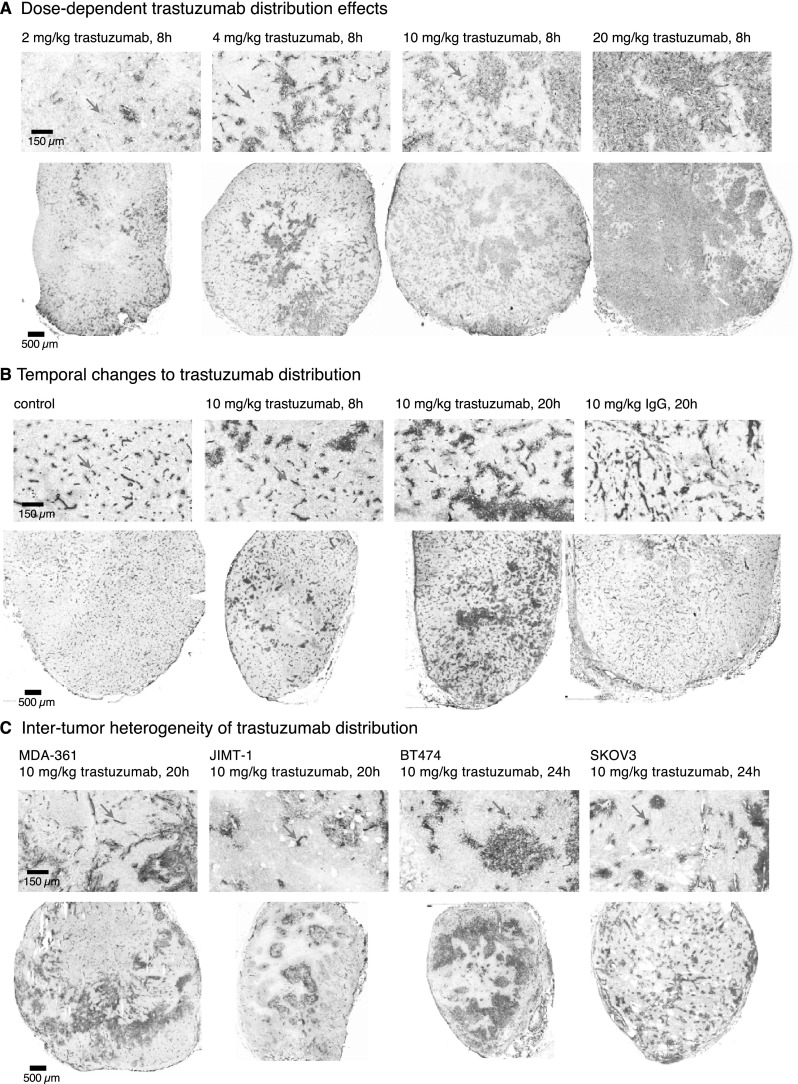
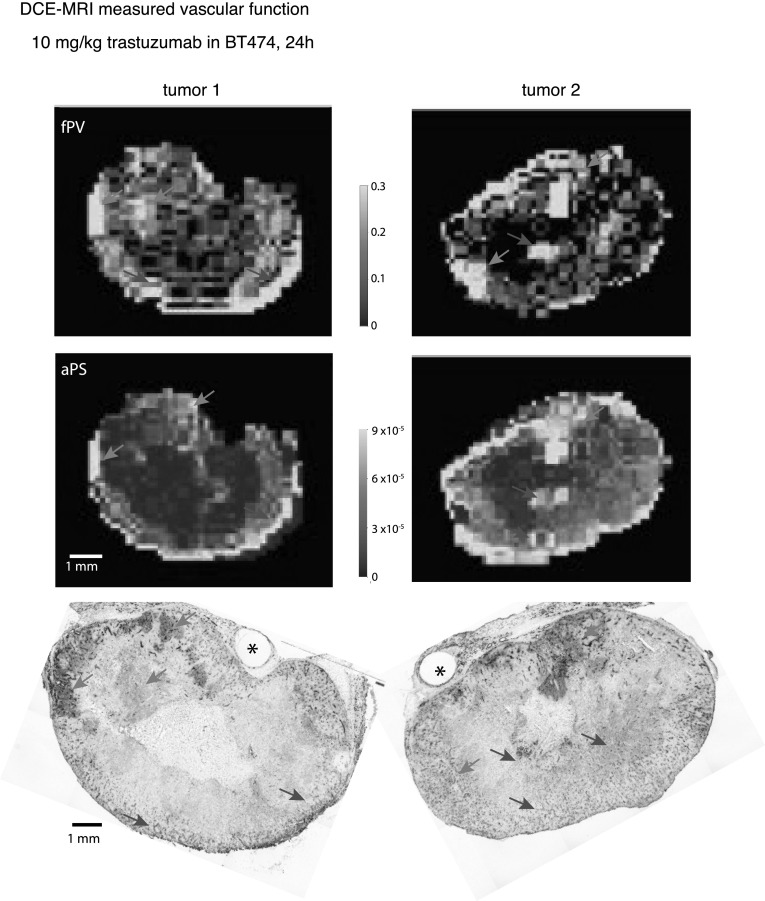
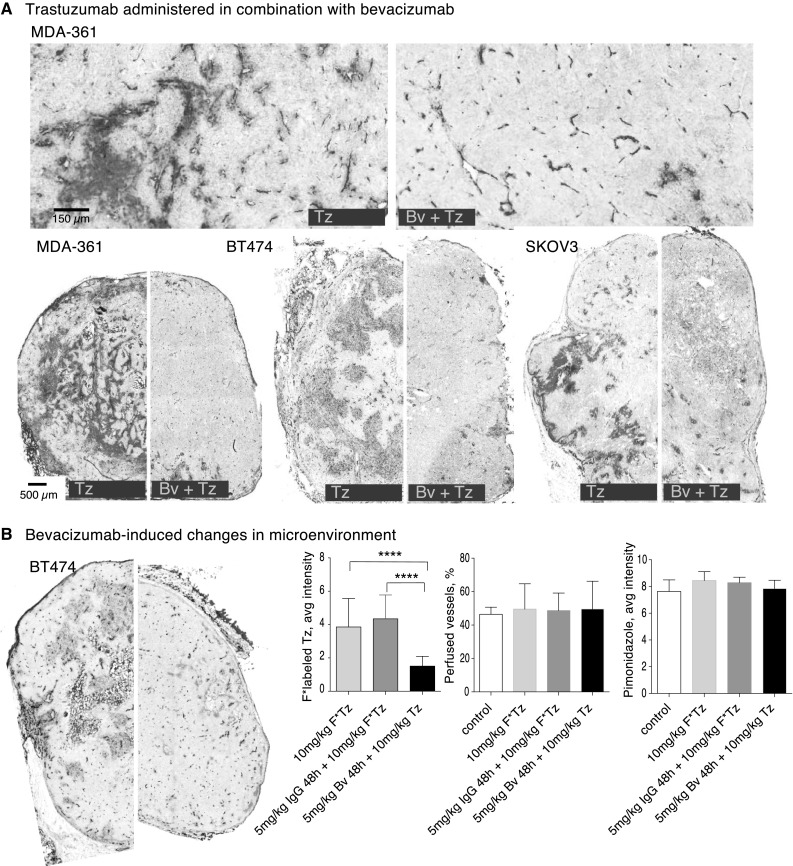
Most HER2-positive metastatic breast cancer patients continue to relapse. Incomplete access to all target HER2-positive cells in metastases and tumor tissues is a potential mechanism of resistance to trastuzumab. The location of locally bound trastuzumab was evaluated in HER2-positive tissues in vivo and as in vivo xenografts or metastases models in mice. Microenvironmental elements of tumors were related to bound trastuzumab using immunohistochemical staining and include tight junctions, vasculature, vascular maturity, vessel patency, hypoxia and HER2 to look for correlations. Trastuzumab was evaluated alone and in combination with bevacizumab. Dynamic contrast-enhanced magnetic resonance imaging parameters of overall vascular function, perfusion and apparent permeability were compared with matched histological images of trastuzumab distribution and vascular patency. Trastuzumab distribution is highly heterogeneous in all models examined, including avascular micrometastases of the brain and lung. Trastuzumab distributes well through the extravascular compartment even in conditions of high HER2 expression and poor convective flow in vivo. Microregional patterns of trastuzumab distribution in vivo do not consistently correlate with vascular density, patency, function or maturity; areas of poor trastuzumab access are not necessarily those with poor vascular supply. The number of vessels with perivascular trastuzumab increases with time and higher doses and dramatically decreases when pre-treated with bevacizumab. Areas of HER2-positive tissue without bound trastuzumab persist in all conditions. These data directly demonstrate tissue- and vessel-level barriers to trastuzumab distribution in vivo that can effectively limit access of the drug to target cells in brain metastases and elsewhere.

Keywords: Bevacizumab; Brain metastases; DCE-MRI; Drug distribution; HER2-positive metastases; HER2/neu; Herceptin; Monoclonal antibody therapeutic; Tumor microenvironment; Tumor vessel permeability.


Figures

Fig. 1
Fig. 1
Limited trastuzumab access to metastases of the brain. MDA-MB-231-BR-HER2 cells were implanted by intra-cardiac injection and grew as metastases in the brains and liver of NOD/SCID mice. Mice were treated with 5 mg/kg trastuzumab and tissues collected at 3 h. Fluorescent images of stained cryosections are inverted and shown in grey scale for Hoechst 33342 nuclear dye, HER2 receptor and bound trastuzumab, and all are overlaid in a false color image. Smaller brain micro-metastases (rows 1–3) ranging from small clusters of a few cells to 150 µm in maximum diameter had no detectable bound trastuzumab on the HER2-positive tissues. The largest HER2-positive brain lesion found (row 4) is > 1.5 mm in maximum diameter, and is the only lesion found in the brain with delivered, bound trastuzumab in a heterogeneous pattern. An example metastatic lesion in the liver (row 5) has trastuzumab access from the outside, distributing towards the centre. All scale bars 150 µm. (Color figure online)
Fig. 2
Fig. 2
Trastuzumab access to SKOV3 metastases of lung and liver. HER2-positive human SKOV3 ovarian carcinoma cells colonized the lungs of NOD/SCID mice following intravenous (i.v.) injection (a) or the liver following intra-peritoneal (i.p.) implantation (b), forming metastases of varying sizes. Mice were treated with 10 mg/kg trastuzumab (i.p.) and tissues collected at 20 h. Composite images depict HER2-positive cells (blue), Hoechst 33342 nuclear dye used to stain tissue sections (grey) and the location of bound trastuzumab (magenta). Very small metastases, particularly in the lung, are seen with trastuzumab bound to all extracellular surfaces (green arrows) while others have more heterogeneous trastuzumab distribution with areas of unexposed HER2-positive cells, and others may have very little or no detectable, bound trastuzumab (red arrows). Larger metastases formed in the liver, where microregional heterogeneity is evident despite drug access from both peritoneal and microvascular sources. (Color figure online)
Fig. 3
Fig. 3
Distribution of MAbs in 3D tissue models in vitro. a Relative HER2 expression in human cancer models in vivo as 3D tissue discs (left) and in vivo as xenografted tumors in mice (middle) shows a similar pattern of MDA-MB-361 tissues with the least and SKOV3 tissues with the most HER2 staining. Distribution of HER2 staining also varies within tumors, with SKOV3 tumors having a wider distribution of intensities (right). b 3D tissue discs stained for trastuzumab and HER2 are oriented to show their basolateral side down and luminal sides up; inserts were immersed in media containing 50 µg/ml trastuzumab that accessed the tissues from both sides. Immunohistochemical staining is shown as false color images of bound trastuzumab (magenta) relative to HER2 expression (blue). Trastuzumab distributes through the tissue discs at similar rates despite varying HER2 expression in different models, reaching 150 µm within 24 h. SKOV3 tissue discs had limited distribution of trastuzumab from the lumen side. c Staining for tight junctions (ZO-1, red) shows a continuous barrier at the luminal side of SKOV3 tissue discs that is not present in BT474 discs, blocking access to trastuzumab. Similar staining of the models in vivo does not show a consistent pattern of higher ZO-1 staining in areas with poor trastuzumab access in either SKOV3 or BT474 tumors. (Color figure online)
Fig. 4
Fig. 4
Distribution of Tz in vivo relative to tumor blood vessels. a Magnified region of a BT474 xenograft grown orthotopically in inguinal mammary fat pad and treated with 10 mg/kg trastuzumab for 24 h. Trastuzumab extravasates from vessels heterogeneously, with many patent vessels showing no extravascular bound trastuzumab (green arrows) even when adjacent to other patent vessels that do have perivascular trastuzumab. Carbocyanine fluorescent dye (cyan) around CD31 stained vessels (blue) indicates patency; non-patent vessels are indicated (red arrows). b DCE-MR imaging of Gadovist accumulation (GadovistAUC60) in MDA-MB-361 tumors is compared with detailed histology mapping of matched histological sections. Regions with greatest AUC60(Gadovist), reflecting greatest vascular function, do not consistently correspond to areas of greater trastuzumab distribution (red arrow); this is also demonstrated quantitatively where matched slices were plotted for amount of bound trastuzumab and AUC60(Gadovist). The same sections were stained for vascular architectural markers αSMA and CIV (both shown in red), neither of which exhibit a pattern of distribution similar to the presence or absence of trastuzumab (whole sections top; zoomed in region below). (Color figure online)
Fig. 5
Fig. 5
Inter- and intra-tumor heterogeneity of trastuzumab distribution in HER2-positive xenografts. a Greater doses of trastuzumab result in increased accumulation in BT474 xenografts, with trastuzumab found around more patent vessels. However some heterogeneity persists even at 20 mg/kg, a dose that is 5× the typical clinical loading dose of trastuzumab. b Trastuzumab accumulation increases with increased exposure time as shown in the BT474 orthotopic xenografts, where the MAb is extravasating from more vessels at longer timepoints. Similar exposure to humanized isotype control antibody IgG suggests the non-targeted IgG has a more homogeneous distribution through the tissues (right). Labeling of hypoxia via pimonidazole staining (green) illustrates majority of hypoxic regions do not have overlapping trastuzumab stain (magenta), although this is not exclusive. Regions without hypoxia also show limited trastuzumab distribution. c Naturally HER2-overexpressing xenograft models of breast (BT474, JIMT-1, MDA-361) and ovarian (SKOV3) tumors grown in NOD/SCID mice were treated with 10 mg/kg trastuzumab by ip injection with tumors collected at 20–24 h. Significant heterogeneity is seen, with substantial amounts of HER2-positive tissue remaining unbound for trastuzumab in all four models. HER2-positive staining (grey) shows the relative homogeneity of receptor expression; large negative staining areas are necrosis or tissue gaps. Perfused vessels (carbocanine; cyan) that have an absence of perivascular bound trastuzumab are found in each model, at every dose level and at all timepoints (orange arrows). (Color figure online)
Fig. 6
Fig. 6
Dynamic measurements of vascular function relative to trastuzumab distribution. BT474 tumors were imaged in 7T Bruker MRI and uptake of HPG-GdF contrast agent (500 kDa) measured. Parameter maps show calculated values for fractional plasma volume (fPV) and apparent permeability surface area (aPS), reflecting vascular perfusion and permeability respectively. Matched histology sections are stained for bound trastuzumab (magenta) administered at 10 mg/kg 24 h prior to imaging and tissue collection, and for HER2 (grey), carbocyanine marker of perfusion (cyan) and for CD31 vasculature (blue). Areas of vascular function (MRI) and trastuzumab (histology) correlation are indicated (orange arrows) in both modalities; example areas of poor matching are also shown (red arrows). Stars indicate location of fiducial markers for multi-modal slice comparison. (Color figure online)
Fig. 7
Fig. 7
Bevacizumab decreases subsequent distribution of trastuzumab. Animals bearing MDA-MB-361, BT474 or SKOV3 tumors were treated with 5 mg/kg bevacizumab (Bv) for 48 h prior to 10 mg/kg doses of fluorescent-labeled trastuzumab (Tz). a The amount of trastuzumab (magenta) accumulation in the xenografts is reduced despite persistence of HER2 expression (grey) when Tz administration follows pre-treatment with Bv. The number and distribution of perfused vessels (carbocyanine, cyan; CD31, blue) remains similar, but fewer of these patent vessels have bound perivascular trastuzumab. b Reduced trastuzumab accumulation occurs despite absence of change in the density of perfused vessels or in the presence of poorly oxygenated tissues measured by staining for pimonidazole (green). (Color figure online)

Similar articles

Cited by

References

    1. Seal MD, Speers CH, O’Reilly S, Gelmon KA, Ellard SL, Chia SK. Outcomes of women with early-stage breast cancer receiving adjuvant trastuzumab. Curr Oncol. 2012;19:1–5. doi: 10.3747/co.19.960. - DOI - PMC - PubMed
    1. Bria E, Cuppone F, Fornier M, Nisticò C, Carlini P, Milella M, et al. Cardiotoxicity and incidence of brain metastases after adjuvant trastuzumab for early breast cancer: the dark side of the moon? A meta-analysis of the randomized trials. Breast Cancer Res Treat. 2008;109:231–239. doi: 10.1007/s10549-007-9663-z. - DOI - PubMed
    1. Kaplan MA, Ertugrul H, Firat U, Kucukoner M, İnal A, Urakci Z, et al. Brain metastases in HER2-positive metastatic breast cancer patients who received chemotherapy with or without trastuzumab. Breast Cancer. 2015;22:1–7. doi: 10.1007/s12282-013-0513-z. - DOI - PubMed
    1. Lai R, Dang CT, Malkin MG, Abrey LE. The risk of central nervous system metastases after trastuzumab therapy in patients with breast carcinoma. Cancer. 2004;101:810–816. doi: 10.1002/cncr.20418. - DOI - PubMed
    1. Murrell DH, Hamilton AM, Mallett CL, van Gorkum R, Chambers AF, Foster PJ. Understanding heterogeneity and permeability of brain metastases in murine models of HER2-positive breast cancer through magnetic resonance imaging: implications for detection and therapy. Transl Oncol. 2015;8:176–184. doi: 10.1016/j.tranon.2015.03.009. - DOI - PMC - PubMed

Publication types

MeSH terms

Grants and funding