. 2018 Oct 9;11(4):959-972.
doi: 10.1016/j.stemcr.2018.08.008. Epub 2018 Sep 6.

Inactivation of PLK4-STIL Module Prevents Self-Renewal and Triggers p53-Dependent Differentiation in Human Pluripotent Stem Cells

Affiliations

Inactivation of PLK4-STIL Module Prevents Self-Renewal and Triggers p53-Dependent Differentiation in Human Pluripotent Stem Cells

Tereza Renzova et al. Stem Cell Reports. .

Abstract

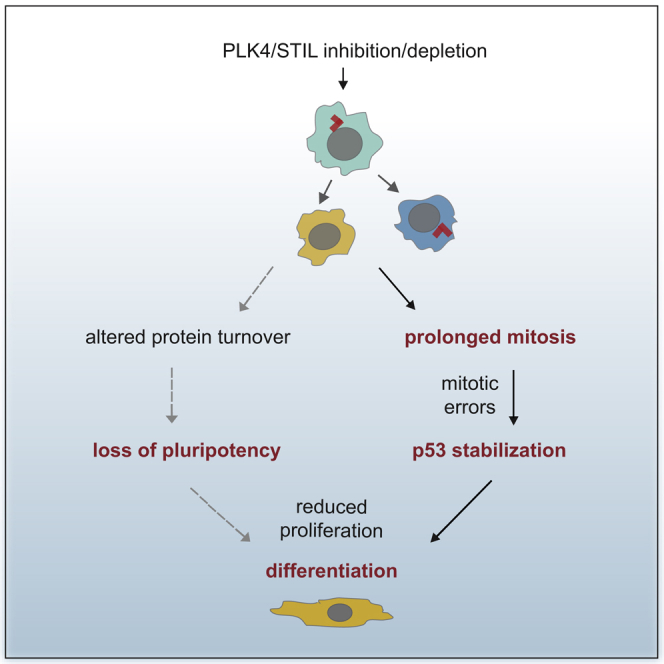
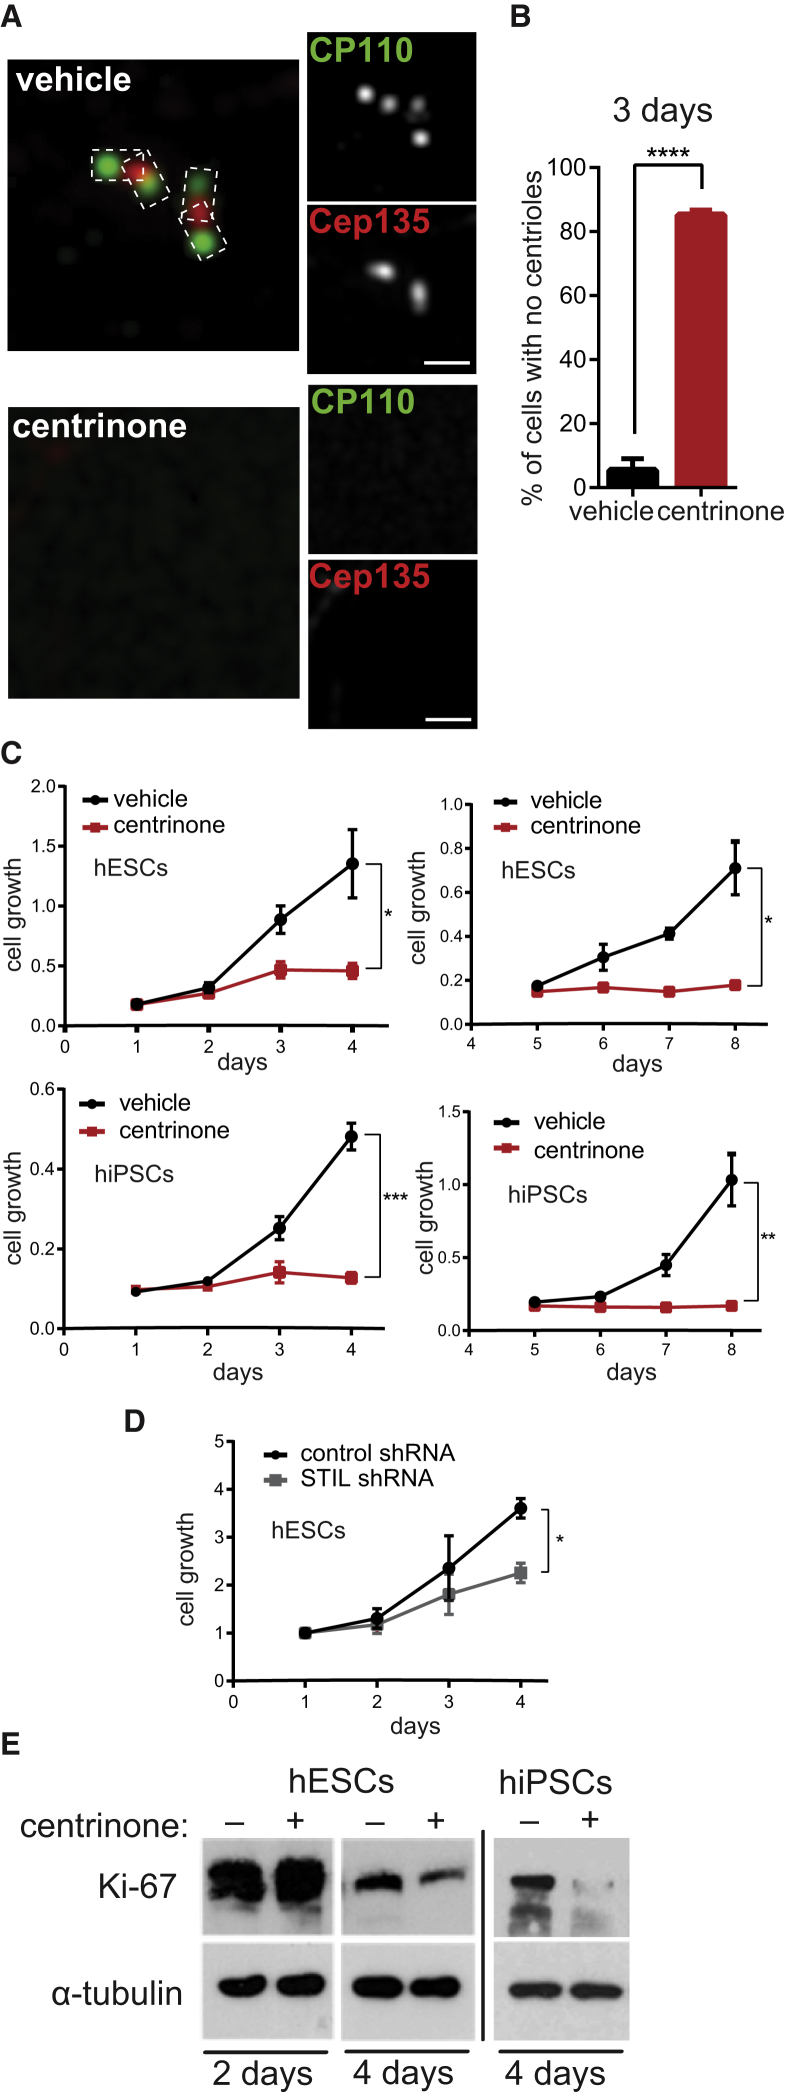
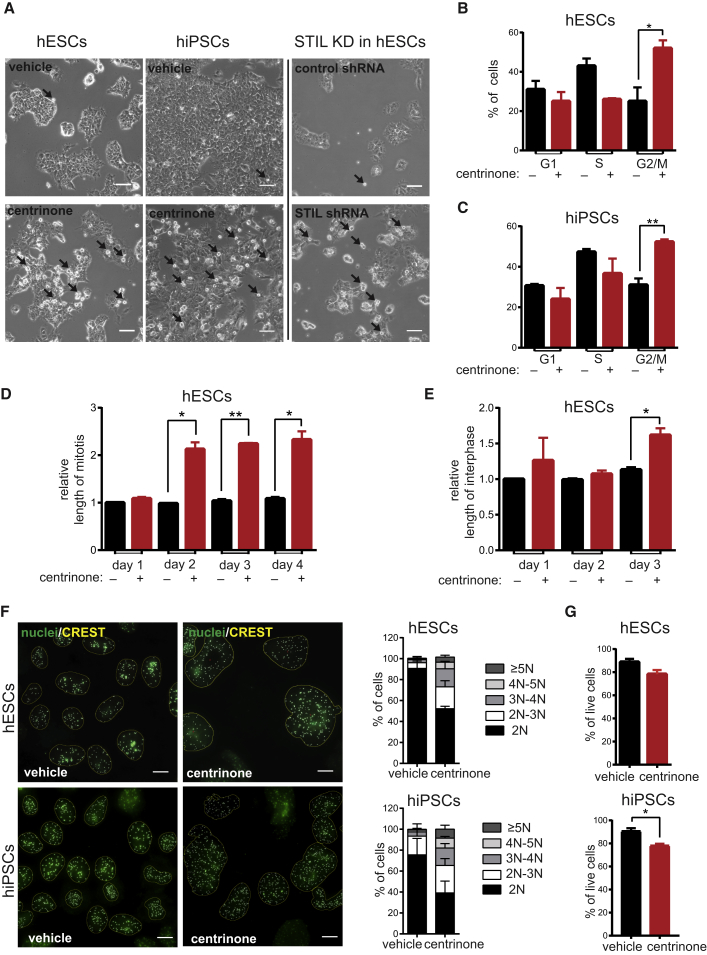
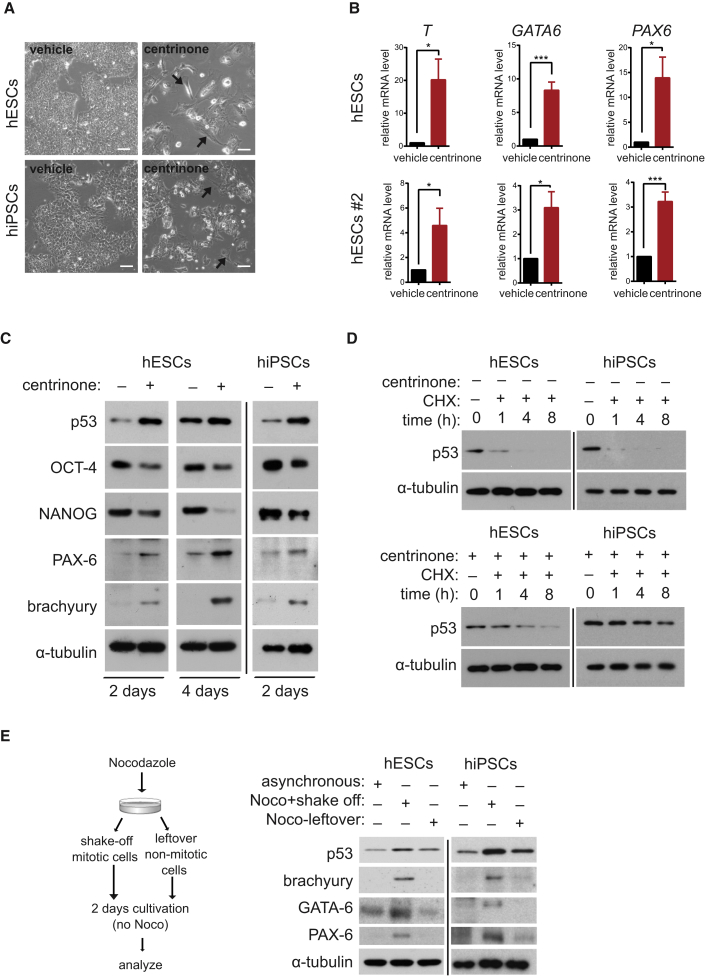
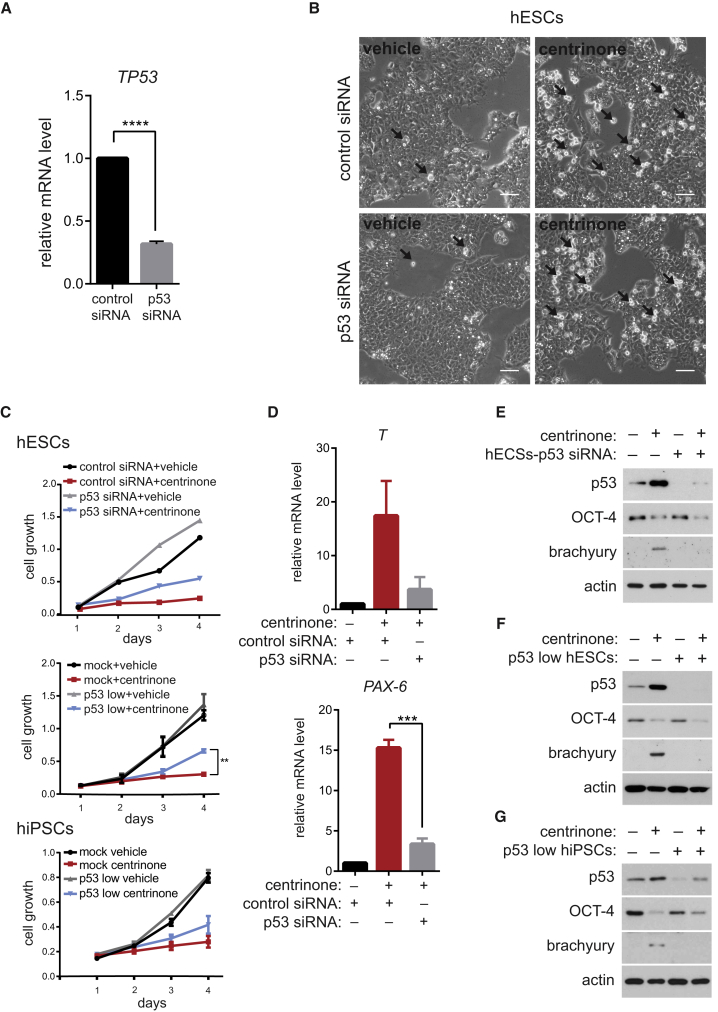
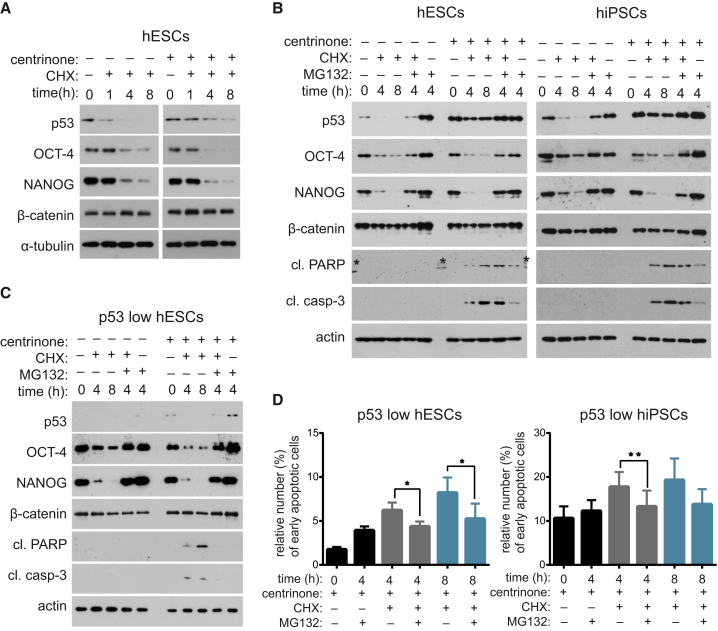
Centrioles account for centrosomes and cilia formation. Recently, a link between centrosomal components and human developmental disorders has been established. However, the exact mechanisms how centrosome abnormalities influence embryogenesis and cell fate are not understood. PLK4-STIL module represents a key element of centrosome duplication cycle. We analyzed consequences of inactivation of the module for early events of embryogenesis in human embryonic stem cells (hESCs) and human induced pluripotent stem cells (hiPSCs). We demonstrate that blocking of PLK4 or STIL functions leads to centrosome loss followed by both p53-dependent and -independent defects, including prolonged cell divisions, upregulation of p53, chromosome instability, and, importantly, reduction of pluripotency markers and induction of differentiation. We show that the observed loss of key stem cells properties is connected to alterations in mitotic timing and protein turnover. In sum, our data define a link between centrosome, its regulators, and the control of pluripotency and differentiation in PSCs.

Keywords: acentrosomal; cell cycle; centriole; centrosome; differentiation; pluripotency; self-renewal; stem cell.


Figures

None
Graphical abstract
Figure 1
Figure 1
Blocking of PLK4 or STIL Leads to Centrosome Loss Followed by Decreased Proliferation of Stem Cells (A and B) Immunofluorescence (A) of 3-day vehicle- and centrinone-treated hESCs: centrosomes were visualized by antibody staining of distal marker CP110 (green) and proximal marker Cep135 (red). Scale bars, 1 μm. (B) Quantification of centrosome depletion, N > 150. (C and D) Growth curves: cell number was measured at indicated time points by crystal violet assay, in vehicle- and centrinone-treated cells (C) or after STIL shRNA transfection (D). (E) Western blot analyses of Ki-67 expression in 4-day vehicle- and centrinone-treated cells, with α-tubulin as a loading control. Data are presented as mean ± SEM (p < 0.05, ∗∗p < 0.005, ∗∗∗p < 0.001, ∗∗∗∗p < 0.0001). See also Figure S1.
Figure 2
Figure 2
Centrosome Depletion Following PLK4 or STIL Blocking Leads to Prolonged Mitosis and Mitotic Defects (A) Phase-contrast images of 2-day vehicle- and centrinone-treated hESCs and hiPSCs or 2 days after STIL shRNA transfection. Arrows indicate mitotic cells. Scale bars, 50 μm. (B–E) Cell-cycle distribution of 3-day vehicle- and centrinone-treated hESCs (B) or hiPSCs (C) analyzed by FACS. Measurement of relative length of mitosis (D) or interphase (E) by live imaging of H2A-GFP hESCs after indicated time of treatment. Data are normalized to the vehicle treatment condition on day 1 (n = 2, N > 40). (F) Immunofluorescence analyses of centromere number in 4-day vehicle- or centrinone-treated hESCs and hiPSCs. Centromeres were visualized by CREST staining (yellow), nuclei were counterstained by Hoechst (green). Scale bars, 10 μm. Panels on the right show centromere quantification and corresponding intervals of chromosome numbers (n = 2, N > 90). (G) Quantification of viability measurement by annexin V/PI staining in 2-day vehicle- and centrinone-treated hESCs and hiPSCs. Data are presented as mean ± SEM (p < 0.05, ∗∗p < 0.005). See also Figure S2.
Figure 3
Figure 3
Blocking PLK4 or STIL Promotes Stem Cell Differentiation (A) Phase-contrast images of hESCs or hiPSCs after 8 or 4 days of treatment, respectively. Arrows point to observed morphological changes. Scale bars, 50 μm. (B) Analyses of mRNA levels of T, GATA6, and PAX6 in hESCs and hESCs #2 after 4 days of treatment. Data are presented as relative fold change over control. (C–E) Western blot analyses of hESCs and hiPSCs after indicated time of treatment, with α-tubulin as a loading control. (C) Analyses of effects on pluripotency and differentiation by the indicated antibodies. (D) Analyses of effects of treatment (2 days) on protein turnover of p53 after indicated time (hours) of inhibition of translation by cycloheximide (CHX). (E) Analyses of the effect of temporal mitotic arrest by 6 hr of nocodazole treatment. Left panel shows scheme of the experiment. Controls (asynchronous cells) and treated samples (Noco+shake off, Noco-leftover) were probed for protein levels of p53, brachyury, GATA-6, and PAX-6 2 days after nocodazole washout. Noco-leftover condition represents non-mitotic nocodazole-treated cells. Data are presented as mean ± SEM (p < 0.05, ∗∗∗p < 0.001). See also Figure S3.
Figure 4
Figure 4
Differentiation Induced by Blocking of PLK4 or STIL Is p53 Dependent Cells were transfected with either control or p53 siRNA, or the expression of p53 was permanently downregulated by CRISPR/Cas9 (p53 low cells) and subsequently treated as indicated. (A) Analyses of mRNA levels of TP53 after siRNA transfection in hESCs, showing the efficiency of p53 knockdown. Data are presented as relative fold change over control. (B) Phase-contrast images of hESCs following siRNA transfection and 2 days of treatment; black arrows indicate mitotic cells. Scale bars, 50 μm. (C) Number of cells in described conditions was measured at indicated time points by crystal violet assay and plotted as growth curves. First panel shows siRNA data (n = 1), second panel shows analyses of p53 low hESCs and their respective controls (n = 3), and third panel shows p53 low hiPSCs (n = 3). (D) Expression of differentiation markers (T and PAX6) after siRNA transfection and 4 days of treatment in hESCs, analyzed by qPCR. Data are presented as relative fold change over control (first column). (E–G) Western blot analyses of rescue of the centrinone treatment-induced effects by p53 downregulation either by siRNA (2 days of treatment, E) or CRISPR/Cas9 (p53 low hESCs/hiPSCs; 3 days of treatment, F and G). Samples were probed with indicated antibodies, with actin as a loading control. Data are presented as mean ± SEM (∗∗p < 0.005, ∗∗∗p < 0.001, ∗∗∗∗p < 0.0001).
Figure 5
Figure 5
Loss of Pluripotency after PLK4 Inhibition and Centrosome Depletion Is Linked to Altered Protein Turnover hESCs (mock: A and B, or p53 low: C and D) and hiPSCs (mock: B, or p53 low: D) were treated with centrinone (2 days) and indicated chemicals, and analyzed by western blot for protein expression (A–C) or by annexin V/PI staining for apoptosis (D). (A) Western blot analyses of centrinone treatment effect on protein turnover after block of protein synthesis for indicated time by cycloheximide (CHX). Note the increased turnover of OCT-4 and NANOG, and the decreased turnover of p53 in centrinone conditions. β-Catenin was included in all depicted experiments as additional control for specificity; α-tubulin/actin served as loading controls. (B and C) Analysis of rescue effects of inhibition of proteasome (MG132) on altered protein turnover following centrinone treatment (B). Where indicated, CHX was added together with MG132 for indicated time to analyze turnover rate of p53, OCT-4, NANOG, and β-catenin. Cleaved PARP and cleaved caspase-3 were used to probe for apoptosis (asterisks show non-specific antibody binding to marker). (C) Analysis of p53 low hESCs. (D) Viability measurement by annexin V/PI staining of p53 low hESCs/hiPSCs in the indicated conditions (hESCs, n = 4; hiPSCs, n = 3). Data are presented as mean ± SEM (p < 0.05, ∗∗p < 0.005). See also Figure S4.

Similar articles

Cited by

References

    1. Adewumi O., Aflatoonian B., Ahrlund-Richter L., Amit M., Andrews P.W., Beighton G., Bello P.A., Benvenisty N., Berry L.S., Bevan S. Characterization of human embryonic stem cell lines by the International Stem Cell Initiative. Nat. Biotechnol. 2007;25:803–816. - PubMed
    1. Aladjem M.I., Spike B.T., Rodewald L.W., Hope T.J., Klemm M., Jaenisch R., Wahl G.M. ES cells do not activate p53-dependent stress responses and undergo p53- independent apoptosis in response to DNA damage. Curr. Biol. 1998;8:145–155. - PubMed
    1. Allen M.A., Andrysik Z., Dengler V.L., Mellert H.S., Guarnieri A., Freeman J.A., Sullivan K.D., Galbraith M.D., Luo X., Kraus W.L. Global analysis of p53-regulated transcription identifies its direct targets and unexpected regulatory mechanisms. Elife. 2014;3 - PMC - PubMed
    1. Amps K., Andrews P.W., Anyfantis G., Armstrong L., Avery S., Baharvand H., Baker J., Baker D., Munoz M.B., Beil S. Screening ethnically diverse human embryonic stem cells identifies a chromosome 20 minimal amplicon conferring growth advantage. Nat. Biotechnol. 2011;29:1132–1146. - PMC - PubMed
    1. Andersen J.S., Wilkinson C.J., Mayor T., Mortensen P., Nigg E.A., Mann M. Proteomic characterization of the human centrosome by protein correlation profiling. Nature. 2003;426:570–574. - PubMed

Publication types

MeSH terms

Substances