. 2018 Dec 20;25(12):1443-1455.e14.
doi: 10.1016/j.chembiol.2018.08.004. Epub 2018 Sep 6.

Small Molecule Targeting of Specific BAF (mSWI/SNF) Complexes for HIV Latency Reversal

Affiliations

Small Molecule Targeting of Specific BAF (mSWI/SNF) Complexes for HIV Latency Reversal

Christine A Marian et al. Cell Chem Biol. .

Abstract

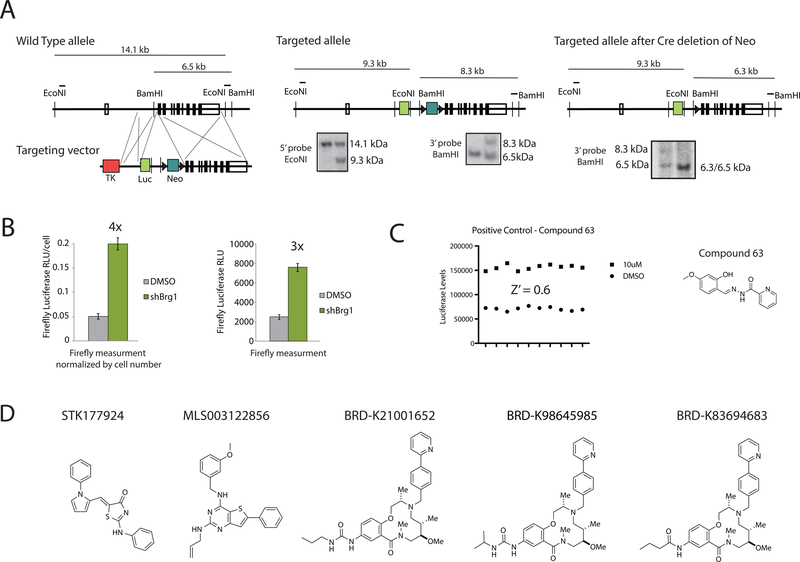
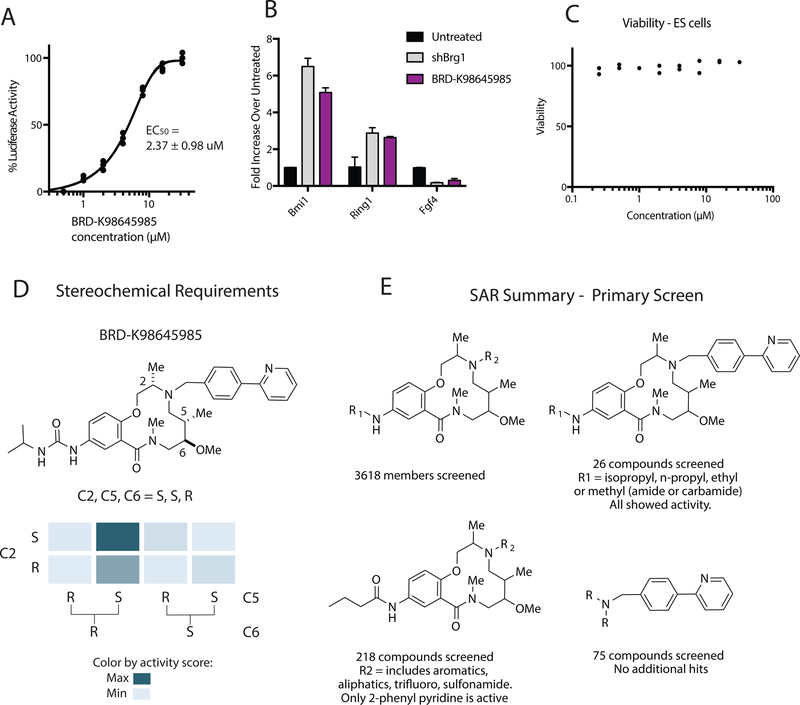
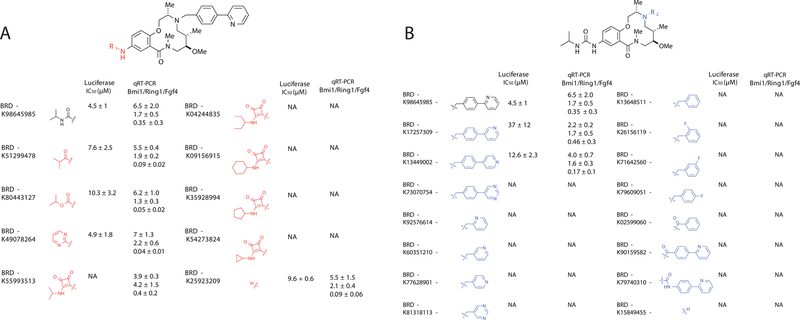
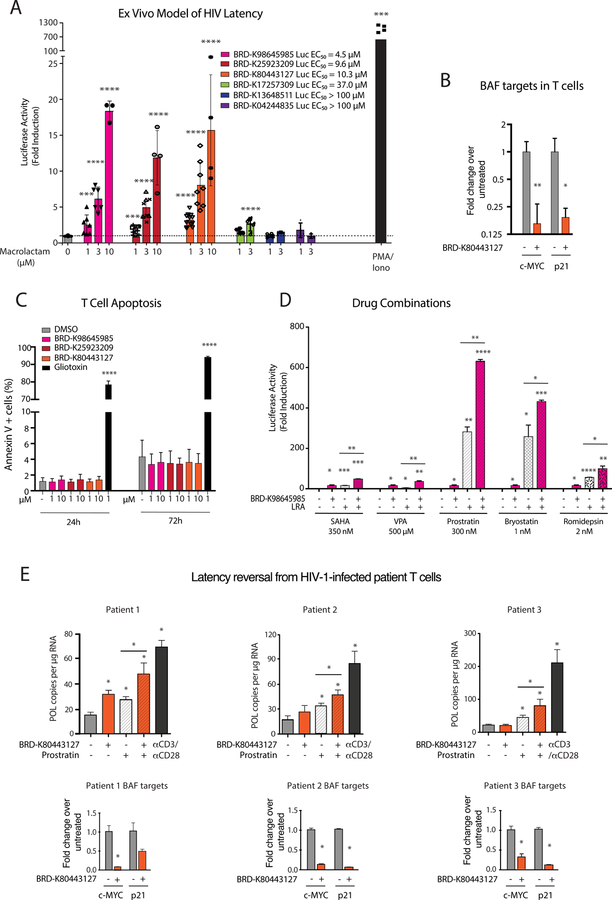
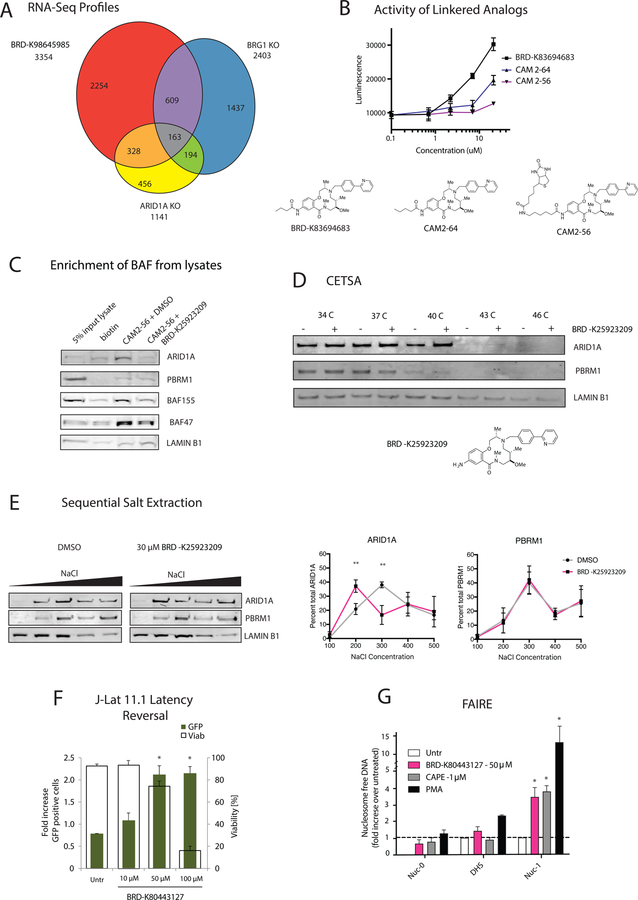
The persistence of a pool of latently HIV-1-infected cells despite combination anti-retroviral therapy treatment is the major roadblock for a cure. The BAF (mammalian SWI/SNF) chromatin remodeling complex is involved in establishing and maintaining viral latency, making it an attractive drug target for HIV-1 latency reversal. Here we report a high-throughput screen for inhibitors of BAF-mediated transcription in cells and the subsequent identification of a 12-membered macrolactam. This compound binds ARID1A-specific BAF complexes, prevents nucleosomal positioning, and relieves transcriptional repression of HIV-1. Through this mechanism, these compounds are able to reverse HIV-1 latency in an in vitro T cell line, an ex vivo primary cell model of HIV-1 latency, and in patient CD4+ T cells without toxicity or T cell activation. These macrolactams represent a class of latency reversal agents with unique mechanism of action, and can be combined with other latency reversal agents to improve reservoir targeting.

Keywords: ARID1A; BAF complex; HIV-1 latency; SWI/SNF; chromatin remodeling inhibitor; high-throughput screening.


Conflict of interest statement

Declaration of Interests: Gerald R. Crabtree is a co-founder of Foghorn Therapeutics.

Figures

Figure 1:
Figure 1:. High throughput screen for inhibitors of BAF-mediated transcriptional repression.
A. The generation of a luciferase knock-in at the Bmi1 locus using homologous recombination in mouse embryonic stem cells and validation using Southern blot analysis. B. Validation of the Bmi1-luciferase reporter cell line using lentiviral-mediated knockdown of Brg1 either with (above) or without (below) normalizing by cell number. C. The robustness of the screen was determined using positive control compound 63. D. The five hits identified from high throughput screening efforts. See also Figure S1.
Figure 2:
Figure 2:. 12-membered macrolactams are inhibitors of BAF-mediated transcription.
A. The EC50 was measured for the best screen hit BRD-K98645985 after 24 h compound treatment with the Bmi1-luciferase reporter cell line. Each concentration was dosed in triplicate. B. The fold change of the transcription of three BAF target genes was calculated using qRT-PCR after 18 h BRD-K98645985 treatment (30 µM) or Brg1 knockdown compared to untreated cells. C. Viability measurements in wild type ESCs were performed after 72 h of compound or DMSO treatment using CellTiter-Glo®. D. The structure activity relationship of the eight stereoisomers of BRD- K98645985 based on initial luciferase induction from the primary screen. E. The structure activity relationship of the 3618 macrolactam library members based on initial luciferase induction from the primary screen. See also Figure S2.
Figure 3:
Figure 3:. The structure activity relationship between members of a solution phase 12-membered macrolactam analog library:
A solution phase library of 30 analogs was synthesized and tested to further explore structure activity relationship for compounds with variations at A. the aniline (R1), and B. the secondary amine (R2). Activity was defined as the EC50 in the luciferase reporter screen and as the fold transcriptional change of three BAF targets (Bmi1, Ring1, Fgf4) at a single compound concentration (30 µM) determined using qRT-PCR. n = 3. Data presented as mean ± S.D. NA = no activity. See also Figure S3 and Table S1.
Figure 4:
Figure 4:. 12-membered macrolactams reactivate latent HIV-1 in primary model systems of HIV-1 latency and patient samples with limited toxicity or T-cell activation.
A. A panel of six macrolactams with varying EC50 values from the Bmi1-luciferase assay were tested in an ex vivo model of HIV-1 latency using primary CD4+ T cells from healthy donors (Lassen et al., 2012). Each point represents a single experiment using T cells from at least two different healthy donors. Luciferase levels are normalized with total protein levels. Error bars represent mean ± S.D. Asterisks indicate the level significance compared to untreated cells using student’s T test (* p< 0.05 ** p< 0.01, *** p< 0.001, **** p< 0.0001). B. mRNA expression levels of two BAF target genes were determined after treatment of CD4+ T cells isolated from 3 healthy donors with BRD-K80443127. Bars represent the average ± SD, Asterisks indicate the level significance compared to untreated cells using student’s T test (* p< 0.05 ** p< 0.01, *** p< 0.001, **** p< 0.0001). C. The number of apoptotic human primary CD4+ T cells in the presence of macrolactams was measured using Annexin V staining and flow cytometry analysis. Data presented as mean ± S.D. of experiments performed on cells isolated from 6 healthy donors. D. Latency reversal activity of BRD-K80443127 in combination with known LRAs was assessed in the ex-vivo model of HIV-1 latency. BRD-K80443127 was used at a concentration of 5 µM alone or in combination with known LRAs at a single dose. Luciferase levels are normalized with total protein levels. Data presented as mean ± S.D. of experiments performed in duplicate using cells from two healthy donors. Asterisks indicate the level significance compared to untreated cells using student’s T test (* p< 0.05 ** p< 0.01, *** p< 0.001, **** p< 0.0001). E. Cell associated HIV Pol mRNA levels were quantitated in CD4+ T cells obtained from three c-ART treated virologically suppressed HIV-1 infected patients after ex vivo treatment with BRD-K80443127 (10 µM), Prostratin (200 nM) or αCD3/αCD28 dynabeads as indicated in triplicate. Bars represent average of treatments in triplicate ± SD, asterisks indicate the level of significance using one-way ANOVA followed by Tukey test (p< 0.05). mRNA expression levels of biomarker genes of BAF activity, c-MYC and p-21 were also quantitated in the patient CD4+ T cells after treatment with DMSO or BRD-K80443127 (10 µM). See also Figure S4.
Figure 5:
Figure 5:. 12-membered Macrolactams are inhibitors of ARID1A-containing BAF complexes.
A. Differential gene expression of mESCs treated with 30 µM of BRD-K98645985 for 18 h was compared to published differential gene expression in Brg1 KO mESCs (King and Klose, 2017) to determine overlapping gene sets. Data was acquired from RNA-Seq analyses. B. The luciferase induction upon treatment with macrolactams with propyl amide (BRD-K83694683), butyl amide (CAM2–64) and biotin-hexylamide (CAM2–56) appended off the aniline was determined using the BMI1-luciferase reporter cell line. C. Pulldowns were performed from ESC lysates pretreated with DMSO or 200 µM BRD- K25923209 using biotin or CAM2–56 prebound to streptavidin resin. Protein enrichment was determined using immunoblot analysis. D. Protein stabilization by BRD-K25923209 was determined using CETSA in mESCs. The stabilization of ARID1A, PBRM1 and LAMINB1 was detected using immunoblot analysis of soluble proteins after incubation in a temperature gradient. E. Sequential salt extractions were performed on ESC nuclei. The chromatin was washed with increasing concentrations of salt containing DMSO or BRD-K98645985 (30 µM) and the elution of ARID1A and PBRM1 were analyzed using immunoblot analysis. The percent of protein elution was calculated across all five washes using ImageJ for ARID1A and PBRM1. n = 3. F. J-Lat 11.1 cells were treated with increasing concentrations of BRD-K80443127 and reactivation was quantitated at 48 h post treatment. Percent GFP positive cells (left axis, green bars), which corresponds to the level of HIV-1 activation, and cell viability (right axis, transparent bars) were both evaluated by flow cytometry. n = 3. G. Levels of nucleosome occupancy at the HIV-1 5’-LTR region following treatment with BRD-K80443127, CAPE, and PMA were analyzed using FAIRE assay. n = 3. Data are presented as mean ± S.D. Asterisks indicate the level significance compared to untreated cells using student’s T test (* p< 0.05 ** p< 0.01, *** p< 0.001, **** p< 0.0001). See also Figure S5.

Comment in

  • A BAF'ling Approach to Curing HIV.
    Tomar S, Ali I, Ott M. Tomar S, et al. Cell Chem Biol. 2018 Dec 20;25(12):1441-1442. doi: 10.1016/j.chembiol.2018.12.007. Cell Chem Biol. 2018. PMID: 30576660 Free PMC article.

Similar articles

Cited by

References

    1. Agbottah E, Deng L, Dannenberg LO, Pumfery A, and Kashanchi F (2006). Effect of SWI/SNF chromatin remodeling complex on HIV-1 Tat activated transcription. Retrovirology 3, 48. - PMC - PubMed
    1. Anders S, and Huber W (2010). Differential expression analysis for sequence count data. Genome Biol 11, R106. - PMC - PubMed
    1. Archin NM, Bateson R, Tripathy MK, Crooks AM, Yang KH, Dahl NP, Kearney MF, Anderson EM, Coffin JM, Strain MC, et al. (2014). HIV-1 Expression Within Resting CD4+ T Cells After Multiple Doses of Vorinostat. The Journal of Infectious Diseases 210, 728–735. - PMC - PubMed
    1. Archin NM, Liberty AL, Kashuba AD, Choudhary SK, Kuruc JD, Crooks AM, Parker DC, Anderson EM, Kearney MF, Strain MC, et al. (2012). Administration of vorinostat disrupts HIV-1 latency in patients on antiretroviral therapy. Nature 487, 482–485. - PMC - PubMed
    1. Auld DS, Thorne N, Nguyen D-T, and Inglese J (2008). A Specific Mechanism for Nonspecific Activation in Reporter-Gene Assays. ACS Chem. Biol 3, 463–470. - PMC - PubMed

Publication types

MeSH terms

Substances