. 2018 Sep 19;99(6):1145-1154.e6.
doi: 10.1016/j.neuron.2018.08.019. Epub 2018 Sep 6.

Cadherin Combinations Recruit Dendrites of Distinct Retinal Neurons to a Shared Interneuronal Scaffold

Affiliations

Cadherin Combinations Recruit Dendrites of Distinct Retinal Neurons to a Shared Interneuronal Scaffold

Xin Duan et al. Neuron. .

Abstract

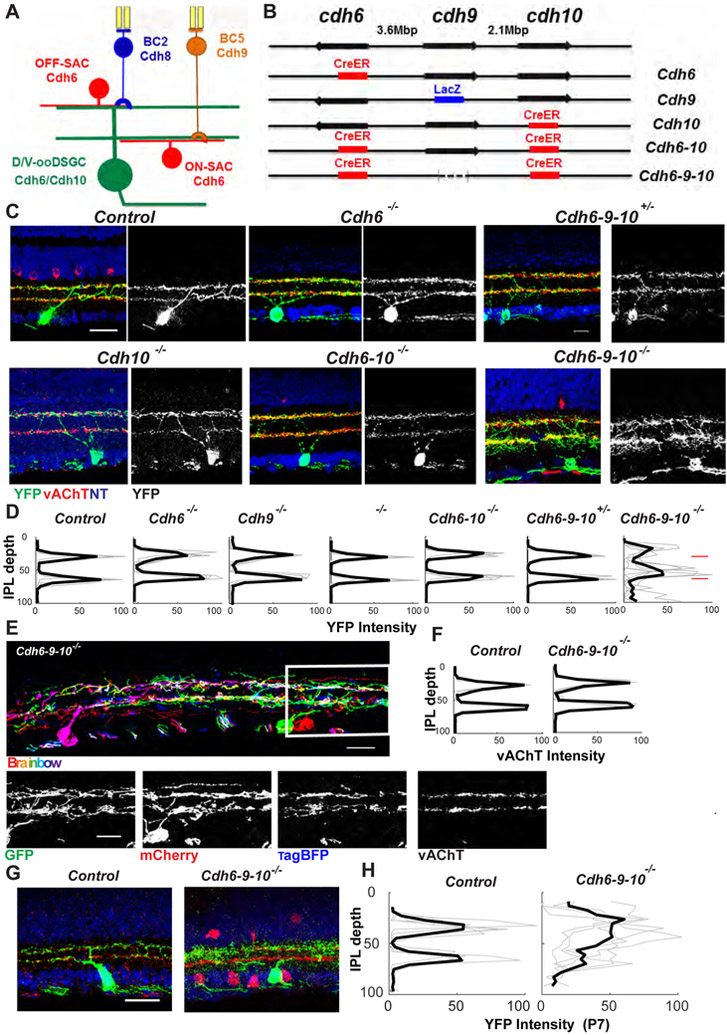
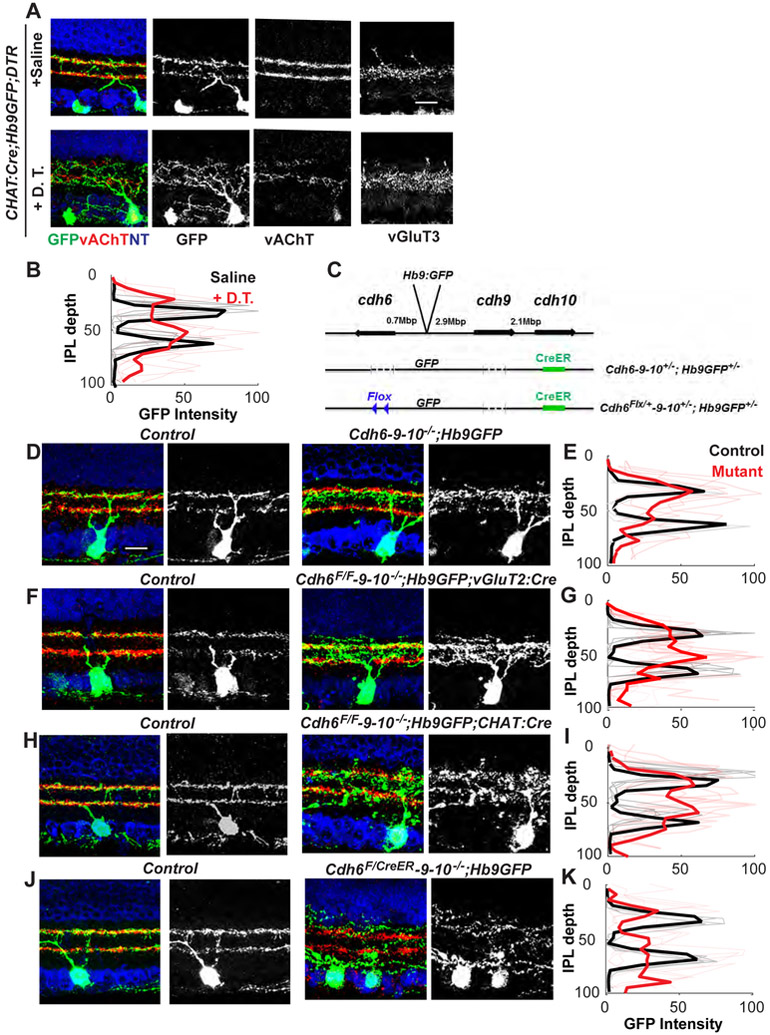
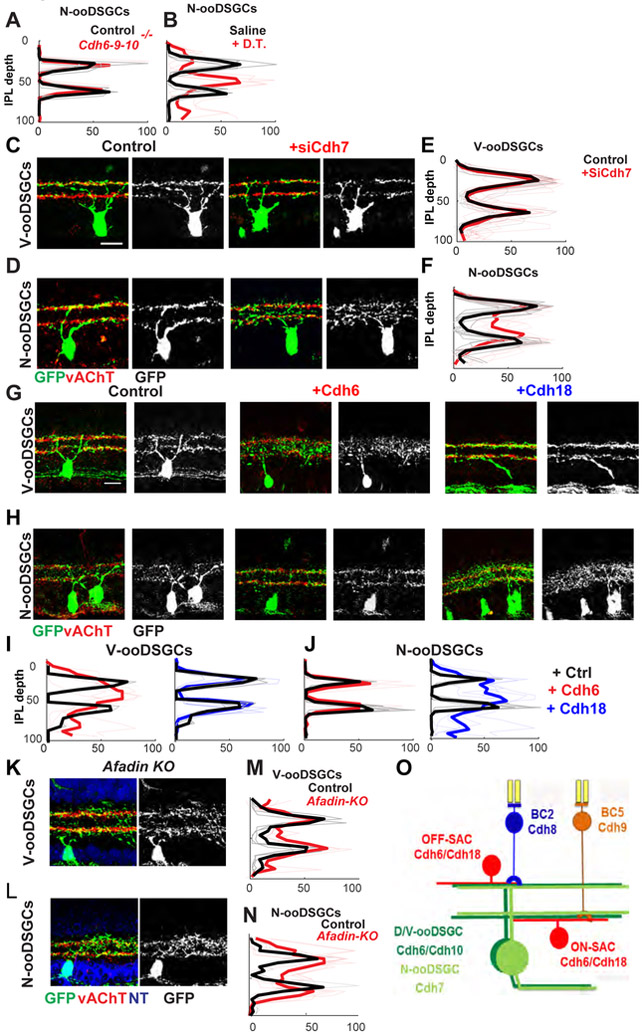
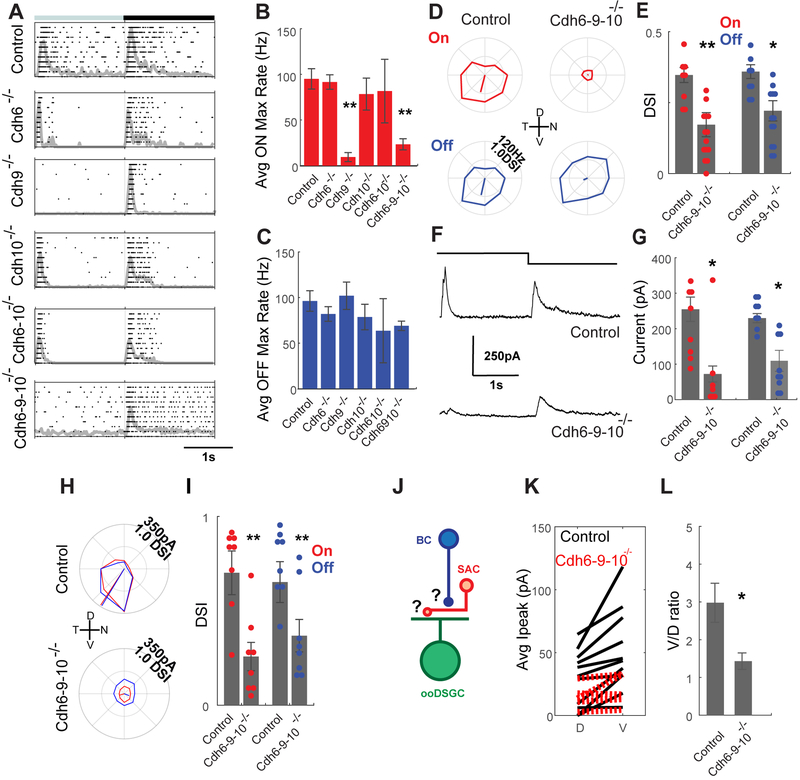
Distinct neuronal types connect in complex ways to generate functional neural circuits. The molecular diversity required to specify this connectivity could be supplied by multigene families of synaptic recognition molecules, but most studies to date have assessed just one or a few members at a time. Here, we analyze roles of cadherins (Cdhs) in formation of retinal circuits comprising eight neuronal types that inform the brain about motion in four directions. We show that at least 15 classical Cdhs are expressed by neurons in these circuits and at least 6 (Cdh6-10 and 18) act individually or in combinations to promote specific connectivity among the cells. They act in part by directing the processes of output neurons and excitatory interneurons to a cellular scaffold formed by inhibitory interneurons. Because Cdhs are expressed combinatorially by many central neurons, similar interactions could be involved in patterning circuits throughout the brain.

Keywords: Cdh10; Cdh6; Cdh9; adhesion; dendrite; retinal ganglion cell; starburst amacrine; synapse formation.


Figures

Figure 1.
Figure 1.. Cdh6, Cdh9 and Cdh10 pattern D/V-ooDSGC dendrites.
(A) Retinal ON-OFF direction-selective circuit, showing expression of Cdh6, Cdh8, Cdh9 and Cdh10 in bipolar cells (BCs), starburst amacrine cells (SACs) and dorsally and ventrally preferring ON-OFF direction selective retinal ganglion cells (D/V-ooDSGCs). (B) The cdh6-cdh9-cdh10 locus on mouse Chromosome 15 and mutant alleles used in C-H. CreER, tamoxifen-inducible cre-recombinase; LacZ, beta-galactosidase; dotted line, indel deletion. (C) ooDSGCs in control, Cdh6, Cdh10, Cdh6-10, Cdh6-9-10 mutants and Cdh6-9-10 heterozygotes at postnatal day (P) 21. ooDSGCs were labeled using a Cre-dependent reporter (YFP, green); sections were co-stained for vesicular acetylcholine transporter (vAChT, red) to label SAC dendrites and neurotrace (NT, blue) to visualize somata. Scale bar, 20 μm. (D) Mean YFP intensity (± SEM) of ooDSGC dendrites across the inner plexiform layer (IPL) from indicated genotypes, derived from images such as those in C (n≥10 cells from each of ≥5 mice of each genotype; light lines show data from individual mice and heavy lines show means). A similarity index (see Methods), was used to tested differences in lamination pattern across genotypes. Cdh6-9-10 mutants differed from the other 5 genotypes (p<0.01), which did not differ significantly from each other. (E) ooDSGCs in Cdh6-9-10 mutant retinas labeled using a Brainbow virus that marks individual cells in distinct colors. Separate channels are shown for the boxed region. Sections were also co-stained with anti-vAChT to label SAC dendrites (right panel). (F) Mean vAChT level (± SEM) of SAC dendrites across the IPL in control and Cdh6-9-10 mutant retinas, measured as in “D” from images such as those in C (n as in Fig. 1D) for SACs only. SACs in control and Cdh6-9-10 mutants do not differ significantly in lamination, assessed as in D. (G) D/V-ooDSGCs in control and Cdh6-9-10 mutant retinas at P7 labeled as in C Scale bar, 20 μm. (H) Mean YFP intensity (± SEM) of P7 D/V-ooDSGC dendrites across the inner plexiform layer (IPL) from control and Cdh6-9-10 mutant retinas, measured from images such as those in E (n as in Fig. 1D). Similarity score indicates that lamination in mutants differs significantly from controls (p<0.05). See also Figures S1 and S2.
Figure 2.
Figure 2.. Cadherins mediate interactions of V-ooDSGCs dendrites with an interneuronal scaffold.
(A) V-ooDSGCs in control retinas, and retinas from which SACs had been killed by diphtheria toxin (ChATcre;CAGS-stop-DTR;Hb9GFP). Sections were co-stained for vesicular acetylcholine transporter (vAChT, red) to label SAC dendrites and neurotrace (NT, blue) to visualize somata. Stratification of VG3 amacrine cells, marked with anti-VGlut3 in separate sections, is unaffected. Scale bar, 20 μm. (B) Mean GFP intensity (± SEM) of V-ooDSGC dendrites across the inner plexiform layer (IPL), derived from images such as those in A (n as in Fig. 1D). Lamination pattern of Cdh6-9-10 mutants is significantly different from that of controls (p<0.05; see Fig. 1 legend). (C) Cdh6-9-10;Hb9-GFP alleles generated using CRISPR/Cas9-based genome engineering (see also Fig. S1K, L). (D,F,H,J) V-ooDSGCs in control and mutant retinas at P21. Staining as in A. (E,G,I,K) Mean GFP intensity (± SEM) of ooDSGC dendrites across the IPL, derived from images such as those in D,F,H,J, respectively. Lamination pattern of mutants differ significantly from those of controls (p<0.05 for E,G,I and p<0.01 for K; see Fig. 1 legend). n as in Fig. 1D. Bar in D is 20μm.
Figure 3.
Figure 3.. Different cadherins mediate connectivity of V-ooDSGCs and N-ooDSGCs.
(A) Mean Drd4-GFP (N-ooDSGC) intensity (± SEM) across the IPL in control (black) and Cdh6-9-10 mutants (red), calculated from micrographs such as those in Fig. S3A and plotted as in Fig. 1D (n as in Fig. 1D). Similarity score indicates that lamination in Cdh6-9-10 mutants do not differ significantly from those in controls (N.S.). (B) Mean Drd4-GFP intensity (± SEM) across the IPL in control saline-injected (black) and diphtheria-toxin injected animals (red) calculated from micrographs such as those in Fig. S3B (n as in Fig. 1D). Difference in lamination between groups is significant (p<0.005). (C, D) V-ooDSGC (Hb9-GFP; C), N-ooDSGC (Drd4-GFP; D) and SAC dendrites (vAChT, red) in control and Cdh7 knockdown retinas at P14. (E, F) Hb9-GFP (E) or Dr4-GFP (F) intensity (± SEM) across the IPL in control (black) and Cdh7 knockdown (red) retinas (n≥10-12 cells from ≥3-4 mice of each group). Lamination in Cdh7 knockdown differs significantly from control for Drd4-GFP (p<0.005) but not Hb9-GFP. (G, H) V-ooDSGC (Hb9-GFP; F) or N-ooDSGC (Dr4-GFP; G) and SAC dendrites (vAChT, red) in retinas electroporated with control (RFP), Cdh6, or Cdh18 vectors. (I, J) Mean Hb9-GFP (H) and Dr4-GFP (I) intensity (± SEM) across the IPL in control (black), Cdh6 overexpression (red), and Cdh18 overexpression (blue) retinas (n as in Fig. 1D). Lamination of V-ooDGSC following overexpression of Cdh6 (p<0.05), and of N-ooDGSC following overexpression of Cdh18 differ from controls (p<0.05). Cdh6, Drd4-GFP and Cdh18, Hb9-GFP do not differ significantly from controls. (K, L) V-ooDSGC (Hb9-GFP, green, K) or N-ooDSGC (Drd4-GFP, green, L) and SAC dendrites (vAChT, red) in conditional Afadin mutant retinas (Cdh6CreER/+;Thy1-Stop-YFP; AfadinFlx/Flx) at P21. (M, N) Mean Hb9-GFP (M) and Drd4-GF) (N) intensity (± SEM) across the IPL in control (black) and Afadin mutants (red), calculated from micrographs such as those in K, L; n as in Fig. 1D). Lamination in mutant retinas differs significantly different from controls (p<0.05 for M, p<0.01 for N). (O) Summary of the expression pattern of Type II Cdhs that wire up parallel direction-selective circuits. Light-green for N-ooDSGCs (Drd4-GFP), dark-green for V-ooDSGCs (Hb9-GFP). See also Figure S3.
Figure 4.
Figure 4.. Cdh6-9-10 selectively regulate D/V-ooDSGC direction-selectivity.
(A) Spike raster plots from D/V-ooDSGCs in control, single, double and triple mutants retinas in response to a ~200μm flashing spot centered on the receptive field from 10 trials. ON responses are strongly reduced in the absence of Cdh9. (B, C) Average ON (B) and OFF (C) firing rates recorded from control (11 cells from 5 mice) and mutant (Cdh6 mutant, n=6; Cdh9 mutant, n=7; Cdh10 mutant, n=6; Cdh6-10 mutant, n=6; Cdh6-9-10 mutant, n=16 cells from 7 mice) D/V-ooDSGCs in response to stimulation as in (A). Cdh9 data are replotted from Duan et al. (2014). (D) Polar plots of spike responses from D/V-ooDSGCs in control and Cdh6-9-10 mutant retinae in response to a bright bar moving in 8 different directions. Leading edge (ON, red) and trailing edge (OFF, blue) responses are shown separately. Leading edge (ON) responses are strongly reduced and trailing edge (OFF) responses lose direction selectivity in Cdh6-9-10 mutant retinae. (E) Direction selective index (DSI) for experiments like those in (D) for controls (n=8 from 5 mice) and Cdh6-9-10 mutants (14 cells from 7 mice). (F) Sample outward currents recorded from D/V-ooDSGCs in controls (top) and Cdh6-9-10 mutants (bottom) retinae to a ~200μm flashing spot. (G) Average peak outward current for experiments like those in (F) for control (n=8 cells from 5 mice) and Cdh6-9-10 mutant (8 cells from 7 mice) in response to the onset (red) and offset (blue) of a flashing spot. Both ON and OFF inhibition are strongly reduced in Cdh6-9-10 mutant retinae. (H) Polar plot of inhibitory currents on an V-ooDSGC evoked by a bar moving in 8 directions in control (top) and Cdh6-9-10 mutant (bottom) retinae. Leading (ON, red) and trailing (OFF, blue) edge responses are shown separately. (I) Average DSI computed from experiments in (H) for control (n = 8 cells from 5 mice) and in Cdh6-9-10 mutant (8 cells from 7 mice) V-ooDSGCs. Outward currents are reduced in Cdh6-9-10 mutant retina and do not display directional tuning. (J) Direction-selective outward currents might be reduced because of a loss of BC input to SACs or might be reduced because of a loss of SAC-ooDSGC synapses. (K) Average SAC-evoked currents from stimulation of ChR2-positive SACs located dorsal (D) or ventral (V) of V-ooDSGCs in control (black, 11 cells from 5 mice) or Cdh6-9-10 mutant retinas (red, 5 cells from 5 mutants). (L) Ventral/Dorsal ratio for data shown in in (K). Bars in B,C,E,G,I and L show mean ± SEM. ** indicates p<0.01 and * indicated p<0.05 in B, E, G, I, L. See also Figure S4.

References

    1. Basu R, Duan X, Taylor MR, Martin EA, Muralidhar S, Wang Y, Gangi-Wellman L, Das SC, Yamagata M, West PJ, et al. (2017). Heterophilic Type II Cadherins Are Required for High-Magnitude Synaptic Potentiation in the Hippocampus. Neuron 96, 160–176 e168. - PMC - PubMed
    1. Beaudoin GM 3rd, Schofield CM, Nuwal T, Zang K, Ullian EM, Huang B, and Reichardt LF (2012). Afadin, a Ras/Rap effector that controls cadherin function, promotes spine and excitatory synapse density in the hippocampus. J Neurosci 32, 99–110. - PMC - PubMed
    1. Briggman KL, Helmstaedter M, and Denk W (2011). Wiring specificity in the direction-selectivity circuit of the retina. Nature 471, 183–188. - PubMed
    1. Buch T, Heppner FL, Tertilt C, Heinen TJ, Kremer M, Wunderlich FT, Jung S, and Waisman A (2005). A Cre-inducible diphtheria toxin receptor mediates cell lineage ablation after toxin administration. Nat Methods 2, 419–426. - PubMed
    1. Buffelli M, Burgess RW, Feng G, Lobe CG, Lichtman JW, and Sanes JR (2003). Genetic evidence that relative synaptic efficacy biases the outcome of synaptic competition. Nature 424, 430–434. - PubMed

Publication types