. 2018 Oct 8;47(1):53-66.e5.
doi: 10.1016/j.devcel.2018.08.007. Epub 2018 Sep 6.

Modulation of Asymmetric Division Diversity through Cytokinin and SPEECHLESS Regulatory Interactions in the Arabidopsis Stomatal Lineage

Affiliations

Modulation of Asymmetric Division Diversity through Cytokinin and SPEECHLESS Regulatory Interactions in the Arabidopsis Stomatal Lineage

Anne Vatén et al. Dev Cell. .

Abstract

Coordinated growth of organs requires communication among cells within and between tissues. In plants, leaf growth is largely dictated by the epidermis; here, asymmetric and self-renewing divisions of the stomatal lineage create two essential cell types-pavement cells and guard cells-in proportions reflecting inputs from local, systemic, and environmental cues. The transcription factor SPEECHLESS (SPCH) is the prime regulator of divisions, but whether and how it is influenced by external cues to provide flexible development is enigmatic. Here, we show that the phytohormone cytokinin (CK) can act as an endogenous signal to affect the extent and types of stomatal lineage divisions and forms a regulatory circuit with SPCH. Local domains of low CK signaling are created by SPCH-dependent cell-type-specific activity of two repressive type-A ARABIDOPSIS RESPONSE REGULATORs (ARRs), ARR16 and ARR17, and two secreted peptides, CLE9 and CLE10, which, together with SPCH, can customize epidermal cell-type composition.

Keywords: Arabidopsis; SPEECHLESS; cytokinin signaling; growth regulation; meristemoid behavior; peptide signaling; stomatal development.


Conflict of interest statement

Declaration of interests:

The authors declare no competing interests.

Figures

Figure 1.
Figure 1.
Cytokinin signaling is active in a subset of epidermal cells in the developing true leaf A) Diagrams of young (day 7) and nearly mature (day 12) leaf indicate how the stomatal lineage contributes to leaf cell production. Dispersed stomatal initiation events (pink) eventually produce ~80% of the cells in the leaf epidermis, -all GCs (30% total cells) and ~half of the pavement cells. B) Schematic representation of stomatal development: SPCH promotes asymmetric cell divisions.. Protodermal cells form meristemoid mother cells (MMC, pink), which divide asymmetrically (entry division). The smaller daughter (meristemoid, red) can continue asymmetric divisions (amplifying divisions) or differentiate to into a guard mother cell (GMC, orange), which divides symmetrically to produce paired stomatal guard cells (GCs, green). The larger daughter cell (stomatal lineage ground cell (SLGC), white) can also divide asymmetrically (spacing division) to form a meristemoid, or it can differentiate into a pavement cell (PC). C–H) Expression pattern of CK related markers (yellow) in the epidermis of true leaves in 7 day old seedlings. C) pAHK3–2x -YPET-N7, D) pLOG7–2x -YPET-N7, E) pCKX4–2x -YPET-N7, F) pARR16-ARR16-CFP, G) pARR22-YFP and H) pARR18-ARR18-YFP. I–K) Coexpression of SPCH and ARR16 in the epidermis of cotyledons in 3 day old seedlings. I) pSPCH-SPCHYFP, J) pARR16-ARR16-CFP and K) merged. L-M) CK reporter TCSn-GFP-ER in true leaves of 7 day old seedlings. N) Summary of key signaling elements and simplified logic of the CK pathway. CK biosynthetic enzymes ISOPENTENYL TRANSFERASEs (IPTs), activating enzymes LONELY GUYs (LOGs), and degradation enzymes (CYTOKININ OXIDASEs, CKXs) define CK levels. CK binding by HISTIDINE KINASE receptor (AHK) causes autophosphorylation of AHK, followed by transfer of phosphoryl group to a HISTIDINE PHOSPHOTRANSFER PROTEIN (AHP) and further, to a RESPONSE REGULATOR (ARR). Phosphorylated type-B ARRs bind to DNA and elicit transcriptional responses in the primary target genes of the CK pathway. Among targets are type-A ARRs, which are also phosphorylated by AHPs. Type-A ARRs reduce activation of the type-B ARRs, leading to attenuated CK response. GMC, guard mother cell; SLGC, stomatal lineage ground cell; GC, guard cell; Cell outlines (magenta) marked with Propidium Iodide (PI) in (C–H) and with pML1promCherry-RCI2A (I–M); scale bars in C–K and M, 10 μm; scale bar in L, 50 μm.
Figure 2.
Figure 2.
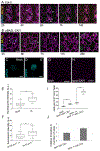
Manipulation of cytokinin levels and signaling alters epidermal cell division frequency A-C) Confocal images of 4 day old cotyledons with wild-type and altered CK levels. (A) Col-0, (B) pML1-CKX3, reduced CK, (C) pML1-IPT7, increased CK. Arrowheads in A point to recent cell divisions. (D) Quantification of epidermal cell number of lines in A-C (n=15/genotype). In the boxplot, horizontal lines indicate medians, boxes indicate quartiles above and below median, whiskers extend to most extreme value no more than 1.5 interquartile ranges from box. E–G) Confocal images of 4 day old cotyledons with altered CK levels in the early stomatal lineage. (E) pBASLCKX3, reduced CK (F) pBASL-IPT7, increased CK, (G) pBASL-CKI1, overactive CK signaling. H) Quantification of the epidermal cell number of lines in E–G (n=10/genotype). I–K) Confocal images of 4 day old cotyledons with altered CK levels in the mid stomatal lineage. (I) pMUTECKX3, reduced CK (J), pMUTE-IPT7, increased CK, (K) pMUTE-CKI1, overactive CK signaling. L) Quantification of the epidermal cell number of lines in I–K (n=10/genotype). M-N) DIC images of 7 day old Col-0 seedlings (M) mock treated or (N) exposed to a 24 hr pulse of 10 μM tZ. (O–P) Quantification of the epidermal cell number and SI of lines in M–N (n=18/genotype. **p<0.01, ***p<0.001 by Dunnett’s test (H, and L), Dunn’s test (D), or Student t-test (O-P). Scale bar in M–N, 50 mm; scale bars in other panels, 10 μm; arrows, young guard cell surrounded by unusual divisions in K. Cell outlines (in A–C, E–G, I–K) were marked with PI. See also Figure S2.
Figure 3.
Figure 3.
Activity of the endogenous CK signaling pathway is required to regulate divisions in the stomatal lineage A–C) Quantification of cotyledon epidermis phenotypes in Col-0 and CK degradation mutants ckx346 and ckx3456 (n=10/genotype) (A) cell number at 4 days (B) cell number at 10 days and (C) SI at 10 days. D) Fraction of SLGCs going through spacing divisions in 4 day old Col-0 (n=306) and ckx346 (n=619) on adaxial cotyledons. At least 13 cotyledons per genotype were scored. E-G) Quantification of cotyledon epidermis phenotypes in Col-0 and CK receptor mutants ahk3 cre; ahk2/+ ahk3 cre1; ahk2 ahk3 cre1 (E) cell number at 4 days (n=10/genotype) (F) cell number and (G) SI at 10 days (n=11/genotype). H) Fraction of SLGCs going through spacing divisions in 4 day old Col-0 (n=243), ahk3 cre (n=203), ahk2/+ ahk3 cre1(n=305), and ahk2 ahk3 cre1 (n=266) on adaxial cotyledons. At least 7 cotyledons per genotype were scored. I–K) Quantification of cotyledon epidermis phenotypes in Col-0 and type-A ARR mutants arr16, arr17, and arr16 arr17, (I) cell number at 4 days (n=11/genotype) (J) cell number and (K) SI in Col-0 and three arr16 arr17 alleles at 10 days (n=10/genotype). L) Fraction of SLGCs going through spacing divisions in 4 day old Col-0 (n=289) and three arr16 arr17 alleles (#1: n=303, #2: n=287 and, #3 n=292) on adaxial cotyledons. At least 7 cotyledons per genotype were scored. M) Quantification of SI in Col-0 and two independent lines overexpressing (OE) ARR16-YFP with the TMM promoter (n=11/genotype) at 10 day old cotyledon epidermis. N) Fraction of SLGCs going through spacing divisions in 4 day old Col-0 (n=465), and ARR16-OE (n=275) on adaxial cotyledons. At least 16 cotyledons per genotype were scored. O-P) Quantification of mature cotyledon phenotypes (O), stomatal density in Col-0, ahk2/+ ahk3 cre1, arr16 arr17 #1 and two independent ARR16-OE lines (n=9–12/genotype) and (P) number of stomata per organ in Col-0 and arr16 arr17 #1 at 21days. *p<0.05, **p<0.01, ***p<0.001 by Dunnett’s test (A-B, E, I-K, M, O), Dunn’s test (C, F, G) or by Mann Whitney test (P). See also Figure S3, Table S1, Table S2, and Table S4.
Figure 4.
Figure 4.
CK-related CLE9 and CLE10 peptides regulate SLGC cell proliferation capacity A-B) Expression patterns of pCLE9-YFP (A) and pCLE10-YFP (B) in true leaves of 7 day old seedlings. C-E) Confocal images of the 4 day old adaxial epidermis in Col-0 (C), cle9 cle10 (D) and cle9 cle10 pTMMARR16-YFP (ARR16-OE) (E). Cell outlines were marked with PI. F-G) Quantification of cotyledon epidermis phenotypes in Col-0 and cle9 cle10 (n=10/genotype) (F) cell number (G) and SI at 10 days. H) Quantification of spacing divisions in adaxial cotyledons of 4 day old seedlings in Col-0 (n=541), cle9 cle10 (n=819) and cle9 cle10 pTMM-ARR16-YFP (ARR16-OE) (n=345). At least 19 cotyledons per genotype were analyzed. I-J) Quantification of cotyledon epidermis phenotypes in Col-0, arr16 arr17, cle9 cle10, and arr16 arr17 cle9 cle10 (n=10/genotype) (I) cell number and (J) SI at 10 days. K) Quantification of spacing divisions in adaxial cotyledons of 4 day old seedlings in Col-0 (n=424), arr16 arr17 (n=428), cle9 cle10 (n=709), and arr16 arr17 cle9 cle10 (n=581). At least 12 cotyledons per genotype were analyzed. L-M) Quantification of total stomatal numbers in mature cotyledon in Col-0 and cle9 cle10 #1 (n=10–12/genotype) (L) number of stomata per organ and (M) stomatal density at 21days. Scale bars, 10 mm. *p<0.05, **p<0.01 by Student t-test (L), Mann-Whitney test (F-G, M) or Dunnett’s test (I-J). See also Figure S4, Table S1, Table S2, and Table S4.
Figure 5.
Figure 5.
CK signaling may influence stomatal divisions through modulation of SPCH expression A) Timelapse of pSPCH-SPCH-CFP; pMUTE-MUTE-YFP; pML1-mCherry-RC12A in 3 day old Col-0 and (B) pBASL-CKI1 cotyledons. Single asterisk, SPCH expressing cell divides; arrow, reduced SPCH expression in one of the daughter cells; arrowhead, increased SPCH levels in SLGC; two asterisks, divided SLGC. Timestamp indicated below each image. C–E) pSPCH-SPCH-CFP expression in SLGC nuclei following 5 hour Mock (C) or 10 mM tZ (D) treatment in 3 day adaxial cotyledons. E) Quantification of fluorescence intensity in lines shown in C (n=23) and D (n=26) (a.u., arbitrary unit). F) Quantification of fluorescence intensity of pSPCH-SPCH-YFP in in SLGC nuclei of 4 day old abaxial cotyledons of outcrossed heterozygous arr16 arr17 #1 −/+ (n=22) and backcrossed homozygous arr16 arr17 #1 (n=29). G) Confocal image of 4 day old cotyledon in spch and (H) spch pBASL-CKI1. Cell outlines were marked with PI. I) Quantification of total cell number and (J) relative increase in cell number per field of view in 4 day old spch with pBASL-CKI1 (n=15) and in Col-0 with pBASL-CKI1 (n=7) compared to same lines without transgenes (n=15 and n=7, respectively). Error bars in J indicate SD. Scale bars in A–B, 10 mm, and in C–J, 50 mm. ***p<0.001 by Mann-Whitney test. See also Figure S5 and Table S3.
Figure 6.
Figure 6.
Model of SPCH-CK feedback loop and its regulation of spacing divisions A-C) Model for the differential effects of SPCH and CK signaling on the three SPCH-driven asymmetric cell division types. A) In wild-type, ARR16/17 in SLGCs reduces their CK sensitivity and consequently, their likelihood of undergoing a spacing division. Stomatal lineage peptides CLE9/10 suppress SLGC divisions non-autonomously and potentially upstream of ARR16/17. Both CLE9 and ARR16 are directly induced by SPCH in meristemoids, but their division-suppressing effects manifest themselves in the meristemoid daughter cells (the SLGCs) where ARR16 persists. SPCH itself rapidly disappears in these SLGCs, but CK signaling promotes SPCH re-expression hence forming a feedback-loop where CK promotes SPCH expression, and in turn increases SLGC division likelihood. B) Lack of ARR16 and ARR17 or CLE9 and CLE10 leads to high CK signaling and increased SLGC division potential. C) Increased suppression of CK signaling by ARR16-OE leads to reduced SLGC divisions. Solid lines, confirmed interaction; dashed line, potential interaction; bold line, enhanced activity; grey line, reduced activity.
Figure 7.
Figure 7.
Model of meristemoid-dependent mechanism for generating flexible cell-type and leaf size distributions. Schematic representation of the different meristemoid division types, their effect on epidermal cell composition and how CK and CLE signaling participates in this process. A) Model centered on CK-CLE-SPCH regulatory loop (from Figure 6) with new inputs from known stomatal and environmental inputs and feedbacks. Solid lines, confirmed interaction; dashed line, potential interaction. B-C) Schematic representation of how different stomatal lineage asymmetric divisions define numbers and types of progeny cells (B) and how changes in division lead to changes in overall leaf development (C).

Similar articles

Cited by

References

    1. Adrian J, Chang J, Ballenger C, Bargmann BR, Alassimone J, Davies K, Lau O, Matos J, Hachez C, Lanctot A, et al. (2015). Transcriptome Dynamics of the Stomatal Lineage: Birth, Amplification, and Termination of a Self-Renewing Population. Dev. Cell 33, 107–118. - PMC - PubMed
    1. Arvidsson S, Kwasniewski M, Riano-Pachon DM, and Mueller-Roeber B (2008). QuantPrime--a flexible tool for reliable high-throughput primer design for quantitative PCR. BMC Bioinformatics 9, 465. - PMC - PubMed
    1. Bartrina I, Otto E, Strnad M, Werner T, and Schmülling T (2011). Cytokinin regulates the activity of reproductive meristems, flower organ size, ovule formation, and thus seed yield in Arabidopsis thaliana. Plant Cell 23, 69–80. - PMC - PubMed
    1. Bishopp A, Help H, El-Showk S, Weijers D, Scheres B, Friml J, Benková E, Mähönen AP, and Helariutta Y (2011a). A mutually inhibitory interaction between auxin and cytokinin specifies vascular pattern in roots. Curr. Biol 21, 917–926. - PubMed
    1. Bishopp A, Lehesranta S, Vaten A, Help H, El-Showk S, Scheres B, Helariutta K, Mahonen AP, Sakakibara H, and Helariutta Y (2011b). Phloem-transported cytokinin regulates polar auxin transport and maintains vascular pattern in the root meristem. Curr. Biol 21, 927–932. - PubMed

Publication types

MeSH terms

Substances

LinkOut - more resources