. 2018 Sep 20;71(6):973-985.e5.
doi: 10.1016/j.molcel.2018.08.011. Epub 2018 Sep 6.

Differential m6A, m6Am, and m1A Demethylation Mediated by FTO in the Cell Nucleus and Cytoplasm

Affiliations

Differential m6A, m6Am, and m1A Demethylation Mediated by FTO in the Cell Nucleus and Cytoplasm

Jiangbo Wei et al. Mol Cell. .

Abstract

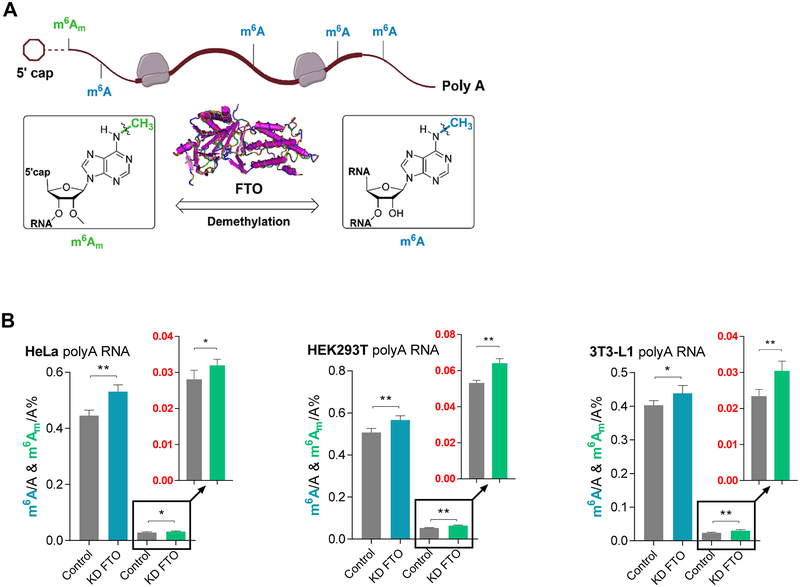
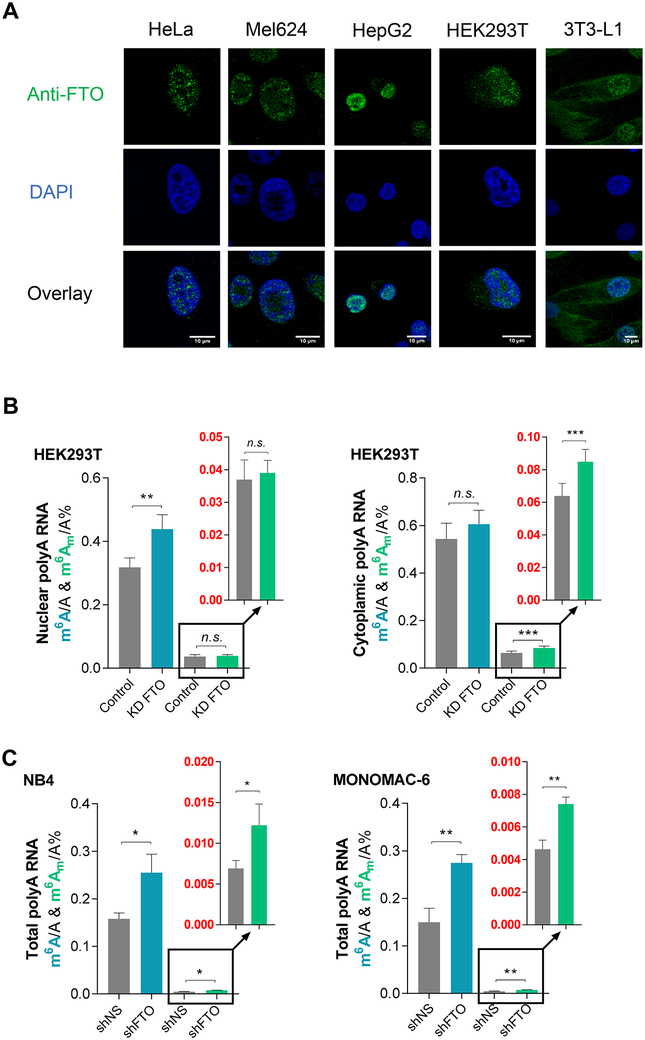
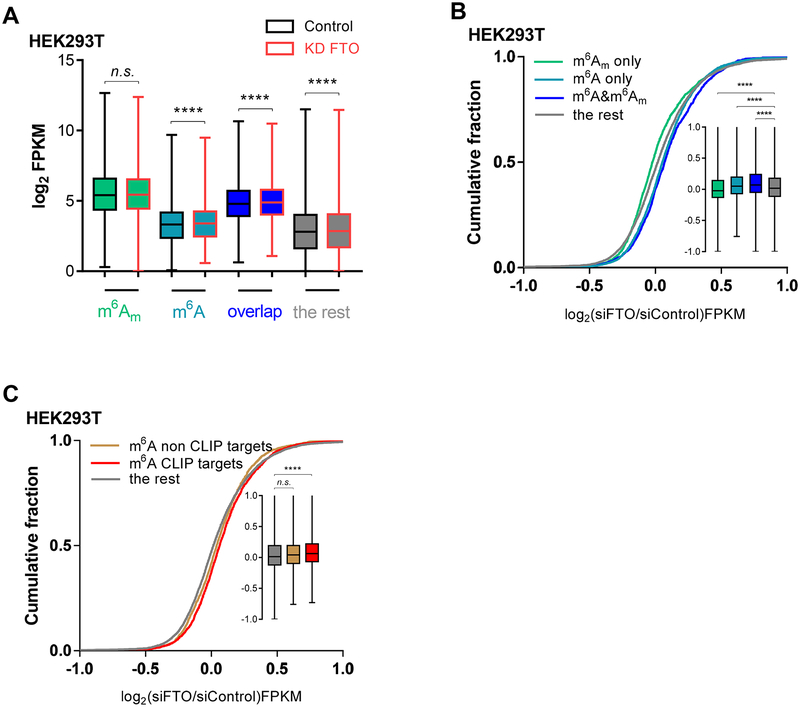
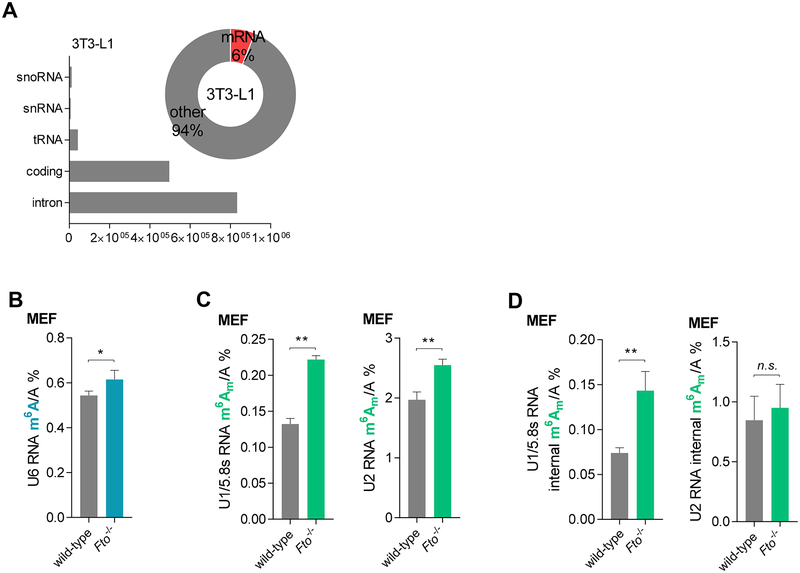
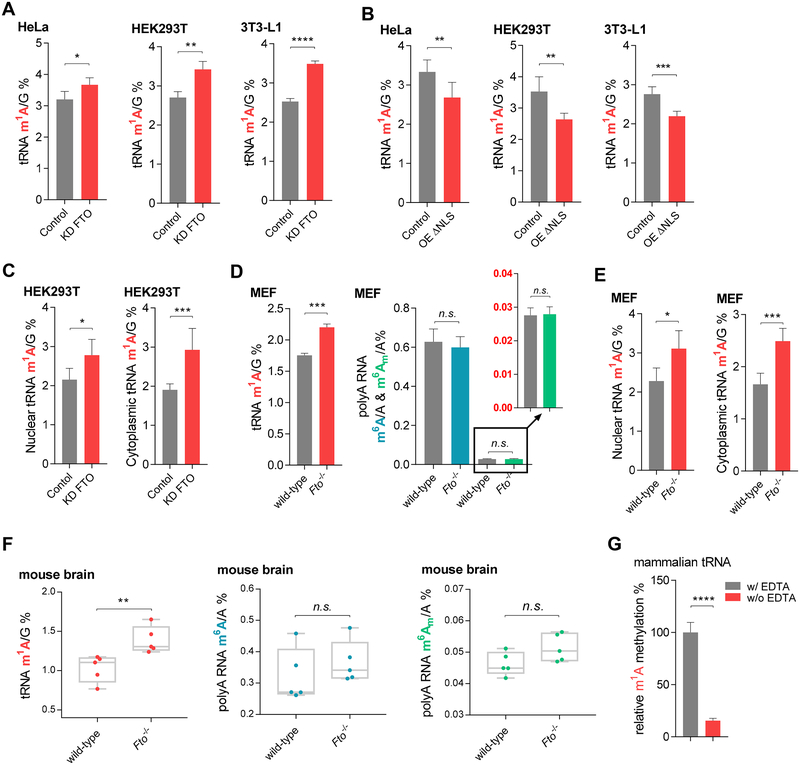
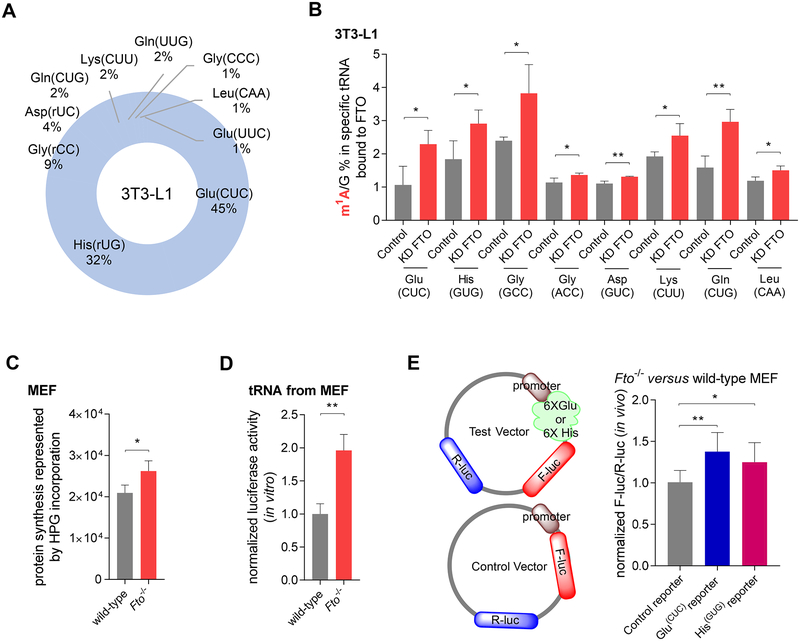
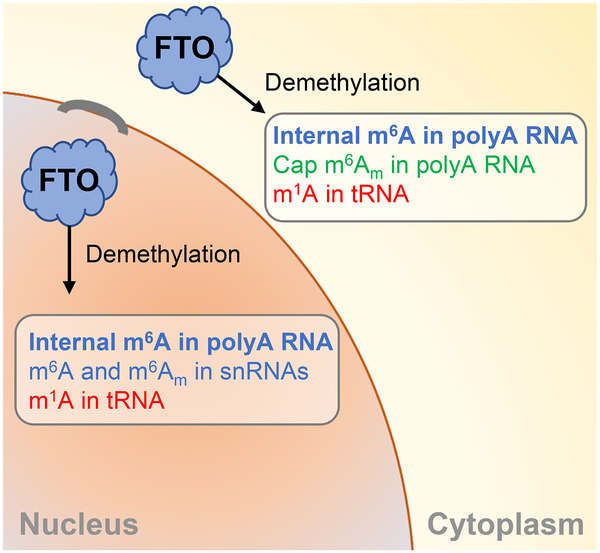
FTO, the first RNA demethylase discovered, mediates the demethylation of internal N6-methyladenosine (m6A) and N6, 2-O-dimethyladenosine (m6Am) at the +1 position from the 5' cap in mRNA. Here we demonstrate that the cellular distribution of FTO is distinct among different cell lines, affecting the access of FTO to different RNA substrates. We find that FTO binds multiple RNA species, including mRNA, snRNA, and tRNA, and can demethylate internal m6A and cap m6Am in mRNA, internal m6A in U6 RNA, internal and cap m6Am in snRNAs, and N1-methyladenosine (m1A) in tRNA. FTO-mediated demethylation has a greater effect on the transcript levels of mRNAs possessing internal m6A than the ones with cap m6Am in the tested cells. We also show that FTO can directly repress translation by catalyzing m1A tRNA demethylation. Collectively, FTO-mediated RNA demethylation occurs to m6A and m6Am in mRNA and snRNA as well as m1A in tRNA.

Keywords: FTO; cap m(6)A(m); cytoplasmic demethylation; m(6)A; nuclear m(6)A demethylation; snRNA demethylation; tRNA m(1)A demethylation; translation regulation.


Conflict of interest statement

DECLARATION OF INTERESTS

Chuan He is a scientific founder of Accent Therapeutics, Inc. and a member of its scientific advisory board.

Figures

Figure 1.
Figure 1.. FTO Demethylates both m6A and m6Am inside Cells.
See also Figure S1. (A) A sketch that FTO mediates demethylation of m6A and cap m6Am in polyadenylated RNA. (B) Quantification of the m6A/A and cap m6Am/A ratio in polyadenylated RNA by LC-MS/MS. In comparison to controls, significant increases in the m6A/A ratio were consistently observed among HeLa, HEK293T, and 3T3-L1 cells upon transient knockdown of FTO (blue bars). Increases of the m6Am/A ratio were consistently observed among HeLa, HEK293T, and 3T3-L1 cells upon transient knockdown of FTO (green bars). P values were determined using Student’s unpaired t-test. *p < 0.05, **p < 0.01, ***p < 0.001, ****p < 0.0001. n.s. means not significant. Error bars, mean ± s.d. for n = 4 experiments in (B).
Figure 2.
Figure 2.. Subcellular Distribution of FTO Differs among Cell Lines and the Spatial Localization of FTO Influences its Demethylation of Target Substrates.
See also Figure S2. (A) Subcellular localization of FTO (green) among HeLa, Mel624, HepG2, HEK293T, and 3T3-L1 cell lines. The nucleus was stained with DAPI (blue). Scale bar = 10 μm. Representative images are selected from three independent experiments. (B) Quantification of the m6A/A and cap m6Am/A ratios in polyadenylated RNA from HEK293T cells by LC-MS/MS. Transient knockdown of FTO led to a significant increase of nuclear polyadenylated RNA m6A/A ratio but not the cytoplasmic polyadenylated RNA m6A/A ratio (blue bars). Transient knockdown of FTO led to a significant increase of cytoplasmic polyadenylated RNA m6Am/A ratio but no noticeable change of the nuclear polyadenylated RNA m6Am/A ratio (green bars). (C) Quantification of the m6A/A and cap m6Am/A ratios in polyadenylated RNA from NB4 cells (left) and MONOMAC-6 cells (right) by LC-MS/MS. Stable knockdown of FTO led to both increased m6A/A and cap m6Am/A ratios in total polyadenylated RNA; P values were determined using Student’s unpaired t-test. *p < 0.05, **p < 0.01, ***p < 0.001, ****p < 0.0001. n.s. means not significant. Error bars, mean ± s.d. for n = 6 experiments in (B); for n = 4 experiments in (C)
Figure 3.
Figure 3.. FTO-mediated Demethylation of m6A but not m6Am in Polyadenylated RNA More Affects Transcript Expression Level Changes.
See also Figure S3 and Table S1. (A) mRNA transcripts are classified into four groups: transcripts containing only m6Am, containing only internal m6A, containing both m6A and m6Am (overlap), and transcripts that contain neither m6A nor m6Am (labeled as the rest). The global expression level of m6Am-alone transcripts did not significantly change upon FTO knockdown while the global transcript level of other three groups increased significantly. (B) The cumulative fraction of gene expression shows that compared to the transcripts containing only m6A, containing both m6A and m6Am, and containing no m6A or m6Am, the transcripts containing only m6Am but not m6A showed significantly less transcript level change with FTO knockdown compared to the control (in A, P values were determined using the Wilcoxon test; in B, P values were determined using Mann-Whitney test. *p < 0.05, **p < 0.01, ***p < 0.001, ****p < 0.0001. n.s. means not significant. Error bars, mean ± s.d. for n = 3987, m6A only; n = 2016, m6A only; n = 1307, m6 m A and m6Am; n = 5598, the rest). (C) The cumulative fraction of gene expression shows that FTO CLIP targets showed significantly increased expression level upon transient knockdown of FTO but not non-targets for transcripts containing only m6A compared to the rest genes. (In C, P values were determined using Mann-Whitney test. *p < 0.05, **p < 0.01, ***p < 0.001, ****p < 0.0001. n.s. means not significant. Error bars, mean ± s.d. for n = 1895, m6A genes overlapped with FTO targets; n = 2092, non-targets; n = 8896, the rest).
Figure 4.
Figure 4.. FTO-mediated Internal m6A, Internal and Cap m6Am Demethylation in snRNAs.
See also Figure S4. (A) Bar graph summarizing the reads distribution of the FTO target RNA species in the 3T3-L1 cells; donut graph showing the percentage of the FTO-bound mRNA in all FTO CLIP-seq targets in the 3T3-L1 cell line. (B) An increased m6A/A ration in the U6 RNA was observed by LC-MS/MS in Fto−/− MEF cells compared to the control wild-type MEF cells. (C) Quantification of the m6Am/A ratio of the U1/5.8s RNA and U2 RNA by LC-MS/MS after decapping, showing increased m6Am/A ratios in the Fto−/− MEF cells compared to the wild-type control. (D) Quantification of the m6Am/A ratio in U1/5.8s RNA and U2 RNA by LC-MS/MS without decapping, showing increased internal m6Am/A ratios in Fto−/− MEF cells compared to the wild-type control. P values were determined using Student’s unpaired t-test. *p < 0.05, **p < 0.01, ***p < 0.001, ****p < 0.0001. n.s. means not significant. Error bars, mean ± s.d. for n = 6 experiments in (B) to (D).
Figure 5.
Figure 5.. FTO-mediated tRNA m1A Demethylation in vitro, inside Cells, and in Brain Tissues.
See also Figure S5, Table S2, and Table S3. (A) Quantification of the m1A/G ratio in total tRNA purified from HeLa, HEK293T, and 3T3-L1 cells by LC-MS/MS. The transient knockdown led to an increase of at least ~15% of the m1A/G ratio in total tRNA compared to control cells. (B) A consistent decrease (~20%) of the total tRNA m1A/G ratio was observed upon overexpression of ΔNLS-FTO compared to the control. (C) Transient knockdown of FTO led to a significant increase of both nuclear and cytoplasmic total tRNA m1A/G ratio in HEK293T cells. (D) A significant increase of m1A in tRNA but not m6A or m6Am in the polyadenylated RNA was observed in the Fto−/− MEF cells compared to the wild-type MEF cells. (E) Knockout of Fto led to significant increases of both nuclear and cytoplasmic tRNA m1A levels in tRNA in MEF cells. (F) A significant increase of the total tRNA m1A but not polyadenylated RNA m6A or m6Am could be observed in Fto−/− mouse brain tissues compared to wild-type mouse brains. (G) Demethylation of m1A in tRNA isolated from HEK293T cells by recombinant FTO. EDTA chelates cofactor iron and inactivates FTO. The ratio of m1A/G was shown. P values were determined using Student’s unpaired t-test. *p < 0.05, **p < 0.01, ***p < 0.001, ****p < 0.0001. n.s. means not significant. Error bars, mean ± s.d. for n = 4 experiments in (A) to (E); for n = 5 experiments in (F); for n = 3 experiments in (G).
Figure 6.
Figure 6.. FTO Mediates Specific tRNA m1A Demethylation and Suppresses Translation.
See also Figure S6. (A) Pie chart showing the top FTO-bound tRNAs identified by CLIP-seq with FLAG-tagged FTO in 3T3-L1 cells. (B) Quantification of the m1A/G ratio in tRNA targets bound to FTO by LC-MS/MS. In comparison to the control, m1A/G ratios of tRNAGlu(CUC), tRNAHis(GUG), tRNAGly(GCC), tRNAGly(ACC), tRNAAsp(GUC), tRNALys(CUU), tRNAGln(CUG), and tRNALeu(CAA) noticeably increased upon transient knockdown of FTO in 3T3-L1 cell. (C) Quantification of total protein synthesis in MEF cells by flow cytometry. HPG incorporation into wild-type MEF cell was recorded in gray and the Fto−/− MEF cells in red. (D) Supplementation of total tRNA purified from Fto−/− MEF cell leads to increased translation efficiency in vitro compared to using the total tRNA from wild-type MEF cells. (E) Cartoon illustration of the reporter assays was shown: firefly luciferase (F-luc) was used as the reporter and Renilla luciferase (R-luc) on the same plasmid was used as the internal transfection control. 6 × GUG(Glu)-coding sequences (recognized by tRNAGlu(CAC)) and 6 × CAC(His)-coding sequences (recognized by tRNAHis(GUG)) were inserted after the PLK promoter region of F-luc as the positive reporter, respectively. The effects of tRNAGlu(CUC) and tRNAHis(GUG) were revealed by the reporter assay. The reporter assay showed significant increases of protein synthesis in the Fto−/− MEF cell compared to the wild-type MEF cell when the control reporter and test reporters (with inserted Glu(CUC)-coding sequence or His(GUG)-coding sequence) are transiently expressed in the wild-type and Fto−/− MEF cell, respectively. P value was determined using Student’s unpaired t-test. *p < 0.05, **p < 0.01, ***p < 0.001, ****p < 0.0001. n.s. means not significant. Error bars, mean ± s.d. for n = 3 experiments in (B) and (C); n = 8 experiments in (D) and (E).
Figure 7.
Figure 7.. A Model for FTO-mediated RNA Demethylation.
Nuclear m6A is the main substrate of FTO in the cell nucleus. FTO also mediates m1A tRNA demethylation as well as m6A (U6) and m6Am (U2 in particular but also U1) snRNA demethylation in the nucleus. FTO can localize to the cytoplasm and mediate mRNA m6A and cap m6Am demethylation as well as tRNA m1A demethylation in the cytoplasm.

Similar articles

Cited by

References

    1. Aas A, Isakson P, Bindesboll C, Alemu EA, Klungland A, and Simonsen A (2017). Nucleocytoplasmic Shuttling of FTO Does Not Affect Starvation-Induced Autophagy. PLoS One 12, e0168182. - PMC - PubMed
    1. Adams JM, and Cory S (1975). Modified nucleosides and bizarre 5[prime]-termini in mouse myeloma mRNA. Nature 255, 28–33. - PubMed
    1. Anderson J, Phan L, Cuesta R, Carlson BA, Pak M, Asano K, Bjork GR, Tamame M, and Hinnebusch AG (1998). The essential Gcd10p-Gcd14p nuclear complex is required for 1-methyladenosine modification and maturation of initiator methionyl-tRNA. Genes & Development 12, 3650–3662. - PMC - PubMed
    1. Bartosovic M, Molares HC, Gregorova P, Hrossova D, Kudla G, and Vanacova S (2017). N6-methyladenosine demethylase FTO targets pre-mRNAs and regulates alternative splicing and 3’-end processing. Nucleic Acids Res 45, 11356–11370. - PMC - PubMed
    1. Boissel S, Reish O, Proulx K, Kawagoe-Takaki H, Sedgwick B, Yeo GS, Meyre D, Golzio C, Molinari F, Kadhom N, et al. (2009). Loss-of-function mutation in the dioxygenase-encoding FTO gene causes severe growth retardation and multiple malformations. Am J Hum Genet 85, 106–111. - PMC - PubMed

Publication types

MeSH terms