. 2018 Dec 4;28(6):895-906.e5.
doi: 10.1016/j.cmet.2018.08.009. Epub 2018 Sep 6.

The Translational Machinery of Human CD4+ T Cells Is Poised for Activation and Controls the Switch from Quiescence to Metabolic Remodeling

Affiliations

The Translational Machinery of Human CD4+ T Cells Is Poised for Activation and Controls the Switch from Quiescence to Metabolic Remodeling

Sara Ricciardi et al. Cell Metab. .

Erratum in

Abstract

Naive T cells respond to T cell receptor (TCR) activation by leaving quiescence, remodeling metabolism, initiating expansion, and differentiating toward effector T cells. The molecular mechanisms coordinating the naive to effector transition are central to the functioning of the immune system, but remain elusive. Here, we discover that T cells fulfill this transitional process through translational control. Naive cells accumulate untranslated mRNAs encoding for glycolysis and fatty acid synthesis factors and possess a translational machinery poised for immediate protein synthesis. Upon TCR engagement, activation of the translational machinery leads to synthesis of GLUT1 protein to drive glucose entry. Subsequently, translation of ACC1 mRNA completes metabolic reprogramming toward an effector phenotype. Notably, inhibition of the eIF4F complex abrogates lymphocyte metabolic activation and differentiation, suggesting ACC1 to be a key regulatory node. Thus, our results demonstrate that translation is a direct mediator of T cell metabolism and indicate translation factors as targets for novel immunotherapeutic approaches.

Keywords: ACC1; CD4(+) T cell; GLUT1; eIF4E; eIF6; metabolism; metabolome; proteome; transcriptome; translational control.


Figures

Figure 1
Figure 1. CD4+ naïve T cells present high glycolytic and fatty acid synthesis (FAS) potentials at the steady-state mRNA level but remain quiescent by regulating the expression of key glycolytic and FAS enzymes.
(A) Heat map showing the pairwise Pearson correlation coefficient (PCC) of the log2 read count of all metabolic genes across CD4+ and CD8+ T cell subsets (Pearson correlation coefficient 0.7-1 between cell subsets). (B-C) Radar charts of the distribution of gene expression calculated for glycolysis (B) and FAS (C). In the radar chart T cell subsets are represented on axes starting from the same point and metabolic pathways by a spoke. The length of a spoke is proportional to the magnitude of the metabolic pathway. Naïve cells have the highest levels of mRNAs encoding for FAS among all T subsets. (D) Venn diagram showing the number metabolic genes expressed at protein level. Genes with a 1.00E-08 ≤ iBAQ protein expression were considered absent at the protein level. (E-F) Correlation bar plots of iBAQ intensities (proteome) versus FPKM values (transcriptome) of glycolysis (E) and FAS genes (F). Naïve cells have high mRNA levels of GLUT1 and ACC1, but no proteins. (G) Flow cytometry plots representative of three independent experiments showing the expression of GLUT1 protein in CD4+ naïve and CD4+ Th1 cells isolated from peripheral blood. (H) The immunoblot of ACC1 protein in CD4+ naïve and CD4+ Th1 cells isolated from peripheral blood of two different healthy donors shows absence of ACC1 protein expression in naïve compared to Th1.
Figure 2
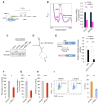
Figure 2. CD4+ naïve T cells have a conspicuous but poised ribosomal machinery that is activated by T cell receptor stimulation.
(A) Radar charts of the distribution of ribosomal genes across CD4+ and CD8+ T cell subsets. In the radar chart T cell subsets are represented on axes starting from the same point and ribosomal capability by a spoke. The length of a spoke is proportional to the magnitude of the ribosomal capability. Naïve and Central Memory have the highest levels of ribosomal mRNAs. (B-C) Correlation bar plots of iBAQ intensities (proteome) versus FPKM values (transcriptome) of L ribosomal proteins (RPLs) (B), and Trans-acting factors (C) genes. All ribosome-associated genes are abundant at the protein level. (D) Radar charts of the distribution of translational control genes across CD4+ and CD8+ T cell subsets. In the radar chart T cell subsets are represented on axes starting from the same point and translation capability by a spoke. The length of a spoke (from the center) is proportional to the magnitude of the translation capability. (E) Polysomal profiles of CD4+ naïve or activated CD4+ T cells. A high 80S peak is a marker of inactive translation. Upon TCR stimulation, 80S subunits are converted in active polysomes and the 80S peak drops down. (F) Flow cytometry histogram representative of three independent experiments showing puromycin incorporation in CD4+ naïve and CD4+ T cells activated for 72h. Protein synthesis increases upon consistency TCR stimulation. (G) Bar graph showing the values of the 4EBPs/eIF4E ratios in T and B lymphocyte subsets predicts the translational sensitivity to rapamycin of all T cell subsets but not of B cells. (H) The ribosomal machinery is activated by T cell receptor stimulation. Representative immunofluorescence of three independent experiments of phospho-rpS6 (green) and RACK1 (red) proteins in CD4+ naïve or activated CD4+ T cells. RACK1 is a structural marker of the 40S subunit, rpS6 is the phosphorylated form of the 40S subunit ribosomal protein S6, a marker of mTORC1-S6K cascade. Scale bars, 5 μm. (I) Representative immunoblot of two independent experiments of the phospho-S6 protein in CD4+ T cells activated in the presence of Rapamycin. Rapamycin blocks mTORC1-dependent rpS6 phosphorylation.
Figure 3
Figure 3. GLUT1 and ACC1 are translationally controlled during activation of CD4+ T cells, in vitro.
(A) Flow cytometry plots representative of three independent experiments showing the expression of GLUT1 protein in CD4+ naive T cells or in the same cells activated for 24h, 48h and 72h. Right, quantification of flow cytometry data. Data are mean ± sd. p values are determined by two-tailed Student’s t-tests. * * * P < 0.001. (B) Immunoblot representative of four independent experiments showing ACC1 protein expression in CD4+ T cells following activation at the indicated time points. (C) Expression levels of GLUT1 and ACC1 mRNAs in CD4+ naive T cells and in the same cells activated for 24h, 48h and 72h. Data are mean ± sd. p values are determined by two-tailed Student’s t-tests. * * P < 0.01. (D) Polysomal profiles of CD4+ naïve and CD4+ T cells stimulated in vitro for 24h and 72h. Right, quantification of mRNA levels of three replicates in subpolysomes and polysomes showing an increase in polysome-associated GLUT1 and ACC1 transcripts in response to TCR stimulation (CD4+ T cells for each replicate were from three different healthy donors). Data are mean ± sd. p values are determined by two-tailed Student’s t-tests (CD4+ stimulated versus CD4+ naïve cells). * P < 0.05, * * P < 0.01, * * * P < 0.001. (E) Flow cytometry plots representative of three independent experiments showing the expression of GLUT1 in CD4+ T cells activated in the presence of either Act D or CHX. Numbers in quadrant indicate percentage of cells. Right, quantification of flow cytometry data. Data are mean ± sd. p values are determined by two-tailed Student’s t-tests. * * P < 0.01. Data show that transcriptional inhibition by Act D does not reduce GLUT1 positive cells, whereas translational inhibition by CHX does. (F) Immunoblot representative of two independent experiments showing ACC1 expression in CD4+ T cells activated in the presence of either Act D or CHX. Transcriptional inhibition by Act D does not reduce ACC1 levels, whereas translational inhibition by CHX does.
Figure 4
Figure 4. Human CD4+ T cells undergo metabolic reprogramming through sequential activation of glycolysis, oxygen consumption and FAS without changes in AMP/ATP ratios.
(A) Metabolome analysis of CD4+ T cells collected at the indicated time points after TCR stimulation. The log2 value for each metabolite represents the average of three replicates. Metabolites were clustered in seven categories. Clusters are shown. (B-C) Intracellular concentrations of Fructose 1,6-bisphosphate (B) and Malonyl-CoA (C) in activated CD4+ T cells at the indicated time points. Data represent the average of three biological replicates (CD4+ T cells for each replicate were from five different healthy donors). Data are mean ± sd. p values are determined by two-tailed Student’s t-tests. * * P < 0.01. Accumulation of the two products correlates with translational expression of GLUT1 and ACC1. (D) Lactate secretion of activated CD4+ T cells at the indicated time points. Data represent the average of triplicates (CD4+ T cells for each replicate were from two different healthy donors). Data are mean ± sd. p values are determined by two-tailed Student’s t-tests. * P < 0.05, * * P < 0.01. (E) OCR of activated CD4+ T cells at the indicated time points. Data represent the average of triplicates (CD4+ T cells for each replicate were from two different healthy donors). Data are mean ± sd. p values are determined by two-tailed Student’s t-tests. * * * P < 0.001. (G) Adenylate Energy Charge in CD4+ T cells collected at the indicated time points. Data represent the average of three replicates.
Figure 5
Figure 5. Translational activation of ACC1 via eIF4E sustains a metabolic feed-forward loop that completes the metabolic reprogramming to an effector phenotype.
(A) Schematic drawing illustrating the inhibitory effect on translation initiation by 4EGi-1. 4EGI-1 binds to eIF4E and inhibits eIF4E1-eIF4G1 interaction. (B) Polysomal profiles of CD4+ T cells activated in the absence or presence of 4EGi-1. Right, quantification of ACC1 and RPS29 mRNA levels of three replicates in polysomes (CD4+ T cells for each replicate were from two different healthy donors). Data are mean ± sd. p values are determined by two-tailed Student’s t-tests. * * * P < 0.001. (C) Immunoblot representative of three independent experiments showing ACC1 expression in CD4+ T cells activated in the presence of 4EGi-1. ACC1 expression depends from eIF4F activation. (D) Predicted secondary structures of the 5’-UTR sequence of the ACC1 mRNA. (E) Schematic of the reporter designed to assess the effect of ACC1 5’ on Renilla luciferase protein expression. Right, quantification of three replicates of the relative Renilla luciferase activity of pRL and ACC1 5’-UTR constructs in the absence (control) or presence of 4EGi-1. Data are mean ± sd. p values are determined by two-tailed Student’s t-tests. * * P < 0.01, * * * P < 0.001. (F-H) 4EGi-1 treatment reduces the glycolytic intermediates, Pyruvate (E) and Lactate (F) and respiration (G). Data represent the average of three replicates. Data are mean ± sd. p values are determined by two-tailed Student’s t-tests. * P < 0.05, * * P < 0.01, * * * P < 0.001. (I) Flow cytometry plots representative of three independent experiments showing IFN-γ production in CD4+ T cells activated in the presence of 4EGi-1. Numbers in quadrants indicate percentage of cells. Right, quantification of flow cytometry data. Data are mean ± sd. p values are determined by two-tailed Student’s t-tests. * * P < 0.01.
Figure 6
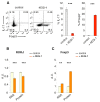
Figure 6. eIF4E-dependent ACC1 translation inhibition constrains Th17 cell polarization towards anti-inflammatory Foxp3+ regulatory T cells (Treg).
(A) Flow cytometry plots representative of three independent experiments showing IL-17+ and Foxp3+ in Th17 differentiating cells in the presence of 4EGi-1. Right, quantification of flow cytometry data. Data are mean ± sd. p values are determined by two-tailed Student’s t-tests. * * * P < 0.001. (B-C) Translation of RORγt and Foxp3 is independent of eIF4F complex formation in Th17 differentiating cells. Bar graphs of three independent experiments showing relative mRNA (qRT-PCR) and protein levels (FACS) of either RORγt (B) or Foxp3 (C) in Th17 differentiating cells in the absence or presence of 4EGi-1. Data are mean ± sd. p values are determined by two-tailed Student’s t-tests. * * P < 0.01, * * * P < 0.001.

Comment in

  • T cells under starter's orders.
    Minton K. Minton K. Nat Rev Immunol. 2018 Oct;18(10):600-601. doi: 10.1038/s41577-018-0067-6. Nat Rev Immunol. 2018. PMID: 30206315 No abstract available.
  • Peeking under the Hood of Naive T Cells.
    Xu W, Powell JD. Xu W, et al. Cell Metab. 2018 Dec 4;28(6):801-802. doi: 10.1016/j.cmet.2018.11.008. Cell Metab. 2018. PMID: 30517891 Free PMC article.

References

    1. Alain T, Morita M, Fonseca BD, Yanagiya A, Siddiqui N, Bhat M, Zammit D, Marcus V, Metrakos P, Voyer LA, et al. eIF4E/4E-BP ratio predicts the efficacy of mTOR targeted therapies. Cancer Res. 2012;72:6468–6476. - PubMed
    1. Araki K, Morita M, Bederman AG, Konieczny BT, Kissick HT, Sonenberg N, Ahmed R. Translation is actively regulated during the differentiation of CD8+ effector T cells. Nat Immunol. 2017 - PMC - PubMed
    1. Ardawi MS, Newsholme EA. Metabolism of ketone bodies, oleate and glucose in lymphocytes of the rat. Biochem J. 1984;221:255–260. - PMC - PubMed
    1. Ben-Sahra I, Manning BD. mTORC1 signaling and the metabolic control of cell growth. Curr Opin Cell Biol. 2017;45:72–82. - PMC - PubMed
    1. Berod L, Friedrich C, Nandan A, Freitag J, Hagemann S, Harmrolfs K, Sandouk A, Hesse C, Castro CN, Bahre H, et al. De novo fatty acid synthesis controls the fate between regulatory T and T helper 17 cells. Nat Med. 2014;20:1327–1333. - PubMed

Publication types

MeSH terms