. 2018 Aug 24:9:1995.
doi: 10.3389/fmicb.2018.01995. eCollection 2018.

Role of Short Chain Fatty Acids in Controlling Tregs and Immunopathology During Mucosal Infection

Affiliations

Role of Short Chain Fatty Acids in Controlling Tregs and Immunopathology During Mucosal Infection

Natarajan Bhaskaran et al. Front Microbiol. .

Abstract

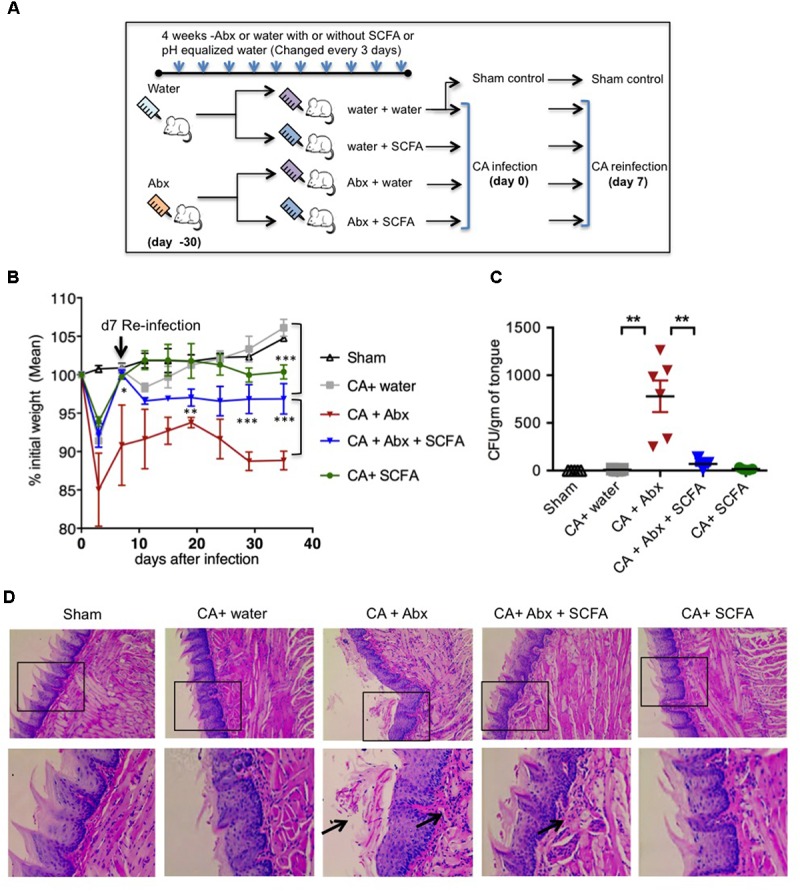
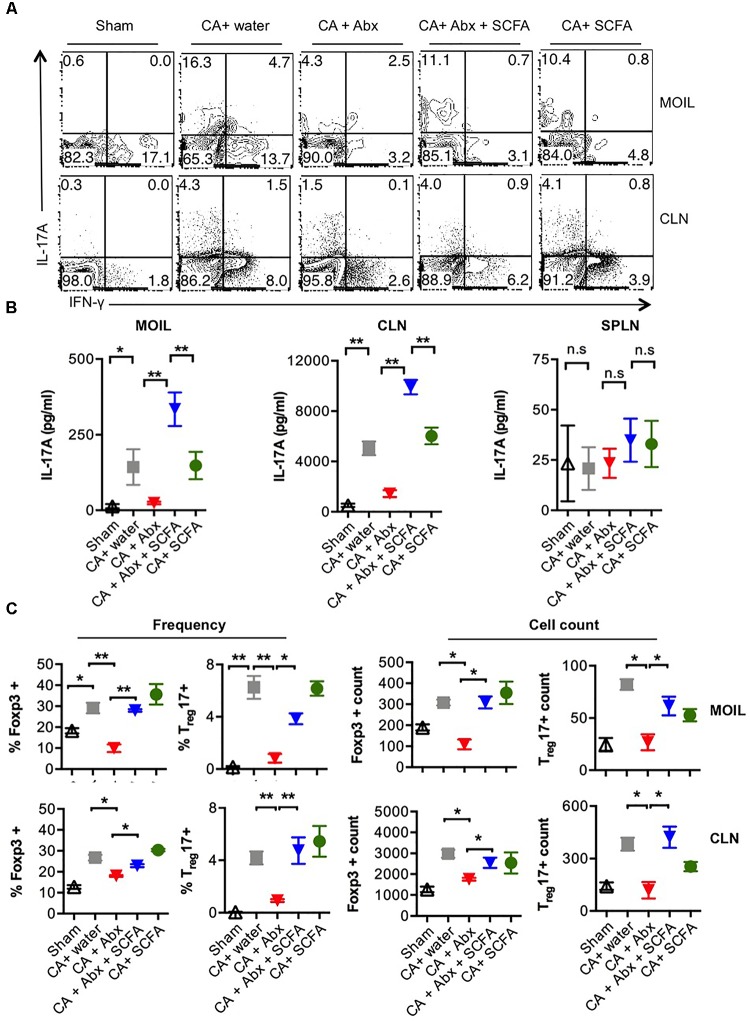
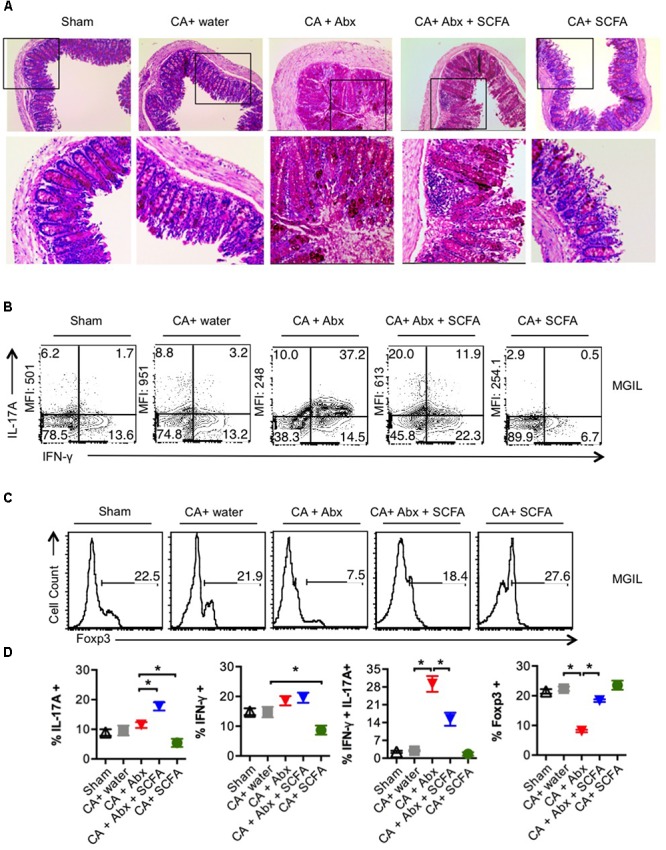
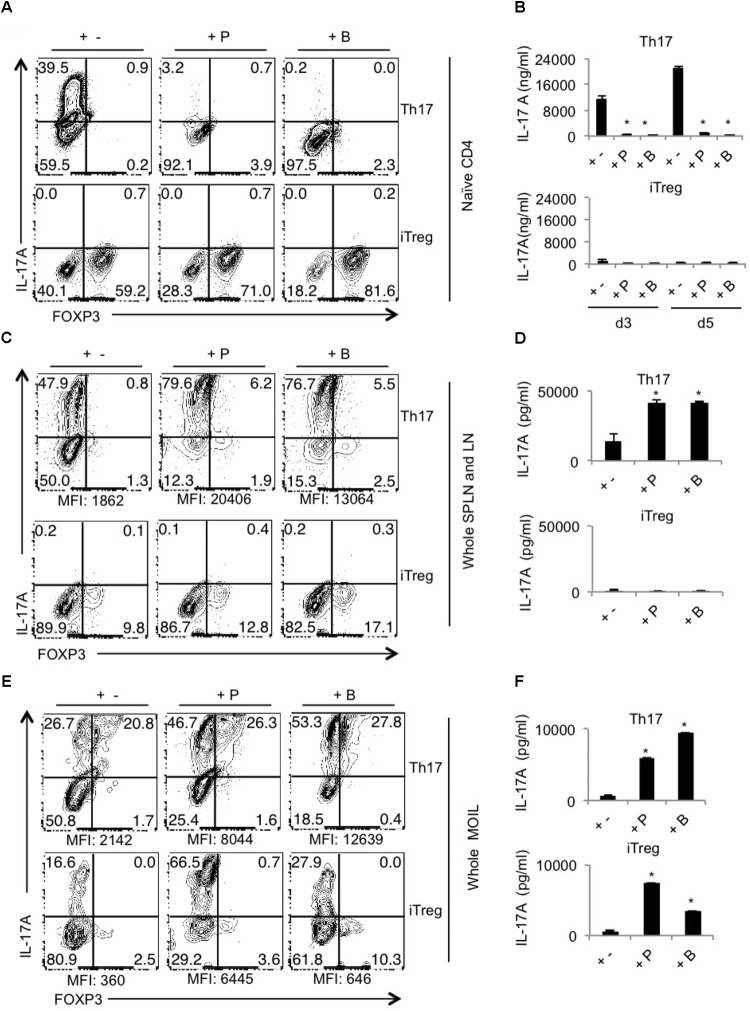
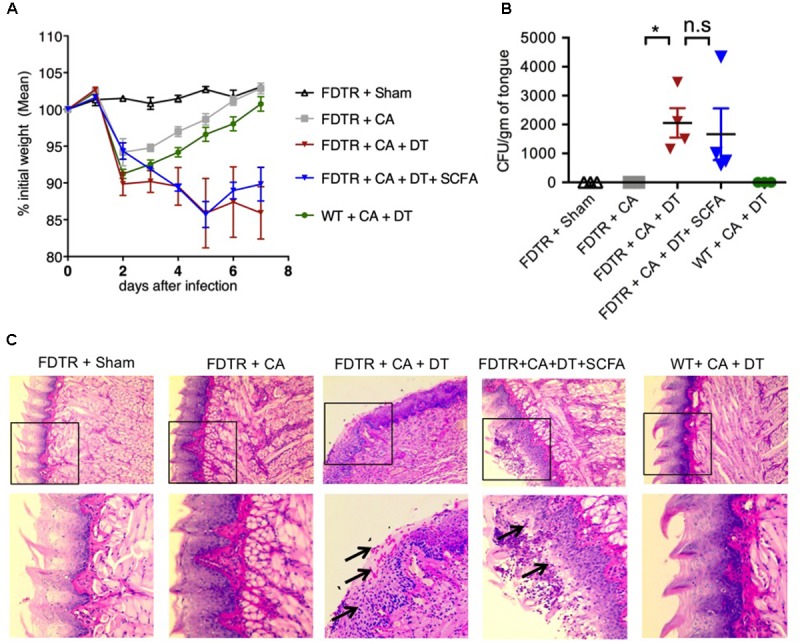
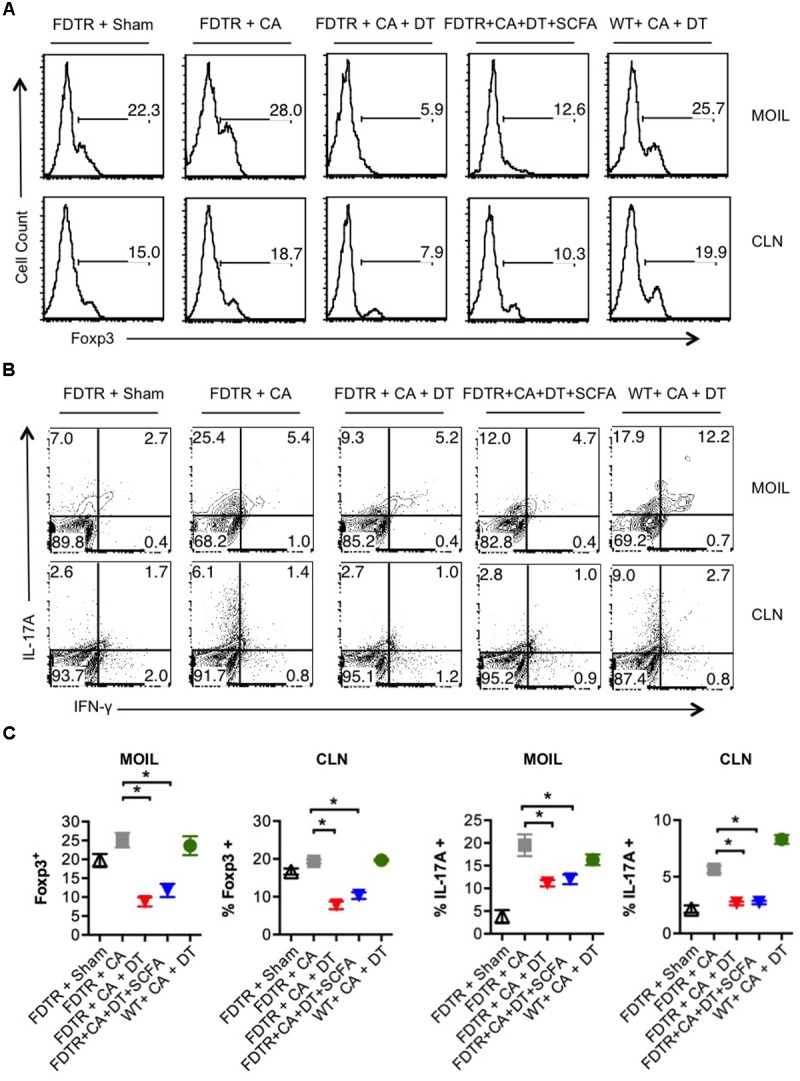
Interactions between mucosal tissues and commensal microbes control appropriate host immune responses and inflammation, but very little is known about these interactions. Here we show that the depletion of resident bacteria using antibiotics (Abx) causes oral and gut immunopathology during oropharyngeal candidiasis (OPC) infection. Antibiotic treatment causes reduction in the frequency of Foxp3+ regulatory cells (Tregs) and IL-17A producers, with a concomitant increase in oral tissue pathology. While C. albicans (CA) is usually controlled in the oral cavity, antibiotic treatment led to CA dependent oral and gut inflammation. A combination of short chain fatty acids (SCFA) controlled the pathology in Abx treated mice, correlating to an increase in the frequency of Foxp3+, IL-17A+, and Foxp3+IL-17A+ double positive (Treg17) cells in tongue and oral draining lymph nodes. However, SCFA treatment did not fully reverse the gut inflammation suggesting that resident microbiota have SCFA independent homeostatic mechanisms in gut mucosa. We also found that SCFA potently induce Foxp3 and IL-17A expression in CD4+ T cells, depending on the cytokine milieu in vitro. Depletion of Tregs alone in FDTR mice recapitulated oral inflammation in CA infected mice, showing that Abx mediated reduction of Tregs was involved in infection induced pathology. SCFA did not control inflammation in Treg depleted mice in CA infected FDTR mice, showing that Foxp3+ T cell induction was required for the protective effect mediated by SCFA. Taken together, our data reveal that SCFA derived from resident bacteria play a critical role in controlling immunopathology by regulating T cell cytokines during mucosal infections. This study has broader implications on protective effects of resident microbiota in regulating pathological infections.

Keywords: SCFA; Candida; Foxp3; Th17; Treg; oral-microbiome; oral-mucosa.


Figures

FIGURE 1
FIGURE 1
Abx treatment results in impaired resistance to OPC in mice, while SCFAs reduce fungal burden and immunopathology. (A) Abx and SCFA administration schedule. Abx, antibiotics; SCFA, short chain fatty acids. (B) Abx or SCFA treated C57BL/6 mice were orally infected and re-infected with C. albicans (CA) n = 4/group. Body weight was measured every 3rd day until the day of sacrifice. (C) On day 28 or 29 after secondary infection, we re-infected the mice. Three days after 2nd re-infection, we isolated the tongue, and determined the fungal growth, by plating the tongue lysates in Sabaroud dextrose agar. Fungal Colony Forming Units (CFU)/gm of tongue tissue plated in 10-fold serial dilutions and assessed in triplicates. Mean values ±SEM are plotted. (D) Three days after 2nd re-infection, we fixed the intact tongues and performed PAS staining and microscopic examination (200× magnification). Bottom panels show magnified images of respective upper panels. Data are representative of at least four experiments. P < 0.05, ∗∗P < 0.005, and ∗∗∗P < 0.0005.
FIGURE 2
FIGURE 2
Abx treatment leads to Th17 and Treg cell reduction, and SCFAs restore these cell populations during OPC. (A) Mice were treated with Abx and SCFA, and infected as in Figure 1 (n = 4/group). On day 1 after second infection, cells isolated from tongue (MOIL) and draining CLN and were re-stimulated before cytokine analyses. Each FACS plot represents individual mouse in a group. Flow cytometric contour plots showing expression of IFN-γ and IL-17A (all gated on CD4+ cells). (B) ELISA quantification of IL-17A in supernatants collected from MOIL and CLN cultures re-stimulated as in (A). (C) MOIL and CLN cultures re-stimulated as in A for cytokine assessment. Statistic analyses on Foxp3+ and Foxp3+IL-17A+ cells. Mean values from four individual data points (mice)/group are shown. Note the differences in “Y-axis.” Statistical analyses was done using Mann–Whitney test (P < 0.05 and ∗∗P < 0.005). Data represent triplicate experiments.
FIGURE 3
FIGURE 3
Abx treatment induces colon inflammation during OPC in mice, while SCFAs partially reduce immunopathology. (A) Three days after 2nd re-infection, we isolated and fixed colon tissues and performed PAS staining and histo-pathological examination using microscopy (200× magnification). (B,C) One day after second re-infection, MGIL were isolated from colon and re-stimulated as in Figure 2. Flow cytometric contour plots show the expression of IFN-γ and IL-17A (B), and Foxp3 (C). Mean fluorescent intensities (MFI) of IL-17A expression are shown on the “Y- axes.” (D) Statistical analyses for % cytokine + cells or % Foxp3+ in MGIL (n = 4/group) was performed using Mann–Whitney test (P < 0.05). Mean ± SEM are shown. At least three independent experiments showed similar results.
FIGURE 4
FIGURE 4
SCFAs promote IL-17A and Foxp3 expression, depending on cytokine milieu in vitro. Naïve cells from normal WT mice were isolated from pooled SPLN and all lymph nodes. They were stimulated with T cell depleted APC under Th17 conditions (upper panel) or iTreg polarization conditions (lower panel) with or without propionate (P) and butyrate (B). (A) IL-17A and Foxp3 expression (in CD4+ cells) were assessed by flow cytometry on day 4 after stimulation. (B) Supernatants were collected on days 3 and 5, and IL-17A levels were measured by ELISA. (C,D) Single cells suspensions were derived from pooled SPLN and all lymph nodes and were stimulated under Th17 conditions (upper panel) or iTreg polarization conditions (lower panel) with or without propionate (P) and butyrate (B). Flow cytometric assessment of IL-17A and Foxp3 expression on day 4 are shown in (C). ELISA quantification of IL-17A in culture supernatants on day 4 is shown in (D). (E,F) Single cells suspensions were derived from MOIL and were stimulated under Th17 conditions (upper panel) or iTreg polarization conditions (lower panel) with or without propionate (P) and butyrate (B). Flow cytometric assessment of IL-17A and Foxp3 expression on day 4 are shown in (E). ELISA quantification of IL-17A in culture supernatants on day 4 is shown in (F). P < 0.05, as measured by Mann–Whitney tests. Data represent three independent experiments. Geometric mean fluorescence intensities of IL-17A expression in CD4+ cells are shown as MFI in flow cytometric plots in (C,E).
FIGURE 5
FIGURE 5
Tregs protect CA infected mice by reducing fungal burden and immunopathology. SCFA have little or no impact in fungal burden in Treg depleted FDTR mice. FDTR and WT mice were pre-injected with DT on days -6, -3, -1, 0, 3, and 6 of infection (n = 4/group). Some mice received SCFA as in the above regimen (n = 4/group). (A) The percent weight change in mice with respect to d0 of infection. (B,C) On day 7 after infection, mice were re-infected with CA. Tongues were harvested on day 3 after re-infection. CFU/gm of tongue tissue (B) and tongue PAS staining (shown in 200× magnification) (C), assessing the fungal burden. Bottom panel in (C) shows magnified images of the region marked in the respective upper panels. Mean values ± SEM are plotted. P-values (P < 0.05; n.s, non-significant) were measured using Mann–Whitney tests. These data represent three independent experiments showing similar results.
FIGURE 6
FIGURE 6
SCFA mediated induction of Tregs enhances the frequency of IL-17A producers in CA infected mice. (A) FDTR and WT mice were pre-injected with DT, or pretreated with SCFA as in Figure 5. On day 7 after infection, mice were re-infected with CA, MOILs and CLN were harvested. Flow cytometric analyses of intracellular staining of Foxp3 expression (A), and IFN-γ and IL-17A in CD4+ T cells are shown (B). (C) Statistical analyses for % Foxp3+ or % IL-17A+ cells (n = 4/group) was performed using Mann–Whitney test (P < 0.05). Mean ± SEM are shown. Results represent data from 3 independent experiments.

References

    1. Aas J. A., Paster B. J., Stokes L. N., Olsen I., Dewhirst F. E. (2005). Defining the normal bacterial flora of the oral cavity. J. Clin. Microbiol. 43 5721–5732. 10.1128/JCM.43.11.5721-5732.2005 - DOI - PMC - PubMed
    1. Abt M. C., Artis D. (2013). The dynamic influence of commensal bacteria on the immune response to pathogens. Curr. Opin. Microbiol. 16 4–9. 10.1016/j.mib.2012.12.002 - DOI - PMC - PubMed
    1. Abt M. C., Osborne L. C., Monticelli L. A., Doering T. A., Alenghat T., Sonnenberg G. F., et al. (2012). Commensal bacteria calibrate the activation threshold of innate antiviral immunity. Immunity 37 158–170. 10.1016/j.immuni.2012.04.011 - DOI - PMC - PubMed
    1. Ahn J., Yang L., Paster B. J., Ganly I., Morris L., Pei Z., et al. (2011). Oral microbiome profiles: 16S rRNA pyrosequencing and microarray assay comparison. PLoS One 6:e22788. 10.1371/journal.pone.0022788 - DOI - PMC - PubMed
    1. Arpaia N., Campbell C., Fan X., Dikiy S., Van Der Veeken J., Deroos P., et al. (2013). Metabolites produced by commensal bacteria promote peripheral regulatory T-cell generation. Nature 504 451–455. 10.1038/nature12726 - DOI - PMC - PubMed