. 2018 Aug 21;9(65):32435-32447.
doi: 10.18632/oncotarget.25945.

Integrin α2β1 decelerates proliferation, but promotes survival and invasion of prostate cancer cells

Affiliations

Integrin α2β1 decelerates proliferation, but promotes survival and invasion of prostate cancer cells

Marjaana Ojalill et al. Oncotarget. .

Abstract

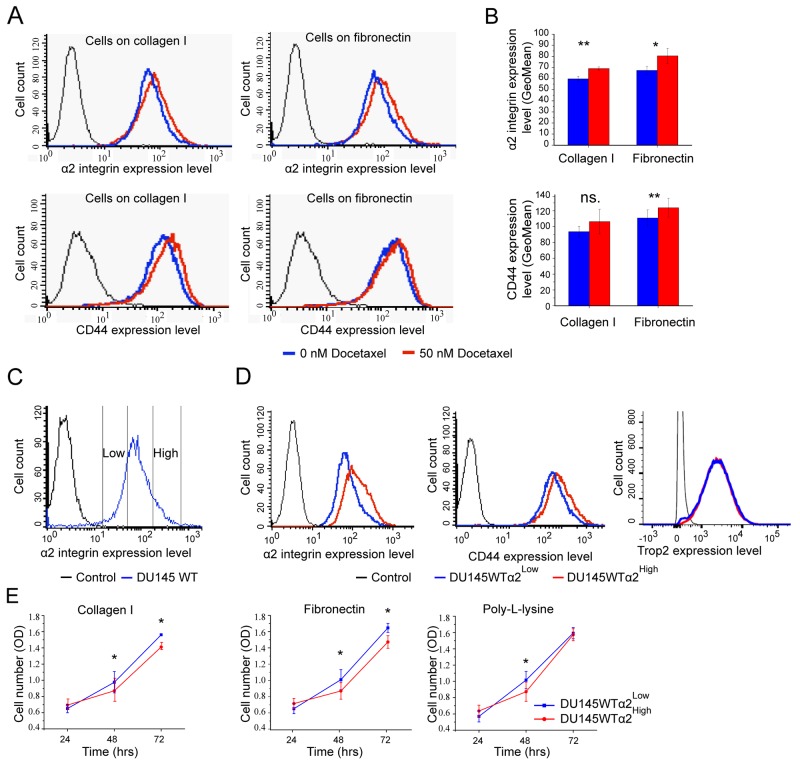
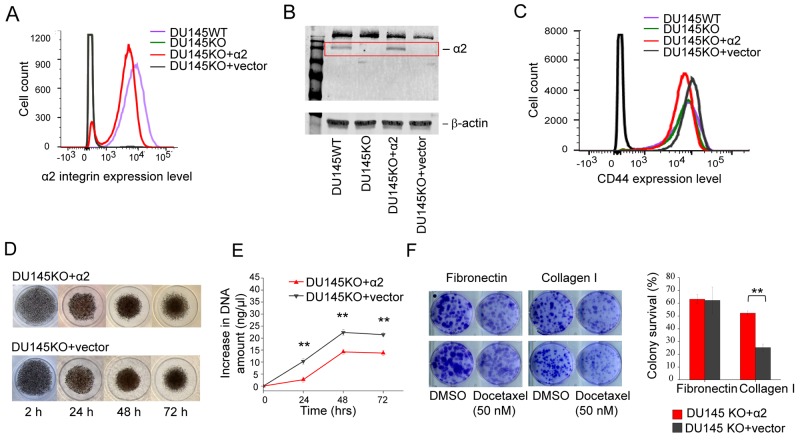
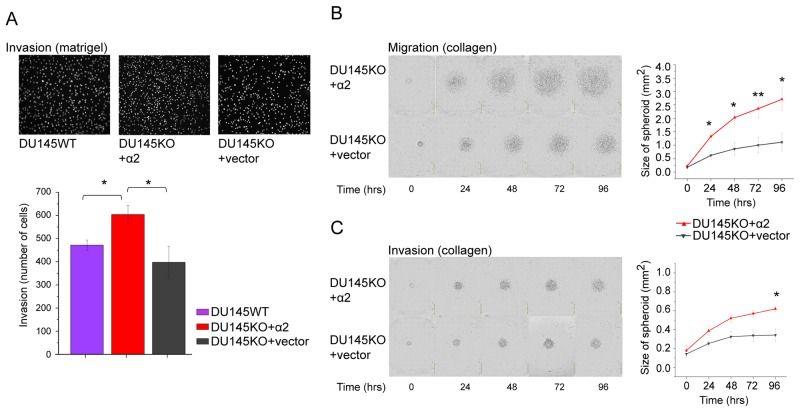
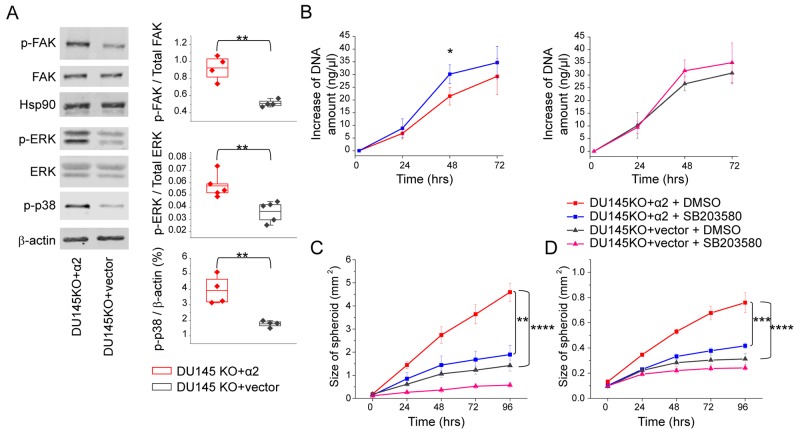
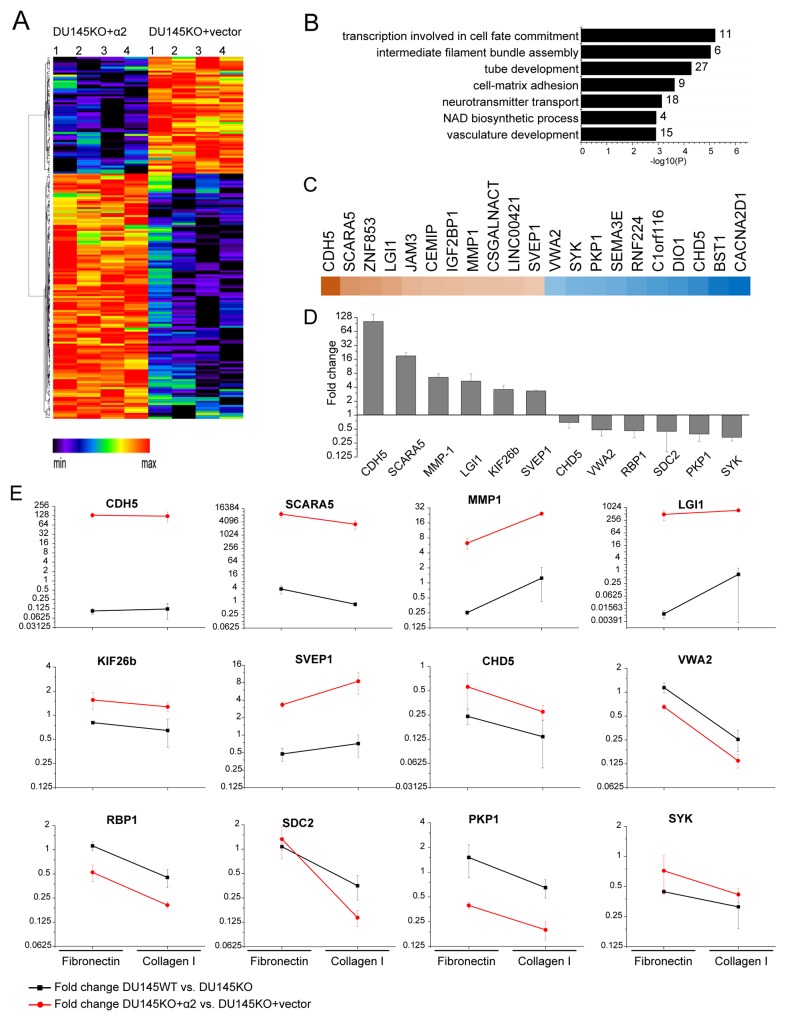
High expression level of integrin α2β1 is a hallmark of prostate cancer stem cell like cells. The role of this collagen receptor is controversial since it is down regulated in poorly differentiated carcinomas, but concomitantly proposed to promote metastasis. Here, we show that docetaxel resistant DU145 prostate cancer cells express high levels of α2β1 and that α2β1High subpopulation of DU145 cells proliferates slower than the cells representing α2β1Low subpopulation. To further study this initial observation we used Crispr/Cas9 technology to create an α2β1 negative DU145 cell line. Furthermore, we performed rescue experiment by transfecting α2 knockout cells with vector carrying α2 cDNA or with an empty vector for appropriate control. When these two cell lines were compared, α2β1 positive cells proliferated slower, were more resistant to docetaxel and also migrated more effectively on collagen and invaded faster through matrigel or collagen. Integrin α2β1 was demonstrated to be a positive regulator of p38 MAPK phosphorylation and a selective p38 inhibitor (SB203580) promoted proliferation and inhibited invasion. Effects of α2β1 integrin on the global gene expression pattern of DU145 cells in spheroid cultures were studied by RNA sequencing. Integrin α2β1 was shown to regulate several cancer progression related genes, most notably matrix metalloproteinase-1 (MMP-1), a recognized invasion promoting protein. To conclude, the fact that α2β1 decelerates cell proliferation may explain the dominance of α2β1 negative/low cells in primary sites of poorly differentiated carcinomas, while the critical role of α2β1 integrin in invasion stresses the importance of this adhesion receptor in cancer dissemination.

Keywords: cancer stem cells; cell adhesion; integrin; p38; prostate cancer.


Conflict of interest statement

CONFLICTS OF INTEREST The authors disclose no potential conflicts of interest.

Figures

Figure 1
Figure 1. DU145 cells that survive docetaxel treatment show increased expression of stem cell markers: α2 integrin and CD44
(A) The representative FACS plots show increased surface expression levels of α2 integrin and CD44 on cells that have been on collagen I or on fibronectin (5 μg/cm2) coated plates and treated with 50 nM Docetaxel for 24 hours. (B) The quantification of α2 integrin and CD44 cell surface expression based on GeoMean values. Data as mean ± SEM (n=3). * = P < 0.05; ** = P < 0.01; ns. = not significant. (C) The FACS plot illustrates the sorting of DU145WT cells into DU145WT (α2High) and DU145WT (α2Low) subpopulations based α2 integrin expression level on cells. (D) Representative FACS plots for α2 integrin, CD44 and Trop2 expression on DU145WT (α2High) and DU145WT (α2Low) subpopulations analyzed in the 5th passages after sorting. (E) Quantification of the proliferation of DU145WT (α2High) subpopulation compared to DU145WT (α2Low) subpopulation on collagen I, fibronectin and poly-l-lysine measured with the WST-8 assay. Data are mean absorbance values (OD) at 490 nm (n=3). * = P < 0.05.
Figure 2
Figure 2. α2β1 integrin expression decelerates cell proliferation, but promotes resistance to docetaxel
(A) FACS plot showing α2 integrin cell surface expression on DU145WT (purple), DU145KO (green), DU145KO+α2 (red) and DU145KO+vector (grey) cells. (B) Representative western blot demostrating α2 integrin expression in whole cell lysates of DU145WT, DU145KO, DU145KO+α2 and DU145KO+vector cells. (C) FACS plot showing surface expression levels of CD44. DU145WT (purple), DU145KO (green), DU145KO+α2 (red) and in DU145KO+vector (grey) cells. Expression of CD44 is independent from α2 and is not regulated by acquired expression of α2 integrin. (D) Representative images of DU145KO+α2 and DU145KO+vector cells grown as 3D spheroids up to 72 hours. (E) Quantification of DNA amount to measure the proliferation of DU145KO+α2 and DU145KO+vector cells in 3D spheroid culture. Data are mean ± SEM (n=3). ** = P < 0.01. (F) Representative images of DU145KO+α2 and DU145KO+vector cells in colony formation and survival assay. Below the quantification of colony survival assay comparing DU145KO+α2 and DU145KO+vector cells on fibronectin and collagen I. Data are mean ± SEM (n=3). ** = P < 0.01.
Figure 3
Figure 3. α2 integrin positive DU145 cells are more invasive than α2 negative cells
(A) Representative microscopic images (10 x) of DU145WT, DU145KO+α2 and DU145KO+vector cells that have invaded through matrigel in the transwell invasion assay. Below, the quantification of the invaded cells. Mean ± SEM (n=5). * = P < 0.05. One way ANOVA and Tukey HSD post hoc test. (B) Representative images of DU145KO+α2 and DU145KO+vector cells in migration assay. Cells were allowed to migrate out of spheroids on the collagen I coated surface for 96 hours. The quantitation of cell migration as the area covered by DU145KO+α2 and DU145KO+vector cells. Data are mean ± SEM (n=4). * = P < 0.05; ** = P < 0.01. (C) Representative images of DU145KO+α2 and DU145KO+vector cells in invasion assay. Cells were allowed to invade out of spheroids into the collagen I gel for 96 hours. The quantitation of cell invasion as the area covered with DU145KO+α2 and DU145KO+vector cells. Data are mean ± SEM (n=4). * = P < 0.05.
Figure 4
Figure 4. α2β1 integrin suppresses cell growth and promotes migration and invasion by increasing the phosphorylation of p38 MAPK
(A) Representative western blot indicating that α2 integrin expression on DU145 prostate cancer cells increased phosphorylation of FAK, ERK and p38 MAPK proteins when cells were plated on collagen I coated surface. The quantification of the phosphorylated FAK/ total FAK and phosphorylated ERK/ total ERK is shown; phosphorylation of p38 MAPK is shown as % of β-actin (a loading control). Box plot shows data from 4 or 5 independent experiments (dots) and the mean from all experiments ±SEM. ** = P < 0.01. Student’s t-test. (B) p38 MAPK inhibitor SB203580 treatment (10 μg/ml) increased proliferation of DU145 cells. Proliferation of DU145KO+α2 and DU145KO+vector cells was assessed based on the change in DNA amount in 3D spheroids. Mean (n = 3) ±SEM. * = P < 0.05. Student’s t test. (C) Inhibition of p38 MAPK with SB203580 (10μg/ml) results significantly decreased migration of DU145KO+α2 cells on collagen I. Mean (n = 3) ±SEM. ** = P < 0.01, *** = P < 0.001. One way ANOVA and Tukey HSD post hoc test. (D) Invasion capability of DU145KO+α2 cells into collagen gel decreased significantly when cells were treated with p38 MAPK inhibitor SB203580 (10μg/ml). Mean (n = 3) ±SEM. *** = P < 0.001. One way ANOVA and Tukey HSD post hoc test.
Figure 5
Figure 5. α2β1 integrin regulates the expression of cancer associated genes
(A) Differential gene expression pattern of DU145KO+α2 compared to DU145KO+vector cells. Hierarchical clustering of differentially expressed (DE) genes based on relative gene expression levels detected in RNA sequencing. Red and black colors represent over and under expressed genes, respectively. (B) Differential gene expression in DU145KO+α2 compared to DU145KO+vector cells has an effect on several biological processes. Significantly over-represented gene ontology terms based on Metascape analysis. (C) Heatmap of the most up and down regulated genes in DU145KO+α2 cells when compared to DU145KO+vector cells. Brown and blue colors represent higher and lower expression levels, respectively. (D) Real time PCR analysis of selected, α2β1 integrin associated genes, in DU145KO+α2 and in DU145KO+vector cells grown as 3D spheroids. Difference is shown as the fold change of relative mRNA expression level in DU145KO+α2 compared to DU145KO+vector expression level. Data are mean (n = 3) ±SEM. (E) Effect of cell adhesion to extracellular matrix on the selected α2 integrin associated genes. Cells were grown either on collagen I or on fibronectin for 72h, after that relative mRNA levels of selected genes was analyzed by qPCR. Each data point represents the ratio of mRNA levels in α2 positive / α2 negative cells. Both, DU145KO+α2 / DU145KO+vector (red line) and DU145WT / DU145KO (black line) comparisons were made. Data are mean (n = 3) ±SEM.

References

    1. Heino J. Cellular signaling by collagen-binding integrins. Adv Exp Med Biol. 2014;819:143–55. - PubMed
    1. Sriramarao P, Mendler M, Bourdon MA. Endothelial cell attachment and spreading on human tenascin is mediated by alpha 2 beta 1 and alpha v beta 3 integrins. J Cell Sci. 1993;105:1001–12. - PubMed
    1. Chan BM, Hemler ME. Multiple functional forms of the integrin VLA-2 can be derived from a single alpha 2 cDNA clone: interconversion of forms induced by an anti-beta 1 antibody. J Cell Biol. 1993;120:537–43. - PMC - PubMed
    1. Bix G, Fu J, Gonzalez EM, Macro L, Barker A, Campbell S, Zutter MM, Santoro SA, Kim JK, Höök M, Reed CC, Iozzo RV. Endorepellin causes endothelial cell disassembly of actin cytoskeleton and focal adhesions through alpha2beta1 integrin. J Cell Biol. 2004;166:97–109. - PMC - PubMed
    1. Guidetti G, Bertoni A, Viola M, Tira E, Balduini C, Torti M. The small proteoglycan decorin supports adhesion and activation of human platelets. Blood. 2002;100:1707–14. - PubMed