

Hydrogen peroxide production in a pilot-scale microbial electrolysis cell
- PMID: 30197872
- PMCID: PMC6127372
- DOI: 10.1016/j.btre.2018.e00276
Hydrogen peroxide production in a pilot-scale microbial electrolysis cell
Abstract
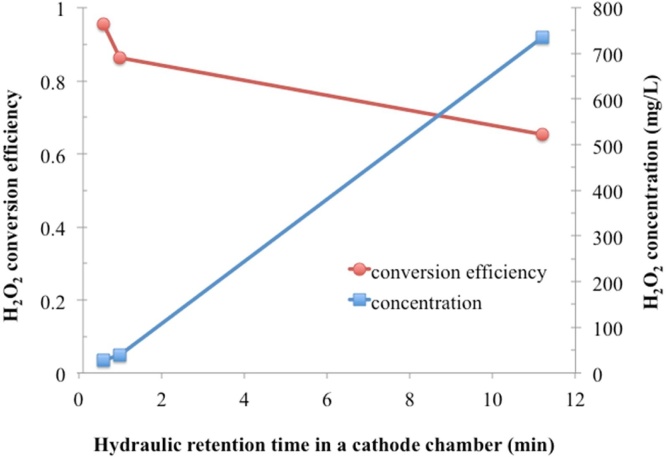
A pilot-scale dual-chamber microbial electrolysis cell (MEC) equipped with a carbon gas-diffusion cathode was evaluated for H2O2 production using acetate medium as the electron donor. To assess the effect of cathodic pH on H2O2 yield, the MEC was tested with an anion exchange membrane (AEM) and a cation exchange membrane (CEM), respectively. The maximum current density reached 0.94-0.96 A/m2 in the MEC at applied voltage of 0.35-1.9 V, regardless of membranes. The highest H2O2 conversion efficiency was only 7.2 ± 0.09% for the CEM-MEC. This low conversion would be due to further H2O2 reduction to H2O on the cathode or H2O2 decomposition in bulk liquid. This low H2O2 conversion indicates that large-scale MECs are not ideal for production of concentrated H2O2 but could be useful for a sustainable in-situ oxidation process in wastewater treatment.
Keywords: Decomposition; Hydrogen peroxide; Microbial electrolysis cells; Peroxide loss; Pilot tests.
Figures


Similar articles
-
Characterization and optimization of cathodic conditions for H2O2 synthesis in microbial electrochemical cells.Bioresour Technol. 2015 Nov;195:31-6. doi: 10.1016/j.biortech.2015.06.076. Epub 2015 Jun 24. Bioresour Technol. 2015. PMID: 26141667
-
A study of electron source preference and its impact on hydrogen production in microbial electrolysis cells fed with synthetic fermentation effluent.Bioengineered. 2023 Dec;14(1):2244759. doi: 10.1080/21655979.2023.2244759. Bioengineered. 2023. PMID: 37598370 Free PMC article.
-
Onset Investigation on Dynamic Change of Biohythane Generation and Microbial Structure in Dual-chamber versus Single-chamber Microbial Electrolysis Cells.Water Res. 2021 Aug 1;201:117326. doi: 10.1016/j.watres.2021.117326. Epub 2021 Jun 4. Water Res. 2021. PMID: 34147740
-
Influence of Nanomaterials and Other Factors on Biohydrogen Production Rates in Microbial Electrolysis Cells-A Review.Molecules. 2022 Dec 6;27(23):8594. doi: 10.3390/molecules27238594. Molecules. 2022. PMID: 36500687 Free PMC article. Review.
-
A review on self-sustainable microbial electrolysis cells for electro-biohydrogen production via coupling with carbon-neutral renewable energy technologies.Bioresour Technol. 2021 Jan;320(Pt B):124363. doi: 10.1016/j.biortech.2020.124363. Epub 2020 Nov 4. Bioresour Technol. 2021. PMID: 33186801 Review.
Cited by
-
A proof of concept study for wastewater reuse using bioelectrochemical processes combined with complementary post-treatment technologies.Environ Sci (Camb). 2019 Jun 24;5:1489-1498. doi: 10.1039/C9EW00358D. Environ Sci (Camb). 2019. PMID: 32607247 Free PMC article.
-
Sewage enhanced bioelectrochemical degradation of petroleum hydrocarbons in soil environment through bioelectro-stimulation.Biotechnol Rep (Amst). 2020 May 26;27:e00478. doi: 10.1016/j.btre.2020.e00478. eCollection 2020 Sep. Biotechnol Rep (Amst). 2020. PMID: 32518761 Free PMC article.
-
Scaling-up of microbial electrosynthesis with multiple electrodes for in situ production of hydrogen peroxide.iScience. 2021 Jan 22;24(2):102094. doi: 10.1016/j.isci.2021.102094. eCollection 2021 Feb 19. iScience. 2021. PMID: 33748698 Free PMC article.
References
-
- Zhang Y., Angelidaki I. Microbial electrolysis cells turning to be versatile technology: recent advances and future challenges. Water Res. 2014;56:11–25. - PubMed
-
- Lee H.S., Vermaas W.F.J., Rittmann B.E. Biological hydrogen production: prospects and challenges. Trends Biotechnol. 2010;28:262–271. - PubMed
-
- Cusick R.D., Bryan B., Parker D.S., Merrill M.D., Mehanna M., Kiely P.D., Liu G., Logan B.E. Performance of a pilot-scale continuous flow microbial electrolysis cell fed winery wastewater. Appl. Microbiol. Biotechnol. 2011;89:2053–2063. - PubMed
-
- Gil-Carrera L., Escapa A., Carracedo B., Morán A., Gómez X. Performance of a semi-pilot tubular microbial electrolysis cell (MEC) under several hydraulic retention times and applied voltages. Bioresour. Technol. 2013;146:63–69. - PubMed
-
- Zhang F., Ge Z., Grimaud J., Hurst J., He Z. Long-term performance of liter-scale microbial fuel cells treating primary effluent installed in a municipal wastewater treatment facility. Environ. Sci. Technol. 2013;47:4941–4948. - PubMed
LinkOut - more resources
Full Text Sources
Other Literature Sources