. 2018 Oct 1;128(10):4654-4668.
doi: 10.1172/JCI99317. Epub 2018 Sep 10.

Contribution of NK cells to immunotherapy mediated by PD-1/PD-L1 blockade

Affiliations

Contribution of NK cells to immunotherapy mediated by PD-1/PD-L1 blockade

Joy Hsu et al. J Clin Invest. .

Abstract

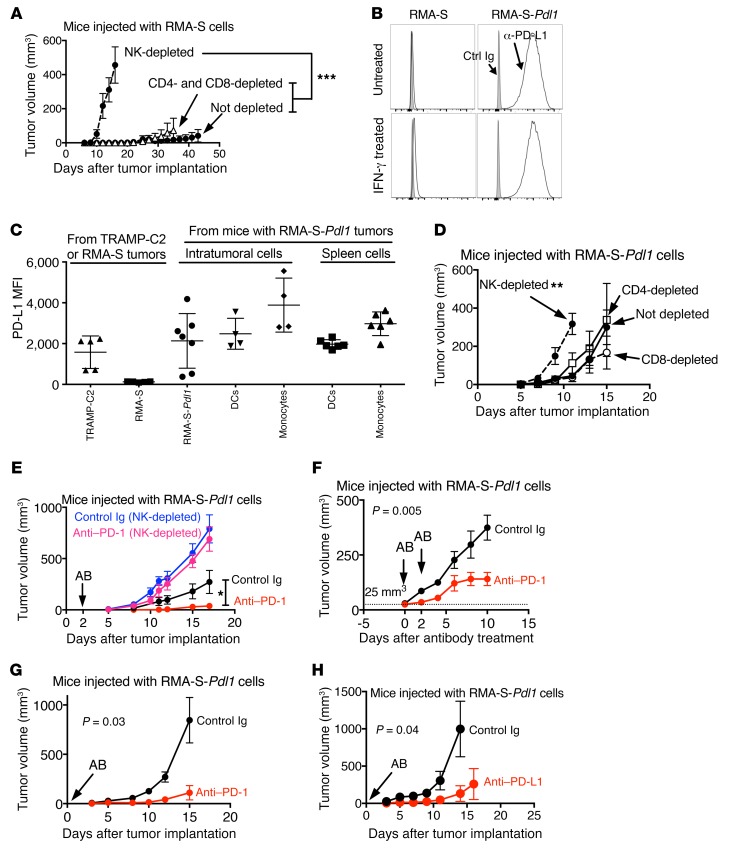
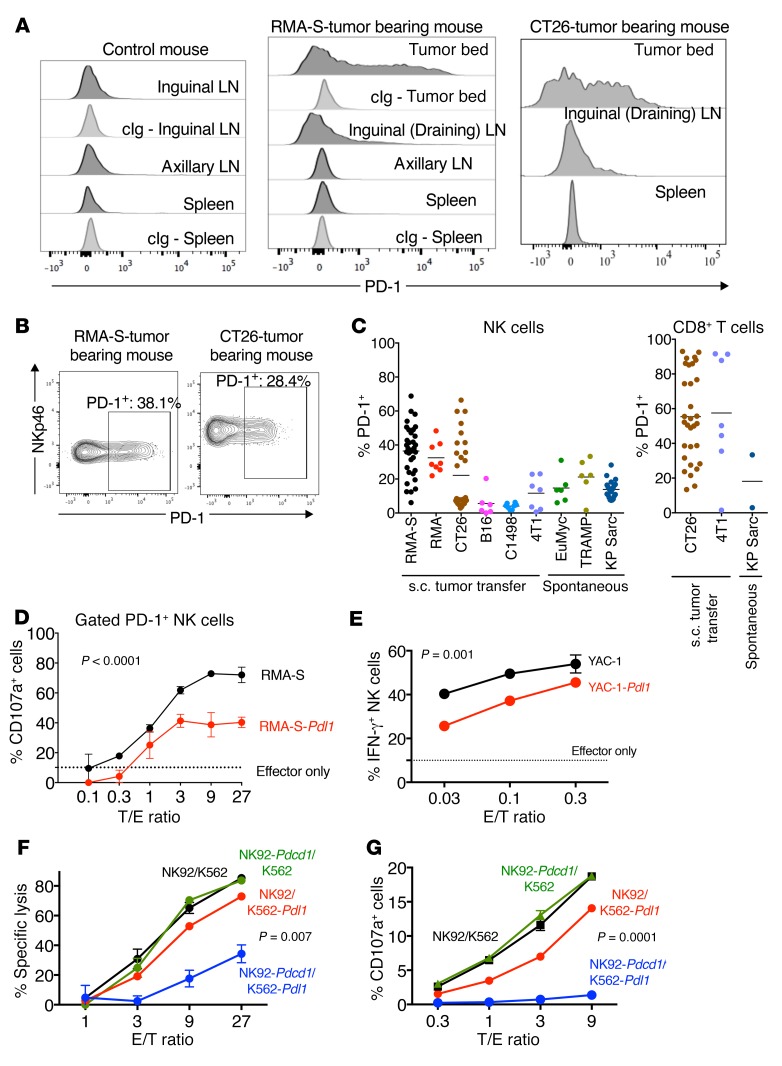
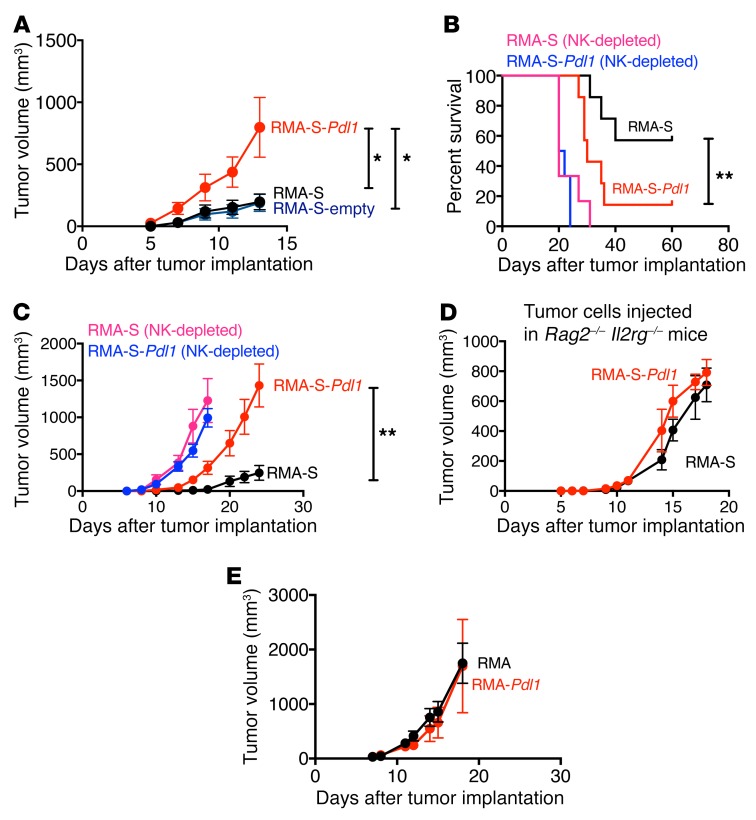
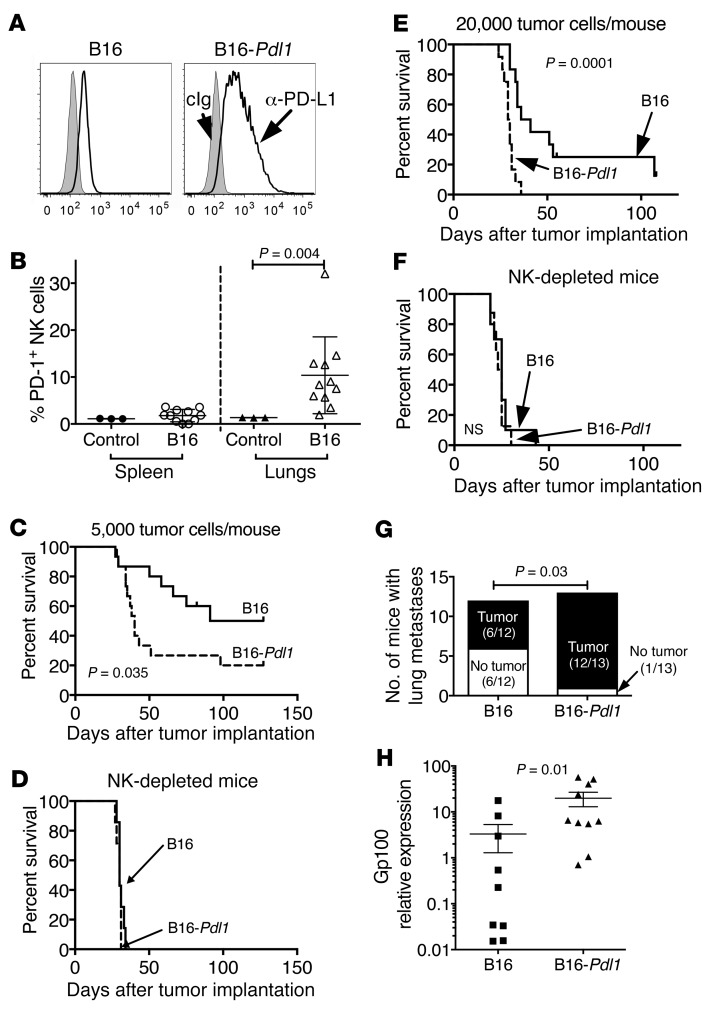
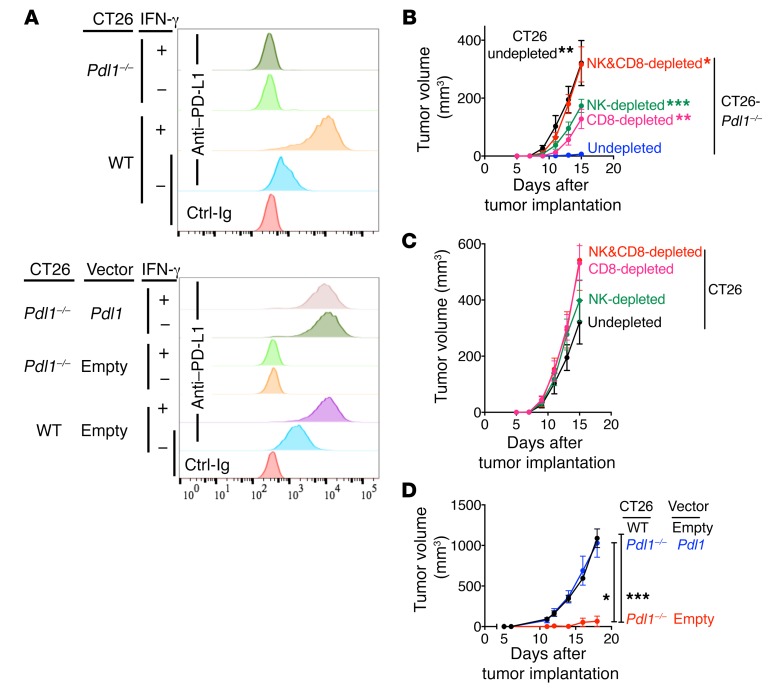
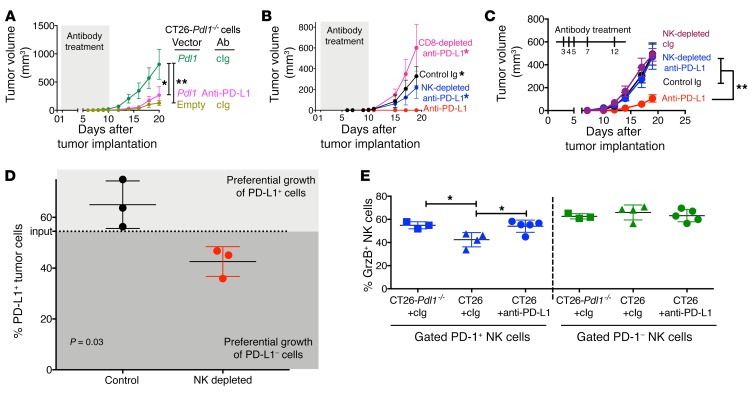
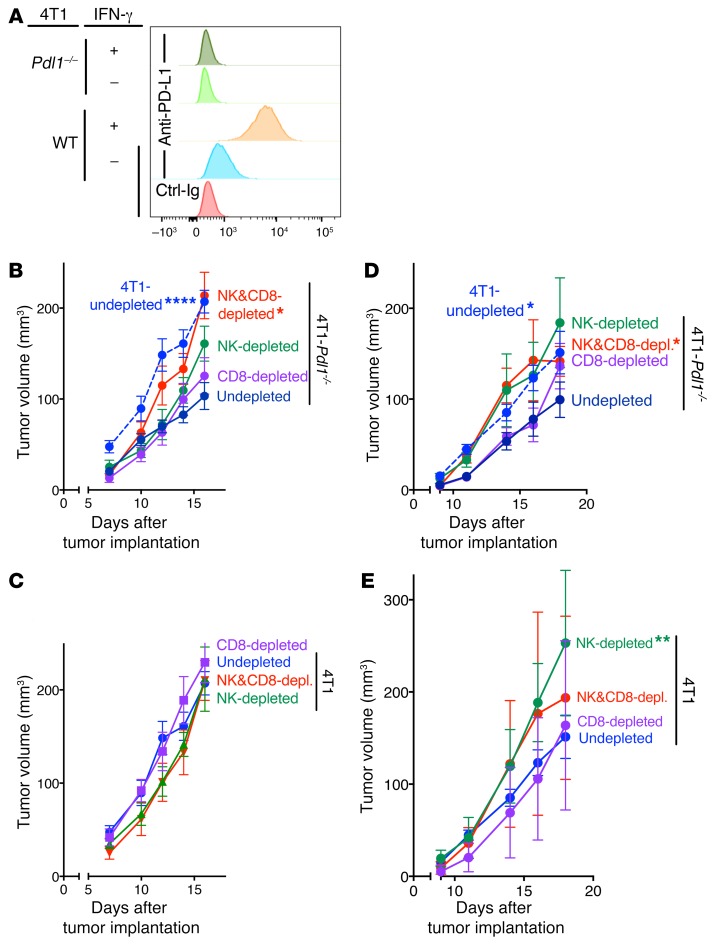
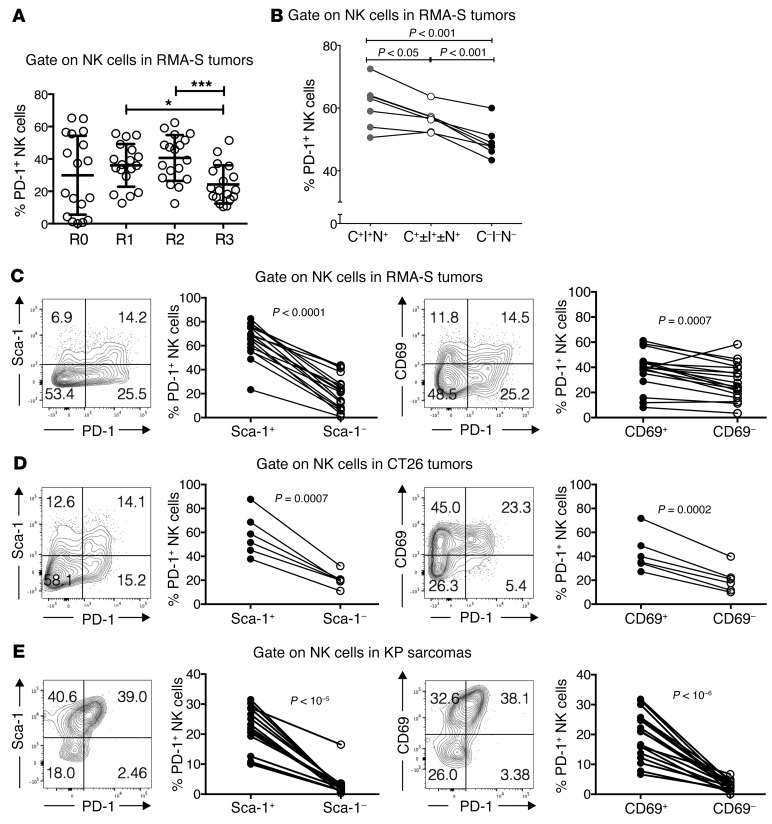
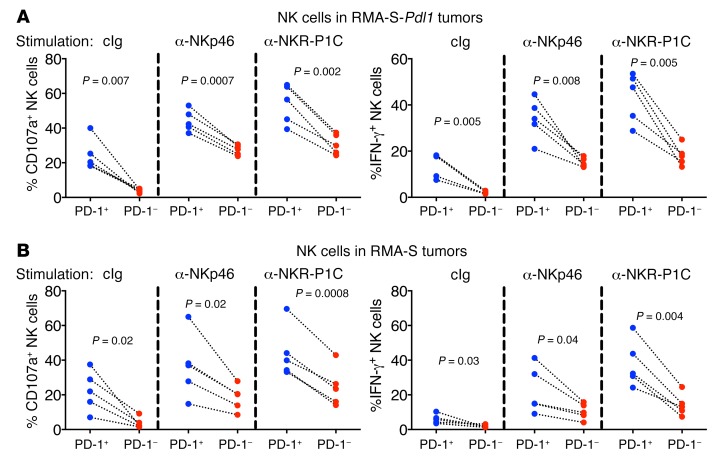
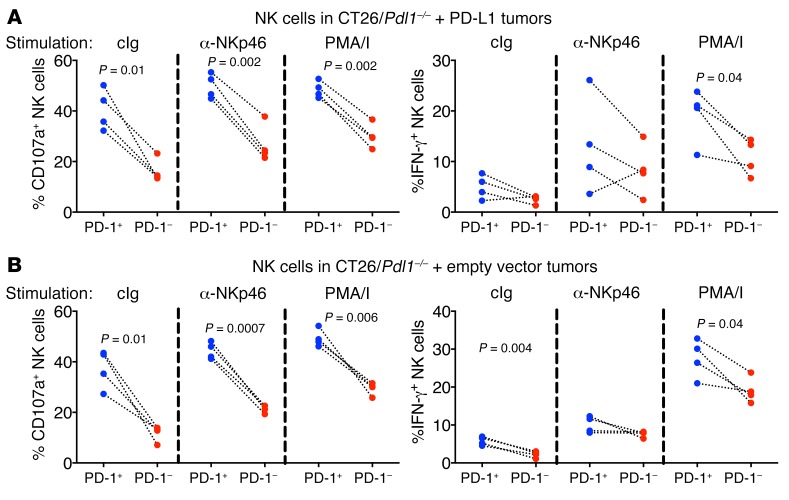
Checkpoint blockade immunotherapy targeting the PD-1/PD-L1 inhibitory axis has produced remarkable results in the treatment of several types of cancer. Whereas cytotoxic T cells are known to provide important antitumor effects during checkpoint blockade, certain cancers with low MHC expression are responsive to therapy, suggesting that other immune cell types may also play a role. Here, we employed several mouse models of cancer to investigate the effect of PD-1/PD-L1 blockade on NK cells, a population of cytotoxic innate lymphocytes that also mediate antitumor immunity. We discovered that PD-1 and PD-L1 blockade elicited a strong NK cell response that was indispensable for the full therapeutic effect of immunotherapy. PD-1 was expressed on NK cells within transplantable, spontaneous, and genetically induced mouse tumor models, and PD-L1 expression in cancer cells resulted in reduced NK cell responses and generation of more aggressive tumors in vivo. PD-1 expression was more abundant on NK cells with an activated and more responsive phenotype and did not mark NK cells with an exhausted phenotype. These results demonstrate the importance of the PD-1/PD-L1 axis in inhibiting NK cell responses in vivo and reveal that NK cells, in addition to T cells, mediate the effect of PD-1/PD-L1 blockade immunotherapy.

Keywords: Immunology; Immunotherapy; Innate immunity; NK cells.


Conflict of interest statement

Conflict of interest: DHR is a cofounder of Dragonfly Therapeutics and served on the Scientific Advisory Boards of Innate Pharma, Aduro Biotech, and IGNITE Immmunotherapy; he has a financial interest in all 4 companies and received research support from Innate Pharma. JCB is a cofounder and has equity in Turnstone Biologics, from which he receives consulting fees and research support for his lab. MCBD and JCB both have patented intellectual properties, not related to the present article (see Supplemental Data for complete information).

Figures

Figure 1
Figure 1. Therapeutic antitumor effect of PD-1 or PD-L1 antibodies dependent on NK cells.
(A) NK, CD4+, and/or CD8+ T cells were depleted before s.c. injection of 106 RMA-S cells. Tumor volumes (mean ± SEM) are shown. Experiments depicted are representative of 2 performed. n = 4–5/group. Two-way ANOVA. ***P < 0.001. (B) PD-L1 expression was analyzed on cells stimulated or not with 20 ng/ml IFN-γ for 48 hours. Experiments depicted are representative of 3 performed. (C) 2 × 10⁶ RMA-S or RMA-S–Pdl1 cells (naturally expressing CD45.2) or TRAMP-C2 cells (transduced with Thy1.1) were injected s.c. into C57BL/6J-CD45.1+ mice, and PD-L1 expression was analyzed on splenic or intratumoral cells, gating on dendritic cells (viable CD45.1+CD3CD19Ter119NK1.1CD11b+Ly6GCD11chi), monocytes (viable CD45.1+CD3CD19Ter119NK1.1CD11b+Ly6GCD11cLy6C+), and tumor cells (viable CD45.1CD45.2+ cells for RMA-S and RMA-S–Pdl1; or viable CD45.2Thy1.1+ cells for TRAMP-C2). The MFI of isotype control–stained cells was subtracted from the MFI of PD-L1–stained cells. Two experiments were pooled (n = 5–7/group). (D) 106 RMA-S–Pdl1 cells were injected in mice depleted of NK or CD8+ or CD4+ T cells. Tumor volumes (mean ± SEM) are shown. Experiments depicted are representative of 2 performed. n = 4–5/group. Two-way ANOVA. **P < 0.01. (E) 106 RMA-S–Pdl1 cells were injected in C57BL/6J mice, and after 2 days, 250 μg PD-1 or control antibody was administered. Some mice were depleted of NK cells 2 days before tumor cell injection. Pooled data from 2 of the 3 experiments performed are shown. n = 6–11/group. Two-way ANOVA. Both NK-depleted groups were significantly different than the corresponding undepleted groups. (F) 106 RMA-S–Pdl1 cells were injected, and tumors were allowed to grow to an average of 25 mm3, at which time (and 2 days later), mice were treated with 250 μg PD-1 antibody or control antibody. Experiments shown are representative of 2 performed. n = 5/group. Two-way ANOVA. (GH) 0.5 × 10⁶ RMA-S–Pdl1 tumor cells were mixed with Matrigel and either 20 μg anti–PD-1 or control Ig (E, G) or anti–PD-L1 or control Ig (F, H) and injected s.c. in C57BL/6 mice. Experiments were repeated at least 2 times, with n = 4–5/group. Two-way ANOVA.
Figure 2
Figure 2. PD-1 is expressed on tumor-infiltrating NK cells and suppresses NK cell cytotoxicity in vitro.
(AB) C57BL/6J mice were injected s.c. with 2 × 10⁶ RMA-S cells or PBS; BALB/cJ mice were injected with 0.5 × 10⁶ CT26 cells. PD-1 expression was assessed after 13 days on NK cells from spleens, axillary LNs, inguinal LNs, and tumors. Staining for PD-1 (dark gray histograms) or control IgG (cIg) (light gray histograms) is shown. NK cells were gated as viable Ter119CD3CD19F4/80NKp46+ cells in BALB/cJ or Ter119CD3CD19F4/80NKp46+NK1.1+ cells in C57BL/6J mice. Experiments shown are representative of 6 performed. n = 3–5. (C) Summary of PD-1 expression on intratumoral NK and CD8+ T cells in mice injected with RMA, RMA-S, B16, C1498, CT26, 4T1, or A20 cells or on intratumoral NK cells in the prostates or thymi from spontaneous cancer models (TRAMP and Eu-Myc models, respectively) or in KP sarcomas. PD-1 expression on NK cells in each model was assessed in at least 3 independent experiments with at least n = 3. (DE) IL-2–activated NK cells previously transduced with a Pdcd1 expression vector were stimulated with RMA-S or RMA-S–Pdl1 cells at different T/E ratios before determining degranulation (D) and IFN-γ production (E) of PD-1+ NK cells. Experiments depicted are representative of 3 performed. Every T/E ratio is shown as average ± SD of 3 technical replicates. Two-way ANOVA. (FG) NK92 cells transduced with Pdcd1 (Pdcd1 encodes PD-1) or an empty vector were stimulated with K562 or K562-Pdl1 cells, and lysis of target cells (F) or degranulation of effector cells (G) was assessed by flow cytometry. Data shown in F and G are representative of 4 and 2 experiments performed, respectively. Every T/E ratio shows the average of 3 technical replicates. Note that in instances in which responses increase with more target cells, we plotted T/E ratios, wherease in cases in which the response increases with more effector cells, we plotted E/T ratios. Two-way ANOVA with repeated measures.
Figure 3
Figure 3. Expression of PD-L1 by NK cell–sensitive, T cell–resistant tumor cells promotes more aggressive tumor growth in vivo.
(A) RMA-S cells were transduced with PD-L1 expression vector or an empty control vector. G418-resistant transductants were selected. Transduced cells, as well as untransduced RMA-S cells, were injected into C57BL/6J mice (106 cells/mouse s.c.), and tumor growth was monitored. Tumor volumes (mean ± SEM) are shown for each time point. The experiment shown is representative of 3 performed. n = 5–6. *P < 0.05, 2-way ANOVA. Survival (B) and in vivo tumor growth (mean ± SEM) (C) were assessed after s.c. injection of 1 × 10⁶ RMA-S or RMA-S–Pdl1 tumor cells in C57BL/6J mice. Where indicated, NK cells were depleted by injecting NK1.1 antibody. The results depicted are representative of 8 independent experiments, 2 of which included NK cell–depleted mice for comparison. In the experiment shown, n = 6–7 per group. **P < 0.01, log-rank (Mantel-Cox) test (B); 2-way ANOVA test (C). (D) 106 RMA-S or RMA-S–Pdl1 cells were injected s.c. into Rag2–/–Il2rg–/– mice, and tumor growth was assessed. Tumor volumes (mean ± SEM) are shown. Experiment shown is representative of 3 independent experiments, n = 4/group. (E) 106 RMA or RMA-Pdl1 tumor cells were injected s.c. into C57BL/6J mice, and tumor growth was monitored. Tumor volumes (mean ± SEM) are shown. Experiment shown is representative of 2 performed. n = 5 for RMA group and n = 6 for RMA-Pdl1 group.
Figure 4
Figure 4. PD-1 suppresses NK cell–mediated control of B16 colonization in the lungs.
(A) B16 cells were transduced with a retroviral vector encoding mouse PD-L1 and sorted for PD-L1 expression. (B) C57BL/6J mice were injected i.v. with 0.25 × 10⁶ B16 tumor cells or saline solution. Mice were sacrificed at terminal stage of disease, and PD-1 expression was assessed by flow cytometry on splenic or lung NK cells. NK cells were gated as viable CD45+Ter119CD3CD19F4/80NK1.1+NKp46+. Student’s t test. (CF) Kaplan-Meier analyses of C57BL/6J mice injected i.v. with 5,000 (C, D) or 20,000 (E, F) B16 or B16-Pdl1 cells. For D and F, mice were NK depleted with NK1.1 antibody. Data for C and D represent results pooled from 2 experiments, with n = 7–15/group. Data for E and F represent results pooled from 2 experiments, with n = 8–12/combined group. log-rank (Mantel-Cox) test. (G) C57BL/6 mice were injected i.v. with 2 × 10⁴ B16 or B16-Pdl1 cells. Twenty-one days later, the presence of tumors in the lungs was assessed by macroscopic examination. Data are from 2 independent experiments with n = 12–13/combined group. Fisher’s exact test. (H) C57BL/6 mice were injected i.v. with 20,000 B16 or B16-Pdl1 cells. Twenty-one days later, tumor burden in the lungs was assessed by qRT-PCR of transcripts of the melanoma-specific gene Gp100. H shows a combination of 2 independent experiments with n = 9–10/group. Mann-Whitney U test.
Figure 5
Figure 5. PD-L1 expression by CT26 tumor cells prevents tumor rejection mediated by NK cells and CD8+ T cells.
(A) PD-L1 expression by CT26 cell variants. Cells were untreated or treated with 20 ng/ml IFN-γ for 48 hours, and PD-L1 expression was analyzed by flow cytometry. Top panel: comparison of CT26 and CT26-Pdl1–/– cells. Lower panel: comparison of CT26-Pdl1–/– cells transduced with a PD-L1 expression vector or with an empty vector. WT CT26 cells transduced with empty vector served as a control. (B, C) In vivo growth of CT26 or CT26-Pdl1–/– tumors was assessed after s.c. injection of 0.5 × 10⁶ cells in BALB/cJ mice. Some mice were depleted of NK cells (with asialo GM-1 antibody), CD8+ T cells (with CD8α-specific 2.43 antibody), or both before tumor cell injection. Tumor volumes (mean ± SEM) are shown. For B, 2-way ANOVA tests were used to compare CT26-Pdl1–/–/undepleted mice with either CT26/undepleted mice (P < 0.01), CT26-Pdl1–/–/NK-depleted mice (P < 0.0001), or CT26-Pdl1–/–/CD8-depleted mice (P < 0.01). Two-way ANOVA tests were also used to compare CT26-Pdl1–/–/NK&CD8-depleted mice to either CT26-Pdl1–/–/CD8-depleted mice (P < 0.05) or CT26-Pdl1–/–/NK-depleted mice (P = 0.0599). For C, none of the differences were significant. Data from B and C are from the same experiment, which is representative of 2 performed. n = 8 for the experiment shown. (D) 0.2 × 10⁶ CT26-Pdl1–/– cells transduced with an empty vector or a PD-L1 expression vector or CT26 WT cells transduced with an empty vector were injected s.c. in BALB/cJ mice, and tumor progression was assessed. Experiment depicted is representative of 3 performed. n = 3–4 mice/group. *P < 0.05; ***P < 0.001, 2-way ANOVA.
Figure 6
Figure 6. NK cells are necessary to mediate full therapeutic efficacy of PD-L1 blockade in the NK- and T cell–sensitive CT26 tumor model.
(A) Mice were injected with 0.2 × 10⁶ CT26-Pdl1–/– cells transduced with an empty vector or a PD-L1 expression vector and treated with 250 μg anti–PD-L1 or control Ig daily for 10 days by i.p. injection. *P < 0.05; **P < 0.01, 2-way ANOVA. n = 4–5 mice/group. Experiment is representative of 3 performed. (B) 0.2 × 10⁶ CT26-Pdl1–/– cells transduced with a PD-L1 expression vector were injected into BALB/cJ mice. Where indicated, NK or CD8+ T cells were depleted by i.p. injection of anti–asialo GM1 or 2.43 antibodies 2 and 1 day before tumor injection. Mice were treated with 250 μg anti–PD-L1 or control Ig daily for 10 days by i.p. injection. n = 4–5 mice/group. Experiment is representative of 3 performed. Mann-Whitney U tests comparing the anti–PD-L1 group with the other experimental groups at days 15, 17, and 19. *P < 0.05 for all such comparisons. (C) BALB/cJ mice were injected with 0.25 × 10⁶ CT26-Pdl1–/– plus Pdl1 cells. PD-L1 or cIg antibodies were injected 3, 4, 5, 7, and 12 days after tumor injection. Some mice were NK depleted 2, 9, and 16 days after tumor injection. n = 6–9 mice/group. Data are from the combination of 2 independent experiments. **P < 0.01, 2-way ANOVA with repeated measurements. (D) 500,000 Cells comprising a 1:1 mixture of CT26-Pdl1–/– plus Pdl1-IRES-Thy1.1 and CT26-Pdl1–/– plus empty-IRES-Thy1.1 cells were injected in BALB/cJ mice depleted or not of NK cells. Tumors were analyzed by flow cytometry as soon as they became palpable. Tumor cells were identified as CD45Thy1.1+. Experiments are representative of 3 performed. n = 3/group. Two-tailed paired Student’s t test. (E) 0.2 × 10⁶ CT26 or CT26-Pdl1–/– cells were injected s.c. in BALB/cJ mice. Once tumors were established, mice were treated with 250 μg/d of PD-L1 or control antibody for 2 days and intracellular granzyme B expression was assessed in PD-1+ or PD-1 tumor-infiltrating NK cells. Experiment is representative of 2 performed. n = 3–5 mice/group. *P < 0.05, 2-tailed unpaired Student’s t tests.
Figure 7
Figure 7. PD-1 engagement suppresses NK cell responses to 4T1 orthotopic tumors.
(A) 4T1 or 4T1-Pdl1–/– cells were stimulated or not with IFN-γ, and PD-L1 expression was analyzed by flow cytometry. (BE) 100,000 Tumor cells were injected in the mammary fat pad of BALB/cJ mice. Where indicated, mice were immune depleted 2 and 1 days before tumor injection and then 7 and 14 days after tumor injection. Results from B and C come from the same experiment. Results from D and E come from the same experiment. n = 7–8 mice/group. The 2 experiments are representative of 3 performed. *P < 0.05; **P < 0.01; ****P < 0.00001, 2-way ANOVA with repeated measurements comparing every group with 4T1-Pdl1–/– undepleted (B and D) or 4T1 undepleted (C and E).
Figure 8
Figure 8. PD-1 is upregulated on the most activated tumor-infiltrating NK cells.
(A) PD-1 expression on different NK cell maturation subsets in RMA-S tumors. R0–R3 stages are as follows: R0, CD27CD11b; R1, CD27+CD11b; R2, CD27+CD11b+; R3, CD27CD11b+. Three independent experiments were pooled (n = 7–18/combined group). One-way ANOVA with repeated measures. *P < 0.05; ***P < 0.001. (B) NK cells from RMA-S tumors were stained with antibodies for Ly49I (I), Ly49C (C), and NKG2A (N), and PD-1 expression was assessed on the 3 populations by flow cytometry. C+I+N+ cells expressed all the receptors; C+±I+±N+ cells expressed at least 1 of the receptors; CIN NK cells lacked expression of all 3 receptors. Data from 2 independent experiments are included. One-way ANOVA with repeated measures. NK cells from RMA-S (C), CT26 (D), or KP sarcoma (E) tumors were costained with PD-1 antibody and antibody against Sca-1 or CD69. PD-1 expression was assessed by flow cytometry on gated NK cells that did or did not express such markers. Representative contour plots and summary of the data are depicted. For C and E, 3 independent experiments were pooled; for D, 2 independent experiments were pooled. n = 6–15. Two-tailed paired Student’s t test.
Figure 9
Figure 9. In RMA-S tumors, PD-1+ NK cells are more functionally responsive than PD-1–negative NK cells.
NK cells from RMA-S–Pdl1–derived (A) or RMA-S–derived (B) tumors were stimulated with plate-bound isotype control, anti-NKp46, or anti-NKR-P1C, and degranulation and IFN-γ accumulation of PD-1+ vs. PD-1 NK cells was assessed. Experiments are representative of 2 performed. n = 4–5. Two-tailed paired Student’s t test.
Figure 10
Figure 10. In CT26 tumors, PD-1+ NK cells are more responsive than PD-1–negative NK cells.
NK cells from tumors deriving from CT26-Pdl1–/– cells reconstituted with PD-L1 (A) or an empty vector (B) were stimulated with plate-bound isotype control or anti-NKp46 or PMA/I. Degranulation and IFN-γ accumulation of PD-1+ vs. PD-1 NK cells were assessed. Experiments are representative of 2 performed. n = 4. Two-tailed paired Student’s t test.

Comment in

Similar articles

Cited by

References

    1. Topalian SL, et al. Safety, activity, and immune correlates of anti-PD-1 antibody in cancer. N Engl J Med. 2012;366(26):2443–2454. doi: 10.1056/NEJMoa1200690. - DOI - PMC - PubMed
    1. Brahmer JR, et al. Safety and activity of anti-PD-L1 antibody in patients with advanced cancer. N Engl J Med. 2012;366(26):2455–2465. doi: 10.1056/NEJMoa1200694. - DOI - PMC - PubMed
    1. Hamid O, et al. Safety and tumor responses with lambrolizumab (anti-PD-1) in melanoma. N Engl J Med. 2013;369(2):134–144. doi: 10.1056/NEJMoa1305133. - DOI - PMC - PubMed
    1. Callahan MK, Postow MA, Wolchok JD. CTLA-4 and PD-1 pathway blockade: combinations in the clinic. Front Oncol. 2014;4:385. - PMC - PubMed
    1. Robert C, et al. Anti-programmed-death-receptor-1 treatment with pembrolizumab in ipilimumab-refractory advanced melanoma: a randomised dose-comparison cohort of a phase 1 trial. Lancet. 2014;384(9948):1109–1117. doi: 10.1016/S0140-6736(14)60958-2. - DOI - PubMed

Publication types

MeSH terms