Inhibition of the aryl hydrocarbon receptor/polyamine biosynthesis axis suppresses multiple myeloma
- PMID: 30198908
- PMCID: PMC6159960
- DOI: 10.1172/JCI70712
Inhibition of the aryl hydrocarbon receptor/polyamine biosynthesis axis suppresses multiple myeloma
Abstract
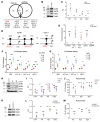
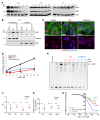
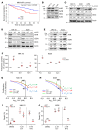
Polyamine inhibition for cancer therapy is, conceptually, an attractive approach but has yet to meet success in the clinical setting. The aryl hydrocarbon receptor (AHR) is the central transcriptional regulator of the xenobiotic response. Our study revealed that AHR also positively regulates intracellular polyamine production via direct transcriptional activation of 2 genes, ODC1 and AZIN1, which are involved in polyamine biosynthesis and control, respectively. In patients with multiple myeloma (MM), AHR levels were inversely correlated with survival, suggesting that AHR inhibition may be beneficial for the treatment of this disease. We identified clofazimine (CLF), an FDA-approved anti-leprosy drug, as a potent AHR antagonist and a suppressor of polyamine biosynthesis. Experiments in a transgenic model of MM (Vk*Myc mice) and in immunocompromised mice bearing MM cell xenografts revealed high efficacy of CLF comparable to that of bortezomib, a first-in-class proteasome inhibitor used for the treatment of MM. This study identifies a previously unrecognized regulatory axis between AHR and polyamine metabolism and reveals CLF as an inhibitor of AHR and a potentially clinically relevant anti-MM agent.
Keywords: Cancer; Cell Biology; Oncology; Polyamines.
Conflict of interest statement
Figures


Comment in
-
Targeting the aryl hydrocarbon receptor/polyamine biosynthesis axis of evil for cancer therapy.J Clin Invest. 2018 Oct 1;128(10):4254-4256. doi: 10.1172/JCI123266. Epub 2018 Sep 10. J Clin Invest. 2018. PMID: 30198903 Free PMC article.
Similar articles
-
Clofazimine inhibits small-cell lung cancer progression by modulating the kynurenine/aryl hydrocarbon receptor axis.Int J Biol Macromol. 2024 Dec;282(Pt 3):136921. doi: 10.1016/j.ijbiomac.2024.136921. Epub 2024 Oct 28. Int J Biol Macromol. 2024. PMID: 39490481
-
Targeting the aryl hydrocarbon receptor/polyamine biosynthesis axis of evil for cancer therapy.J Clin Invest. 2018 Oct 1;128(10):4254-4256. doi: 10.1172/JCI123266. Epub 2018 Sep 10. J Clin Invest. 2018. PMID: 30198903 Free PMC article.
-
Selective suppression of the human aryl hydrocarbon receptor function can be mediated through binding interference at the C-terminal half of the receptor.Biochem Pharmacol. 2016 May 1;107:91-100. doi: 10.1016/j.bcp.2016.03.004. Epub 2016 Mar 9. Biochem Pharmacol. 2016. PMID: 26970402 Free PMC article.
-
Functional expression of aryl hydrocarbon receptor as a potential novel therapeutic target in human multiple myeloma.Leuk Lymphoma. 2021 Dec;62(12):2968-2980. doi: 10.1080/10428194.2021.1948033. Epub 2021 Jul 7. Leuk Lymphoma. 2021. PMID: 34232800
-
The Aryl Hydrocarbon Receptor in Energy Balance: The Road from Dioxin-Induced Wasting Syndrome to Combating Obesity with Ahr Ligands.Int J Mol Sci. 2020 Dec 23;22(1):49. doi: 10.3390/ijms22010049. Int J Mol Sci. 2020. PMID: 33374508 Free PMC article. Review.
Cited by
-
Immunoregulatory Interplay Between Arginine and Tryptophan Metabolism in Health and Disease.Front Immunol. 2019 Jul 9;10:1565. doi: 10.3389/fimmu.2019.01565. eCollection 2019. Front Immunol. 2019. PMID: 31354721 Free PMC article. Review. No abstract available.
-
The aryl hydrocarbon receptor as a tumor modulator: mechanisms to therapy.Front Oncol. 2024 May 14;14:1375905. doi: 10.3389/fonc.2024.1375905. eCollection 2024. Front Oncol. 2024. PMID: 38807762 Free PMC article. Review.
-
AhR and Cancer: From Gene Profiling to Targeted Therapy.Int J Mol Sci. 2021 Jan 13;22(2):752. doi: 10.3390/ijms22020752. Int J Mol Sci. 2021. PMID: 33451095 Free PMC article. Review.
-
Immunosuppressive metabolites in tumoral immune evasion: redundancies, clinical efforts, and pathways forward.J Immunother Cancer. 2021 Oct;9(10):e003013. doi: 10.1136/jitc-2021-003013. J Immunother Cancer. 2021. PMID: 34667078 Free PMC article. Review.
-
The Tumor Microenvironment-Dependent Transcription Factors AHR and HIF-1α Are Dispensable for Leukemogenesis in the Eµ-TCL1 Mouse Model of Chronic Lymphocytic Leukemia.Cancers (Basel). 2021 Sep 8;13(18):4518. doi: 10.3390/cancers13184518. Cancers (Basel). 2021. PMID: 34572746 Free PMC article.
References
-
- Durie BG, Salmon SE, Russell DH. Polyamines as markers of response and disease activity in cancer chemotherapy. Cancer Res. 1977;37(1):214–221. - PubMed
Publication types
MeSH terms
Substances
Grants and funding
- F32 CA189622/CA/NCI NIH HHS/United States
- K00 CA212455/CA/NCI NIH HHS/United States
- R01 CA224434/CA/NCI NIH HHS/United States
- F99 CA212455/CA/NCI NIH HHS/United States
- R25 GM095459/GM/NIGMS NIH HHS/United States
- R01 CA197996/CA/NCI NIH HHS/United States
- R01 CA193981/CA/NCI NIH HHS/United States
- T32 CA085183/CA/NCI NIH HHS/United States
- P30 CA016056/CA/NCI NIH HHS/United States
- R01 AI100157/AI/NIAID NIH HHS/United States
- R01 CA121044/CA/NCI NIH HHS/United States
- R01 CA190533/CA/NCI NIH HHS/United States
- R21 CA220096/CA/NCI NIH HHS/United States
- P50 CA186781/CA/NCI NIH HHS/United States
LinkOut - more resources
Full Text Sources
Other Literature Sources
Medical
Molecular Biology Databases
Research Materials

