. 2018 Oct 1;128(10):4639-4653.
doi: 10.1172/JCI99490. Epub 2018 Sep 10.

Pseudomonas aeruginosa utilizes host polyunsaturated phosphatidylethanolamines to trigger theft-ferroptosis in bronchial epithelium

Affiliations

Pseudomonas aeruginosa utilizes host polyunsaturated phosphatidylethanolamines to trigger theft-ferroptosis in bronchial epithelium

Haider H Dar et al. J Clin Invest. .

Abstract

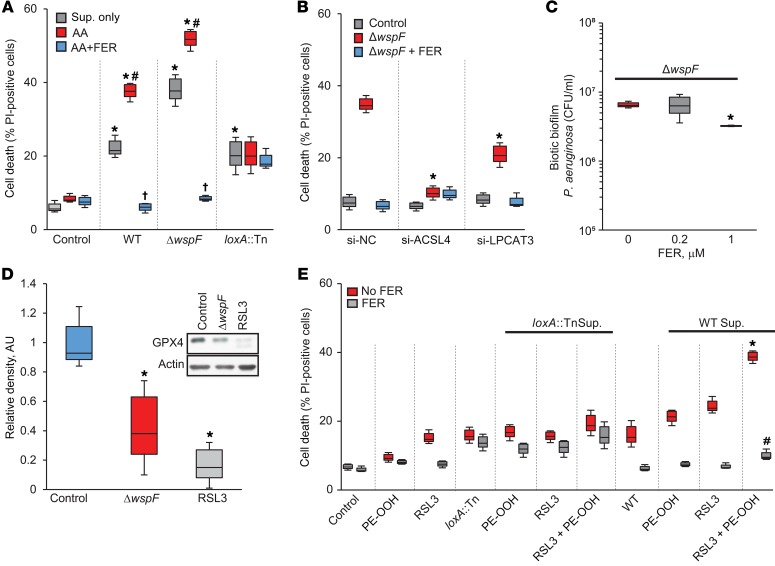
Ferroptosis is a death program executed via selective oxidation of arachidonic acid-phosphatidylethanolamines (AA-PE) by 15-lipoxygenases. In mammalian cells and tissues, ferroptosis has been pathogenically associated with brain, kidney, and liver injury/diseases. We discovered that a prokaryotic bacterium, Pseudomonas aeruginosa, that does not contain AA-PE can express lipoxygenase (pLoxA), oxidize host AA-PE to 15-hydroperoxy-AA-PE (15-HOO-AA-PE), and trigger ferroptosis in human bronchial epithelial cells. Induction of ferroptosis by clinical P. aeruginosa isolates from patients with persistent lower respiratory tract infections was dependent on the level and enzymatic activity of pLoxA. Redox phospholipidomics revealed elevated levels of oxidized AA-PE in airway tissues from patients with cystic fibrosis (CF) but not with emphysema or CF without P. aeruginosa. We believe that the evolutionarily conserved mechanism of pLoxA-driven ferroptosis may represent a potential therapeutic target against P. aeruginosa-associated diseases such as CF and persistent lower respiratory tract infections.

Keywords: Bacterial infections; Cell Biology; Infectious disease.


Conflict of interest statement

Conflict of interest: The authors have declared that no conflict of interest exists.

Figures

Figure 1
Figure 1. pLoxA is required for P. aeruginosa supernatant–induced ferroptosis.
(A) HBE cells were treated with supernatants (10 μg each) from WT, ΔwspF, or pLoxA-deficient mutant loxA::Tn (PW3111) with or without ferrostatin-1 (FER, 0.2 μM). Cell death (20 hours) assessed by PI; mean ± SD, *P < 0.05 vs. control (untreated HBE cells), #P < 0.05 vs. corresponding no FER treatment; n = 3. (B) ΔwspF supernatant alone or with z-VAD-fmk (20 μM), necrostatin-1s (Nec-1s, 20 μM), bafilomycin-A1 (Baf-A1, 1 nM). FER, positive control; mean ± SD, *P < 0.05 vs. control (untreated), #P < 0.05 vs. ΔwspF only; n = 3. (CK) Representative fixed biofilms on glass coverslips stained with anti-pLoxA antibodies (green) (D, G, and J) or analyzed by SEM (E, H, and K) (of 3 performed). (L) Dioxygenase activity: WT, ΔwspF, or loxA::Tn supernatants were incubated with DOPC/AA (1:10) or DOPC/SAPE (1:1) liposomes (10 minutes, 37°C). AA oxidation product 15-HpETE (left panel) or 15-HpETE-PE from AA-PE (right panel) assessed by LC-MS; normalized to bacteria (bac.)/ml of supernatant; *P < 0.05 vs. loxA::Tn supernatant; n = 3. (M) Effect of 15LOX-specific inhibitors (PD146176 and ML351; 1.0 μM) on ΔwspF ferroptosis. RSL3 (200 nM, left panel) was a positive control (both inhibitors were effective against host 15LOX); mean ± SD, #P < 0.05 vs. control (untreated), *P < 0.05 vs. RSL3 or ΔwspF supernatant; n = 3. (N) Bacterial cell lysates (pLoxA-deficient or complemented, 100 μg each) were incubated with SAPE (100 μM, 30 minutes) and then added to RSL3-pretreated (20 nM) HBE cells with or without FER (0.2 μM). Mean ± SD,*P < 0.05 vs. RSL3, #P < 0.05 vs. no FER PW3111 Tn7-loxA; n = 3. (O) HBE cells were incubated with supernatant from MJK8 or its loxA-KO strain (MJK8ΔloxA) in the presence or absence of FER (0.2 μM). Mean ± SD, *P < 0.05 vs. control (untreated HBE cells), #P < 0.05 vs. no FER MJK8 supernatant; n = 3. One-way ANOVA for A, B, and LO.
Figure 2
Figure 2. P. aeruginosa supernatants generate pro-ferroptotic hydroperoxy lipid signals in HBE cells.
(A) Detection of lipid hydroperoxides by live cell fluorescence imaging of Liperfluo in HBE cells treated with RSL3 (200 nM) or ΔwspF supernatant for 4 hours. Top panel shows time course of changes in the fluorescence intensity from baseline. Bottom panel shows typical changes in fluorescence (of 4 performed) in one stage position (of 10) at 3 time points (0, 2, and 4 hours). Time control used as a negative control and RSL3 as a positive control for ferroptosis. For statistical analysis, each stage position was counted as one data entry. (B) Typical Liperfluo response (of 4 performed) to ΔwspF showing synchronized spreading of the oxidized lipid signal within cells. The seed point for the signaling is indicated by an arrow in the t = 0 image; the subsequent time course shows that the signals expanded in a clonal way to include multiple surrounding cells. (C) Typical mass spectrum of PE molecular species in lipid extracts from HBE cells (of 3 performed). (D) Volcano plots of ΔwspF biofilm supernatant–induced changes in the levels of oxygenated PEs [log2 (fold change)] versus significance [–log10 (P value)] by t test in HBE cells in the absence (left panel) and presence (right panel) of ferrostatin-1 (0.2 μM). Yellow, red, blue, and black circles represent PE plus 1, 2, 3, and 4 oxygens, respectively. n = 3. (E) Quantitative assessments of 4 PEox species (previously identified as pro-ferroptotic signals) generated in HBE cells exposed to ΔwspF supernatants. *P < 0.05 vs. control, **P < 0.05 vs. ΔwspF (1-way ANOVA); n = 3.
Figure 3
Figure 3. P. aeruginosa–induced ferroptosis is affected by manipulations of PLs in HBE cells.
(A) Exogenous AA enhances P. aeruginosa–induced ferroptosis. HBE cells were treated with WT, ΔwspF, or loxA::Tn supernatant (Sup.) alone or in combination with AA (2.5 μM) for 20 hours at 37°C. Cell death was estimated as mentioned above. Data are presented as mean ± SD, *P < 0.05 vs. control (untreated), #P < 0.05 vs. corresponding supernatant only, P < 0.05 vs. corresponding AA treatment; n = 3. (B) HBE cells were transfected with scrambled siRNA (si-NC) or siRNA against ACSL4 or LPCAT3. Transfected cells were treated with ΔwspF supernatants with or without ferrostatin-1 (0.2 μM) for 20 hours at 37°C before estimating cell death. Data are presented as mean ± SD; *P < 0.05 vs. si-NC ΔwspF; n = 3. (C) Ferrostatin-1 inhibits P. aeruginosa–induced biofilm formation on HBE cells. Polarized HBE cells were incubated with ΔwspF P. aeruginosa (MOI of 25) for 1 hour. After washing unattached bacteria, HBE cells were cultured in the absence or presence of ferrostatin-1 (0.2 and 1.0 μM) for 5 hours. Biofilms were removed and lysed with Triton X-100 (0.1%), and the number of bacteria in each sample was determined by CFU assay. Data are presented as mean ± SD, *P < 0.05 vs. ΔwspF with no FER; n = 3. (D) Treatment of HBE cells with ΔwspF supernatant decreases the content of GPX4. Cells were treated with ΔwspF supernatant and incubated for 20 hours at 37°C. Samples were collected and processed for Western blotting to determine the levels of GPX4. RSL3, a covalent GPX4 inhibitor, was used as a positive control. For quantification, the band intensity of GPX4 protein was normalized to respective band intensity of actin. Inset: typical Western blot (of 3 performed). Data are presented as mean ± SD, *P < 0.05 vs. control (untreated) HBE cells; n = 3. (E) Exogenous 15-HOO-AA-PE elevated WT but not loxA-deficient loxA::Tn supernatant–induced cell death. HBE cells pretreated with RSL3 (20 nM for 4 hours) were incubated with PE-OOH alone or with supernatant from loxA::Tn or WT in the presence or absence of ferrostatin-1 (0.2 μM). Data are presented as mean ± SD, *P < 0.05 vs. control (untreated) HBE cells, #P < 0.05 vs. FER; n = 3. One-way ANOVA.
Figure 4
Figure 4. Evolutionary analysis and computational modeling of pLoxA sequence and structure.
(A) Comparing sequences of LOX homologs. The panels show sequence identity matrices obtained from 218 LOX sequences from all domains of life. High sequence similarity is in red, intermediate in yellow/green, and low in blue. Matrix generated for the entire LOX sequence (left panel) shows blocks evident for plants, animals, and bacteria, indicating their divergence. Light blue shading between these blocks indicates a degree of sequence similarity higher than to the block of other eukaryotes at the bottom (dark blue off-diagonal). High conservation for the catalytic site is shown in the middle panel. Residues involved in substrate recognition (right panel) exhibit a moderate level of conservation and species-specific differentiation, evidenced by the blocks for plants, animals, and bacteria. (B) Conservation propensity of LOX. The ordinate displays the Shannon entropy, subtracted from maximum entropy, plotted as a function of residue index; the peaks represent the most conserved residues. Note that catalytic residues (labeled) are among them. Residues involved in ligand coordination are indicated by the black dots. (C) Structural comparison of pLoxA and mammalian LOXes — 15LOX1 and 15LOX2. The structures resolved for pLoxA (yellow ribbon), 15LOX1 (green), and 15LOX2 (blue) are superimposed and display the missing β-barrel of the bacterial pLoxA and its additional α-helical hairpin motif at the C-terminus. (D) Comparison of the global motions of pLoxA and 15LOX1 complexed with PEBP1. Displacements of residues along the global mode axis obtained from GNM analysis of pLoxA (left, top) and 15LOX1-PEBP1 complex (left, bottom) dividing the structure into 2 domains that exhibit anticorrelated motion (above and below the dashed line). Residues at the crossover region (hinge centers or anchors) are labeled. The anticorrelated groups of residues are shown in red or blue (right, top and bottom).
Figure 5
Figure 5. Redox phospholipidomics reveals pro-ferroptotic oxygenated PE species in airway tissue samples from patients with CF.
(A) Volcano plot of differences in the levels of PEox species in CF vs. non-CF patients — log2(fold difference) vs. significance [–log10 (P value)]. Airway tissues from patients with emphysema were used as controls. Yellow, red, blue, and black circles represent PEox species containing 1, 2, 3, and 4 oxygens, respectively. n = 10 (B) Quantitative assessments of PEox species. Non-CF samples (n = 10), CF samples with P. aeruginosa (PA; n = 6), CF samples with other bacterial pathogens (B. cenocepacia or A. xylosoxidans and M. abscessus, n = 4). (CE) MS/MS-based identification of PEox molecular species in samples from patients with CF. Typical MS/MS spectra of PEox precursors with m/z 738.5 (PE16:0/20:4) (C) and 736.5 (PE16:1/20:4) (D) containing AA (C20:4 at m/z 303.2) at sn-2 positions. MS/MS spectra of PEox with m/z 770.5 (PE16:0/20:4+2O) containing oxygenated AA (C20:4+2O at m/z 335.2) (E) formed from the PE species with m/z 738.5 plus 2 oxygens (of 3 performed). (F) Tobramycin-resistant P. aeruginosa clinical isolates (TRPA002–TRPA122) from patients with persistent lower respiratory infection induce ferroptosis. Biofilm supernatants from P. aeruginosa isolates incubated with HBE cells with or without ferrostatin-1 (0.2 μM). Ferroptosis was calculated by subtracting from cell death induced by supernatants the cell death in the presence of ferrostatin-1. Ferroptotic activity of clinical isolates correlated significantly with pLoxA amounts (determined by Western blotting; n = 29) (G, left panel), displayed strong positive dependence on 15LOX activity (G, middle panel) (P ≤ 0.0036), and correlated negatively with the GSH level of HBE cells after treatment (G, right panel). (H) 3D plot illustrating jointly predicted ferroptotic activity of 15LOX activity and GSH (n = 29). n is number of samples. One-way ANOVA.

Similar articles

Cited by

References

    1. Kagan VE, et al. Oxidized arachidonic and adrenic PEs navigate cells to ferroptosis. Nat Chem Biol. 2017;13(1):81–90. doi: 10.1038/nchembio.2238. - DOI - PMC - PubMed
    1. Yang WS, Kim KJ, Gaschler MM, Patel M, Shchepinov MS, Stockwell BR. Peroxidation of polyunsaturated fatty acids by lipoxygenases drives ferroptosis. Proc Natl Acad Sci U S A. 2016;113(34):E4966–E4975. doi: 10.1073/pnas.1603244113. - DOI - PMC - PubMed
    1. Wenzel SE, et al. PEBP1 Wardens ferroptosis by enabling lipoxygenase generation of lipid death signals. Cell. 2017;171(3):628–641.e26. doi: 10.1016/j.cell.2017.09.044. - DOI - PMC - PubMed
    1. Kuhn H, Walther M, Kuban RJ. Mammalian arachidonate 15-lipoxygenases structure, function, and biological implications. Prostaglandins Other Lipid Mediat. 2002;68-69:263–290. doi: 10.1016/S0090-6980(02)00035-7. - DOI - PubMed
    1. Oliw EH. Plant and fungal lipoxygenases. Prostaglandins Other Lipid Mediat. 2002;68-69:313–323. doi: 10.1016/S0090-6980(02)00037-0. - DOI - PubMed

Publication types

MeSH terms

Substances