. 2018 Sep 10;14(9):e1006458.
doi: 10.1371/journal.pcbi.1006458. eCollection 2018 Sep.

Assessment of mutation probabilities of KRAS G12 missense mutants and their long-timescale dynamics by atomistic molecular simulations and Markov state modeling

Affiliations

Assessment of mutation probabilities of KRAS G12 missense mutants and their long-timescale dynamics by atomistic molecular simulations and Markov state modeling

Tatu Pantsar et al. PLoS Comput Biol. .

Abstract

A mutated KRAS protein is frequently observed in human cancers. Traditionally, the oncogenic properties of KRAS missense mutants at position 12 (G12X) have been considered as equal. Here, by assessing the probabilities of occurrence of all KRAS G12X mutations and KRAS dynamics we show that this assumption does not hold true. Instead, our findings revealed an outstanding mutational bias. We conducted a thorough mutational analysis of KRAS G12X mutations and assessed to what extent the observed mutation frequencies follow a random distribution. Unique tissue-specific frequencies are displayed with specific mutations, especially with G12R, which cannot be explained by random probabilities. To clarify the underlying causes for the nonrandom probabilities, we conducted extensive atomistic molecular dynamics simulations (170 μs) to study the differences of G12X mutations on a molecular level. The simulations revealed an allosteric hydrophobic signaling network in KRAS, and that protein dynamics is altered among the G12X mutants and as such differs from the wild-type and is mutation-specific. The shift in long-timescale conformational dynamics was confirmed with Markov state modeling. A G12X mutation was found to modify KRAS dynamics in an allosteric way, which is especially manifested in the switch regions that are responsible for the effector protein binding. The findings provide a basis to understand better the oncogenic properties of KRAS G12X mutants and the consequences of the observed nonrandom frequencies of specific G12X mutations.


Conflict of interest statement

The authors have declared that no competing interests exist.

Figures

Fig 1
Fig 1. The occurrences of specific KRAS G12X mutations vary among different tissues, and tissues exhibit individual preference in mutation type and position.
The occurrence of specific mutations in (A) all tissues, (B) the pancreas, (C) the large intestine, (D) the lung, (E) the peritoneum, (F) the small intestine, (G) the biliary tract, (H) the endometrium, and (I) the ovary. Numbers shown in panels B-I indicate the numbers of observed positive tumor samples. In panels B-I, the data are ordered from the highest occurrence (%) of a G12X mutation (panel B) to the lowest (panel I). Data have been collected from the COSMIC database [2] v.79 (http://cancer.sanger.ac.uk/cosmic/). (J) KRAS G12X single point mutations occur if c.34 or c.35 is mutated. (K) Mutation types observed in all tissues, the pancreas, the large intestine, and the lung. (L) Fraction of position c.35G mutations compared to all the mutations averaged over all tissues, and found in individual tissues. (M) Positional mutation preference of specific mutation types in c.34 and c.35. (N-P) Position mutation preference characterized through c.35G over c.34G in specific tissues with (N) G>A, (O) G>C, and (P) G>T mutations. Tissues with less than 50 positive samples (the peritoneum, the small intestine) have been omitted from the panels O and P. Statistically significant differences in the panels K-M compared to other tissues or position are indicated with an asterisk, * P<0.001; † = non-significant (Fischer exact test).
Fig 2
Fig 2. GDP- and GTP-bound systems exhibit distinctly different dynamics.
The extreme movements of the principal components PC1 and PC2 in all (A, B) GDP systems and (C, D) GTP systems. Color coding: residue 12 (orange), switch-I (residues 30–40, red), and switch-II (residues 58–72, blue).
Fig 3
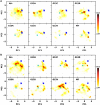
Fig 3. Dynamics of the mutants characterized by their principal components display individual profiles.
PCA (backbone) score plots (heat map) of (A) GDP-bound and (B) and GTP-bound systems. Top-left boxes comprise all the systems with (A) GDP or (B) GTP. For conformational reference, the backbone conformation of RAS from the RAS–effector and RAS–GEF complexes is included in the plots, where switch-I and switch-II are in a totally closed conformation (blue crosses; from RAS–effector protein complexes) or switch-I is in a fully open conformation (cyan crosses; from a RAS–GEF complex). Reference RAS structures were obtained from HRAS–effector protein complexes (PDB IDs: 1HE8, 1LFD, 4G0N) and from the HRAS–Sos complex (PDB ID: 4NYJ).
Fig 4
Fig 4. The hydrophobic interaction network of KRAS.
The interaction network is represented for the GTP-bound wild-type KRAS (A), where hydrophobic hubs are displayed as large teal spheres (except for M72 depicted as blue). The hubs are defined by the criteria that each hub displays at least three hydrophobic contacts (>10%). The hydrophobic interactions (>10%) are depicted with cylinders, where the frequency of interaction is depicted in a scale from blue and thin to red and thick for low and high frequencies, respectively. The hydrophobic residues connected to the network that can influence the switch-I and switch-II dynamics are shown in small red and blue spheres, respectively. Moreover, the hub M72 is directly part of switch-II (large blue sphere). The salt-bridge forming residues D154 and R161 are displayed as green sticks. In the 2D representation of the hydrophobic hub network (B), the hydrophobic interactions (>10%) are shown with lines, and in addition to the hubs (spheres) all the hydrophobic interacting residues to the hub network are shown (in GTP-bound wild-type). The P-loop is indicated with a dashed line.
Fig 5
Fig 5. The seven metastable states identified by the Markov state model.
In the middle is the time-lagged independent component analysis (TICA) plot showing seven clusters, each of which corresponds to one metastable state (I–VII). The metastable states are classified by borderlines, and the “microstates” (dots) in each metastable state are colored with the same color. The seven boxes around the middle describe the seven metastable states found in the MSM analysis, each box illustrating three representative protein conformations (generated using MSM), which identify the residue 12 (orange), and also the switch-I (red) and switch-II (blue) regions depicted by their backbone’s molecular surface (dots). In each metastable state, the occupation percentage by wild-type and individual mutants is displayed next to the conformations. For each case (wild-type, G12D, G12V, G12R), normalization of the percentages is done such that the sum over the seven metastable states adds up to 100%.

References

    1. Vetter IR, Wittinghofer A. The guanine nucleotide-binding switch in three dimensions. Science 2001;294: 1299–1304 10.1126/science.1062023 - DOI - PubMed
    1. Forbes SA, Beare D, Boutselakis H, Bamford S, Bindal N, Tate J, et al. COSMIC: somatic cancer genetics at high-resolution. Nucleic Acids Res 2017;45: D777–D783 10.1093/nar/gkw1121 - DOI - PMC - PubMed
    1. Gibbs JB, Sigal IS, Poe M, Scolnick EM. Intrinsic GTPase activity distinguishes normal and oncogenic RAS p21 molecules. Proc. Natl. Acad. Sci. USA 1984;81: 5704–5708 - PMC - PubMed
    1. Trahey M, McCormick F. A cytoplasmic protein stimulates normal N-RAS p21 GTPase, but does not affect oncogenic mutants. Science 1987; 238:542–545 - PubMed
    1. Lito P, Solomon M, Li L, Hansen R, Rosen N. Allele-specific inhibitors inactivate mutant KRAS G12C by a trapping mechanism. Science 2016;351: 604–608 10.1126/science.aad6204 - DOI - PMC - PubMed

Publication types