. 2018 Sep 10;16(9):e2006519.
doi: 10.1371/journal.pbio.2006519. eCollection 2018 Sep.

Copper-dependent amino oxidase 3 governs selection of metabolic fuels in adipocytes

Affiliations

Copper-dependent amino oxidase 3 governs selection of metabolic fuels in adipocytes

Haojun Yang et al. PLoS Biol. .

Abstract

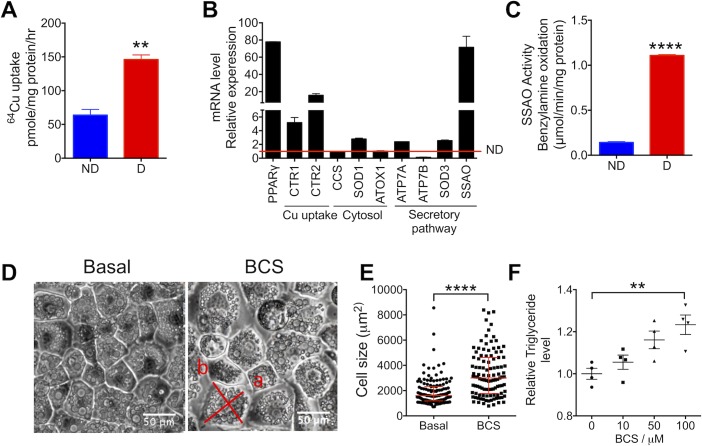
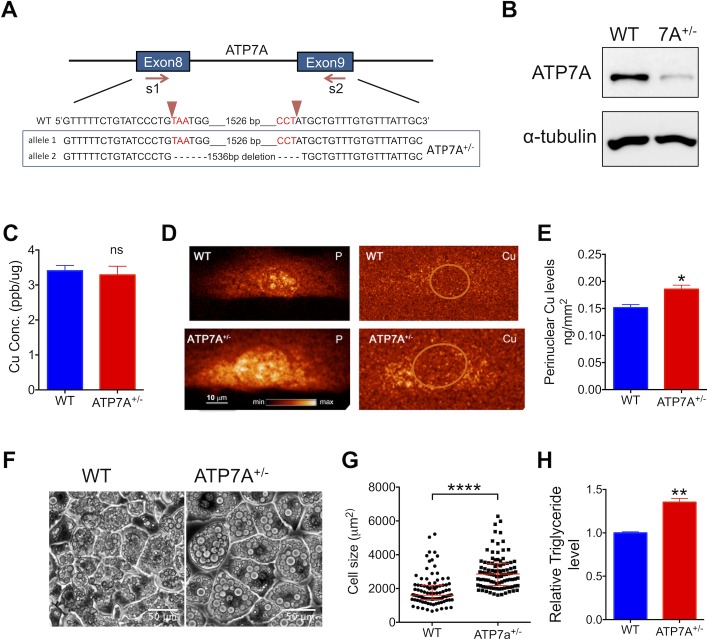
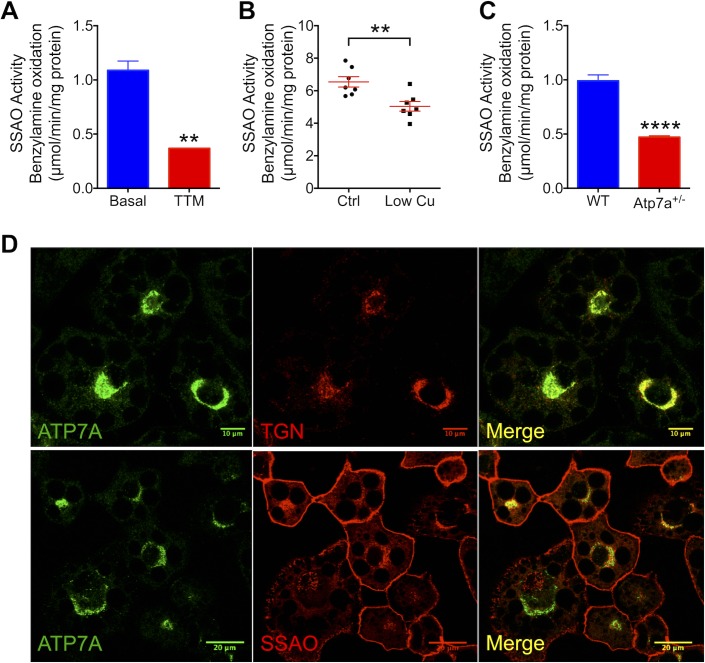
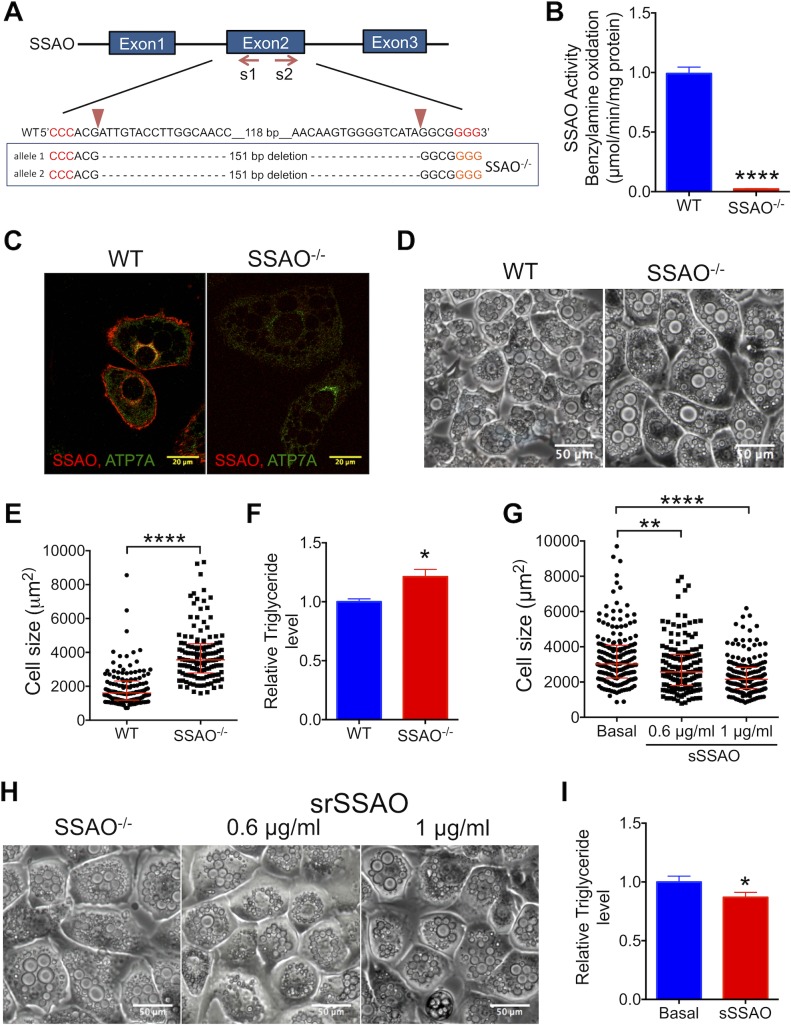
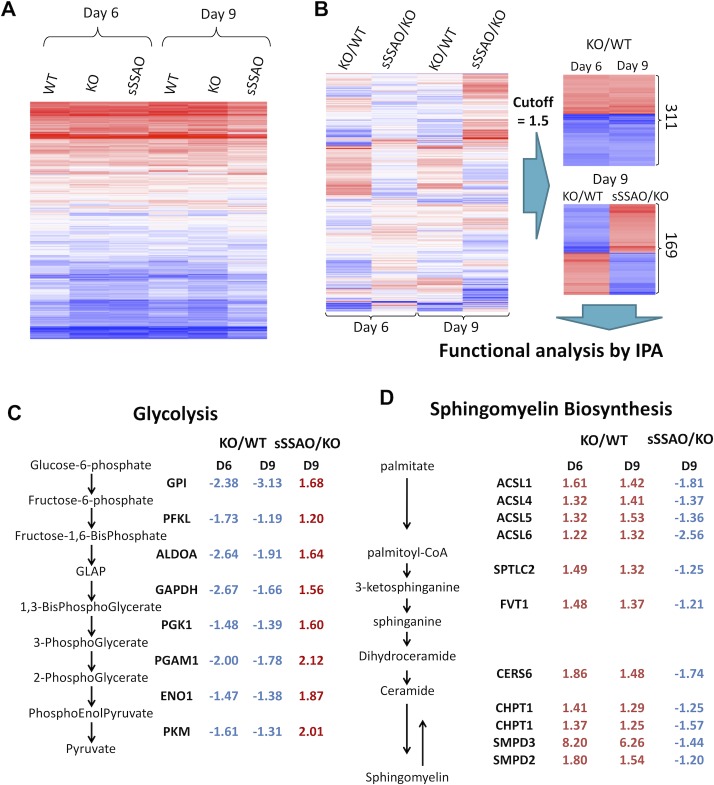
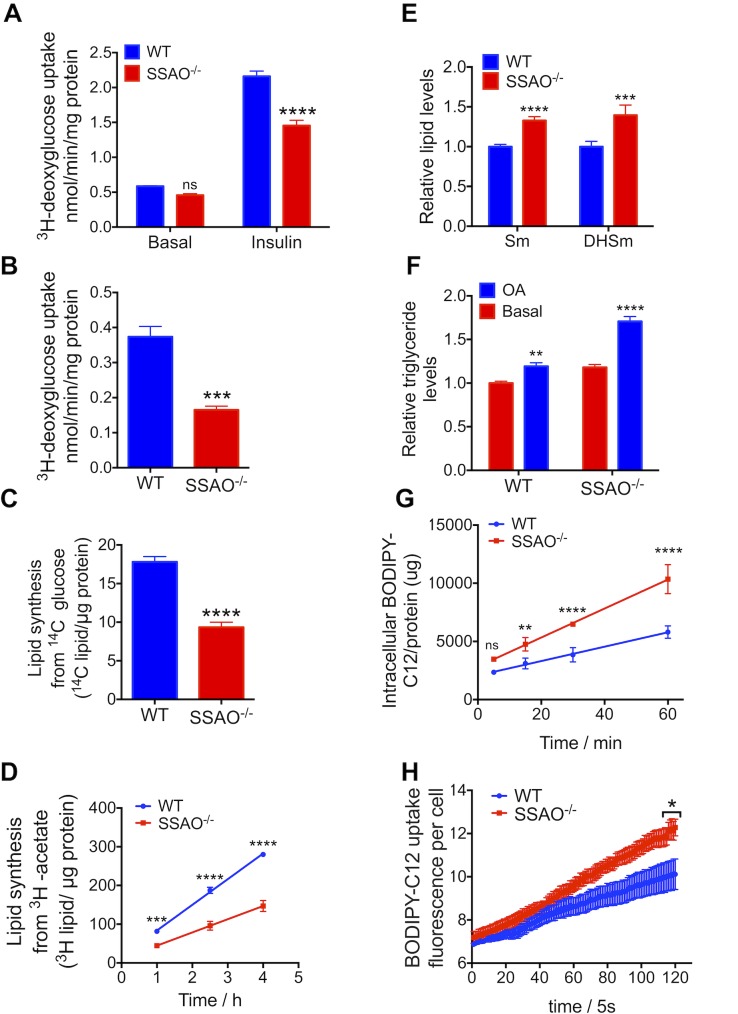
Copper (Cu) has emerged as an important modifier of body lipid metabolism. However, how Cu contributes to the physiology of fat cells remains largely unknown. We found that adipocytes require Cu to establish a balance between main metabolic fuels. Differentiating adipocytes increase their Cu uptake along with the ATP7A-dependent transport of Cu into the secretory pathway to activate a highly up-regulated amino-oxidase copper-containing 3 (AOC3)/semicarbazide-sensitive amine oxidase (SSAO); in vivo, the activity of SSAO depends on the organism's Cu status. Activated SSAO oppositely regulates uptake of glucose and long-chain fatty acids and remodels the cellular proteome to coordinate changes in fuel availability and related downstream processes, such as glycolysis, de novo lipogenesis, and sphingomyelin/ceramide synthesis. The loss of SSAO-dependent regulation due to Cu deficiency, limited Cu transport to the secretory pathway, or SSAO inactivation shifts metabolism towards lipid-dependent pathways and results in adipocyte hypertrophy and fat accumulation. The results establish a role for Cu homeostasis in adipocyte metabolism and identify SSAO as a regulator of energy utilization processes in adipocytes.


Conflict of interest statement

The authors have declared that no competing interests exist.

Figures

Fig 1
Fig 1. Cu uptake and utilization are increased in differentiated 3T3-L1 adipocytes and contribute to cells morphology and function.
(A) Analysis of radioactive 64Cu uptake by nondifferentiated (“ND”) and differentiated (“D”) 3T3-L1 cells shows an increased uptake upon adipocyte differentiation (n = 3). (B) Changes in the mRNA levels of major Cu-binding proteins as an indirect measure of Cu utilization upon adipocyte differentiation; the red line indicates the mRNA levels in undifferentiated cells (n = 3). (C) SSAO activity in differentiated (“D”) cells compared to nondifferentiated (“ND”) 3T3-L1 cells (n = 3). (D) Bright-field images of 3T3-L1 cells differentiated in the absence or presence of 50-μM BCS illustrate an increase in cell size upon Cu depletion; “a”—the major cell axe, i.e., “length,” and “b” is the minor cell axe, i.e., “width.” (E) Size distribution of cells differentiated under basal conditions (n = 110) and in the presence of 100-μM BCS (n = 139). (F) The triglyceride levels in cells treated with BCS (0–100 μM) during differentiation (n = 4) compared to basal conditions; triglyceride levels were normalized to protein concentration, and then these values were compared to the triglyceride values at basal conditions; the ratio is plotted. Underlying data can be found in S1 Data; Student’s t test, ****p < 0.0001, ***p < 0.001, **p < 0.01, *p < 0.05, ns p > 0.05. The data are presented as mean ± SEM and median ± IQR for cell distribution. Atox1, antioxidant 1 copper chaperone; BCS, bathocuproine disulfonate; CTR1, Cu transporter 1; CTR2, Cu transporter 2; CCS, copper chaperone for superoxide dismutase; Cu, copper; ns, not significant; PPARγ, peroxisome proliferator–activated receptor gamma; SOD1, superoxide dismutase 1; SOD3, superoxide dismutase 3; SSAO, semicarbazide-sensitive amine oxidase.
Fig 2
Fig 2. 3T3-L1-ATP7A+/− adipocytes are enlarged and have increased triglyceride levels.
(A) Schematic of the Cas9/sgRNA targeting of ATP7A. The sgRNA-targeting sequence is shown; the PAM sequence is labeled in red. The results of sequencing of ATP7A genomic regions are shown below the WT sequence. (B) Protein levels of ATP7A in undifferentiated WT and ATP7A+/−; α-tubulin is a loading control. (C) The total Cu levels in undifferentiated WT and ATP7A+/− and ATP7A−/− cells measured using atomic absorption spectroscopy (n = 3). (D) The XFM images of phosphate (“P”), used as a control, and Cu in undifferentiated WT and ATP7A+/− cells show differences in the intracellular distribution of Cu (n = 3); nuclei are indicated by orange circles. (E) The quantitative analysis of fluorescence intensity in the perinuclear region containing bright Cu puncta in WT and ATP7A+/− cells (n = 8, 3 respectively). (F) The bright-field images of differentiated WT and ATP7A+/− cells at day 9 illustrate enlargement of cells with down-regulated ATP7A. (G) Distribution of cell sizes and (H) triglyceride levels for WT (n = 98; n = 3) and ATP7A+/− adipocytes (n = 101; n = 3); triglyceride levels were normalized to the protein levels, and these values were compared to WT cells’ values taken as 1; the ratio is plotted. Underlying data can be found in S1 Data; Student’s t test, ****p < 0.0001, ***p < 0.001, **p < 0.01, *p < 0.05, ns p > 0.05. The data are presented as mean ± SEM, and median ± IQR for cell distribution. Cas9, CRISPR-associated 9; Cu, copper; ns, not significant; PAM, protospacer-adjacent motif; sgRNA, single guide RNA; WT, wild type; XFM, X-ray fluorescence microscopy.
Fig 3
Fig 3. ATP7A-mediated transport of Cu into the secretory pathway is essential for SSAO activity.
(A) Cu limitation with 10 μM TTM for 48 h decreases the SSAO activity (n = 3). (B) SSAO activity in the epididymal adipose tissue from 13-wk-old male rats fed with Cu-adequate or low-Cu diet for 8 wk (n = 7). (C) Down-regulation of ATP7A in ATP7A+/− adipocytes causes a decrease in SSAO activity (n = 4). (D) Immunocytochemistry shows that SSAO transits the ATP7A-containing compartment on its way to the plasma membrane. Top: ATP7A (green) is localized to the TGN, as evidenced by its colocalization with the TGN marker Syn6 (red); Bottom: SSAO (red) is present at the plasma membrane and inside the cells, where it colocalizes with ATP7A (green). Underlying data can be found in S1 Data; Student’s t test, ****p < 0.0001, ***p < 0.001, **p < 0.01, *p < 0.05, ns p > 0.05. Cu, copper; ns, not significant; SSAO, semicarbazide-sensitive amine oxidase; Syn6, syntaxin 6; TGN, trans-Golgi network; TTM, tetrathiomolybdate; WT, wild type.
Fig 4
Fig 4. Inactivation of SSAO induces adipocyte hypertrophy.
(A) The Cas9/sgRNA-targeting sites in the SSAO gene. The sgRNA-targeting sequence is shown, and the PAM sequence is labeled in red. The results of sequencing of both AOC3 alleles in SSAO−/− cells are shown under the WT sequence. (B) The SSAO activity in WT and SSAO−/− adipocytes (n = 4). (C) Immunostaining of SSAO (red) and ATP7A (green) in the WT and SSAO−/− adipocytes. (D) Bright-field images of differentiated WT and SSAO−/− cells at day 9. (E) The size distribution and (F) triglyceride levels for the WT (n = 133; n = 3) and SSAO−/− (n = 139; n = 3) adipocytes (triglyceride levels were normalized to protein levels, and the values for SSAO−/− cells were compared to the WT control; the ratio is plotted). (G) The size distribution and (I) triglyceride levels for SSAO−/− cells in the basal medium (n = 178), after treatment with the 0.6 μg/ml sSSAO (n = 150; n = 3), or 1 μg/ml sSSAO (n = 184; n = 3); triglyceride levels were normalized to protein levels, and the values for sSSAO-treated cells were compared to values at basal conditions; the ratio is plotted. (H) Effect of sSSAO on the size of SSAO−/− cells at day 9 of differentiation. Underlying data can be found in S1 Data; Student’s t test, ****p < 0.0001, ***p < 0.001, **p < 0.01, *p < 0.05, ns p > 0.05. The data are presented as mean ± SEM, and median ± IQR for cell distribution. Cas9, CRISPR-associated 9; ns, not significant; PAM, protospacer-adjacent motif; sgRNA, single guide RNA; SSAO, semicarbazide-sensitive amine oxidase; sSSAO, recombinant soluble SSAO; WT, wild type.
Fig 5
Fig 5. Comparative proteomics reveals a regulatory role for SSAO in energy homeostasis.
(A) A heat map of protein abundance in each sample relative to day 0. The log ratios for all 6,098 proteins (protein levels relative to day 0) are color coded, with the blue color indicating negative values and the red color indicating positive values. (B) Left: a heat map comparing abundance of all identified proteins in SSAO−/− cells to those in WT cells (KO/WT) and proteins in SSAO−/− cells without and with treatment with the sSSAO (sSSAO/KO) at day 6 and day 9. At both day 6 and day 9, the changes caused by SSAO inactivation (KO/WT) are reversed by addition of sSSAO (sSSAO/KO); the effect is more complete at day 9. Right: (top panel) the heat map for 311 proteins that show similar changes in their abundance in SSAO−/− cells when compared to WT (KO/WT) at both day 6 and day 9 and (bottom panel) the heat map of 169 proteins deregulated in SSAO−/− cells and reversely changed by treatment with sSSAO (sSSAO/KO); data shown for day 9; 1.5-fold cutoff. (C) The fold change in the levels of proteins within the glycolysis pathway and (D) the sphingomyelin synthesis pathway. The ratios are shown for the SSAO−/− cells versus WT cells (KO/WT) at day 6 (“D6”) and day 9 (“D9”) and for SSAO−/− cells treated with the sSSAO compared to nontreated cells (sSSAO/KO) at day 9. (Red indicates up-regulation, and blue indicates down-regulation.). ACSL1, acyl-coenzyme A synthetase long-chain family member 1; ACSL4, acyl-coenzyme A synthetase long-chain family member 4; ACSL5, acyl-coenzyme A synthetase long-chain family member 5; ACSL6, acyl-coenzyme A synthetase long-chain family member 6; CERS6, ceramide synthase 6; CHPT1, choline phosphotransferase 1; ENO1, enolase 1; FVT1, follicular variant translocation protein 1; GAPDH, glyceraldehyde 3-phosphate dehydrogenase; GLAP, glyceraldehyde 3-phosphate; GPI, glucose-6-phosphate isomerase; KO, knockout; PFKL, phosphofructokinase, liver type; PGAM1, phosphoglycerate mutase 1; PGK1, phosphoglycerate kinase 1; PKM, pyruvate kinase; SMPD2, sphingomyelin phosphodiesterase 2; SMPD3, sphingomyelin phosphodiesterase 3; SPTLC2, serine palmitoyltransferase long chain base subunit 2; SSAO, semicarbazide-sensitive amine oxidase; sSSAO, recombinant soluble SSAO; WT, wild type.
Fig 6
Fig 6. Glucose and fatty acid uptake as well as glucose processing are altered in SSAO−/− cells.
(A) The 3H-deoxyglucose uptake by WT and SSAO−/− adipocytes with or without 100 nmol/L insulin (n = 4) after 2-h fasting in a serum-free low-glucose medium. (B) The 3H-deoxyglucose uptake by WT and SSAO−/− adipocytes incubated in a regular growth medium without fasting (n = 4). (C) Lipogenesis from 14C-glucose in the WT and SSAO−/− adipocytes, overnight incubation (n = 6). (D) De novo lipogenesis from 3H-acetate in WT and SSAO−/− adipocytes after 1-h, 2.5-h, and 4-h incubation (n = 3). (E) The levels of sphingomyelin (“Sm”) and dihydrosphingomyelin (“DHSm”) in differentiated SSAO−/− adipocytes relative to WT cells. (F) The triglyceride levels in the WT and SSAO−/− cells treated without and with 2 mM oleic acid from day 3 to day 9 of differentiation relative to those levels in WT cells without treatment (n = 6). (G) BODIPY-C12 uptake in WT and SSAO−/− adipocytes after 5-, 15-, 30-, and 60-min incubation (n = 4). Fluorescence intensity in cell lysate is normalized to protein levels. (H) Single-cell BODIPY-C12 uptake in WT (n = 4) and SSAO−/− (n = 3) adipocytes in 10 min; triglyceride levels were normalized to protein levels, and these values were compared to values at basal conditions; the ratio is plotted. Underlying data can be found in S1 Data; Student’s t test for panel (B) and (C), 2-way ANOVA for other panels, ****p < 0.0001, ***p < 0.001, **p < 0.01, *p < 0.05, ns p > 0.05. The data are presented as mean ± SEM. ns, not significant; SSAO, semicarbazide-sensitive amine oxidase; WT, wild type.

References

    1. Kaler SG. Diagnosis and therapy of Menkes syndrome, a genetic form of copper deficiency. Am J Clin Nutr. 1998;67(5 Suppl):1029S–34S. 10.1093/ajcn/67.5.1029S - DOI - PubMed
    1. Harada M. Wilson disease. Med Electron Microsc. 2002;35(2):61–6. 10.1007/s007950200007 - DOI - PubMed
    1. Kodama H, Murata Y, Kobayashi M. Clinical manifestations and treatment of Menkes disease and its variants. Pediatr Int. 1999;41(4):423–9. - PubMed
    1. Huster D, Purnat TD, Burkhead JL, Ralle M, Fiehn O, Stuckert F, et al. High copper selectively alters lipid metabolism and cell cycle machinery in the mouse model of Wilson disease. J Biol Chem. 2007;282(11):8343–55. 10.1074/jbc.M607496200 - DOI - PubMed
    1. Huster D, Lutsenko S. Wilson disease: not just a copper disorder. Analysis of a Wilson disease model demonstrates the link between copper and lipid metabolism. Mol Biosyst. 2007;3(12):816–24. 10.1039/b711118p - DOI - PubMed

Publication types

MeSH terms