. 2018 Aug 31;23(9):2212.
doi: 10.3390/molecules23092212.

Tracing the Thermal History of Seafood Products through Lysophospholipid Analysis by Hydrophilic Interaction Liquid Chromatography⁻Electrospray Ionization Fourier Transform Mass Spectrometry

Affiliations

Tracing the Thermal History of Seafood Products through Lysophospholipid Analysis by Hydrophilic Interaction Liquid Chromatography⁻Electrospray Ionization Fourier Transform Mass Spectrometry

Ilario Losito et al. Molecules. .

Abstract

Low temperature treatments commonly applied to seafood products have been shown to influence their phospholipid (PL) profile through enzymatic hydrolysis. In the present study, the generation of lysophospholipids (LPL) resulting from this process was systematically investigated for selected, commercially relevant seafood products, namely oysters, clams, octopuses, and shrimps. These products were subjected to thermal treatments like refrigeration or freezing after being purchased as fresh, defrozen, or frozen products depending on the case. The coupling between hydrophilic interaction liquid chromatography (HILIC) and electrospray ionization with high resolution/accuracy Fourier transform mass spectrometry (ESI-FTMS) was exploited to evaluate the PL profile of the cited products, especially the incidence of LPL related to the two main PL classes of seafood products-phosphatidylcholines (PC) and phosphatidylethanolamines (PE)-in the lipid extracts. The lyso forms of PE (LPE) were found to be generally more sensitive than those of PC (LPC) to thermal treatments, usually exhibiting a significant increase upon prolonged refrigeration at 4 °C in all types of investigated products except European flat oysters. Moreover, the distinction between fresh and frozen or defrozen products could be achieved in the case of octopuses and shrimps, respectively.

Keywords: high resolution mass spectrometry; hydrophilic interaction liquid chromatography; lysophospholipids; seafood products; thermal treatments.


Conflict of interest statement

The authors declare no conflict of interest. The funders had no role in the design of the study, in the collection, analyses or interpretation of data, in the writing of the manuscript, and in the decision to publish the results.

Figures
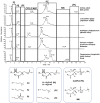
Figure 1
Figure 1
Comparison between hydrophilic interaction liquid chromatography–electrospray ionization(+)-Fourier transform mass spectrometry (HILIC–ESI(+)-FTMS) total ion current (TIC) chromatograms obtained for the lipid extracts of different seafood products, which were all purchased as fresh products and analyzed without further thermal treatments. The general structures of positive ions related to species belonging to the detected phospholipid (PL) classes are reported, with R1 and R2 representing saturated or unsaturated alkyl chains.
Figure 2
Figure 2
Averaged ESI(+)-FTMS spectra related to phosphatidylcholines (PC) and lysophosphatidylcholines (LPC) classes obtained, respectively, from the HILIC–ESI(+)-FTMS analysis of lipid extracts of Manila clams (R. philippinarum) and Japanese oysters (C. gigas). Spectral averaging was performed in the following retention time intervals: 7.3–11.6 min for PC and 14.6–16.7 min for LPC (see Figure 1). The molecular structures of plasmanyl-PC (o-PC) and plasmenyl-PC (p-PC) are also reported.
Figure 3
Figure 3
Comparison between lysophosphatidylethanolamines/phosphatidylethanolamines (LPE/PE) and LPC/PC ratios of ESI(+)-FTMS responses obtained from the HILIC–ESI(+)-FTMS analysis of lipid extracts of Japanese oysters (C. gigas) and Manila clams (R. philippinarum) that were subjected to lipid extraction soon after purchase (as fresh product) or after refrigeration at 4 °C for four or seven days in a laboratory refrigerator. Lighter bars in the graphs related to C. gigas represent data obtained for two lots of fresh oysters purchased in July, displaying anomalously high LPE/PE ratios (see text for an explanation for this finding). Mean values and standard deviations (indicated as error bars) reported relate to the number of replicates indicated for each type of sample. The results of a Tukey–Kramer test are reported in the form of sample type grouping, emphasized by letters. See text for details on the calculation of the LPE/PE and LPC/PC ratios from HILIC–ESI(+)-FTMS XIC chromatograms.
Figure 4
Figure 4
Comparison between LPE/PE and LPC/PC ratios of ESI(+)-FTMS responses obtained from the HILIC–ESI(+)-FTMS analysis of lipid extracts of common octopuses (O. vulgaris) that were subjected to lipid extraction soon after purchase or capture (fresh), as defrozen (either in lab or commercially), frozen or defrozen/refrigerated product. Mean values and standard deviations (error bars) that are plotted relate to the number of replicates indicated for each type of sample. The results of a Tukey–Kramer test are reported in the form of sample-type grouping and emphasized by letters. See text for details on the calculation of the LPE/PE and LPC/PC ratios from XIC chromatograms and on the different thermal treatments.
Figure 5
Figure 5
Comparison between LPE/PE and LPC/PC ratios of ESI(+)-FTMS responses obtained from the HILIC–ESI(+)-FTMS analysis of lipid extracts of (i) Mediterranean pink shrimps (P. longirostris) subjected to lipid extraction and analyzed as fresh or defrozen product or as defrozen product subjected to six days refrigeration at 4 °C; (ii) brown/speckled shrimps (M. monoceros) purchased as frozen product and thawed before lipid extraction and analysis. Mean values and standard deviations (indicated as error bars) reported relate to the number of replicates indicated for each type of sample. The results of a Tukey–Kramer test are reported in the form of sample type grouping, emphasized by letters. See text for details on the calculation of the LPE/PE and LPC/PC ratios from XIC chromatograms and on the different thermal treatments.

References

    1. Ackman R.G. Nutritional composition of fats in seafoods. Prog. Food Nutr. Sci. 1989;13:161–289. - PubMed
    1. Daviglus M., Sheeshka J., Murkin E. Health benefits from eating fish. Comments Toxicol. 2002;8:345–374. doi: 10.1080/08865140215064. - DOI
    1. Grazyna Daczkowska-Kozon E., Pan B.S. Environmental Effects on Seafood Availability, Safety and Quality. 2nd ed. CRC Press; Boca Raton, FL, USA: 2011.
    1. Lund E.K. Health benefits of seafood. Is it just the fatty acids? Food Chem. 2013;140:413–420. doi: 10.1016/j.foodchem.2013.01.034. - DOI - PubMed
    1. Food and Agriculture Organization of the United Nations (FAO) The State of World Fisheries and Aquaculture. [(accessed on 5 June 2018)];2016 Available online: http://www.fao.org/3/a-i5555e.pdf.

MeSH terms

LinkOut - more resources