Review
. 2018 Aug 31;9(9):437.
doi: 10.3390/genes9090437.

Network-Based Approaches to Explore Complex Biological Systems towards Network Medicine

Affiliations
Review

Network-Based Approaches to Explore Complex Biological Systems towards Network Medicine

Giulia Fiscon et al. Genes (Basel). .

Abstract

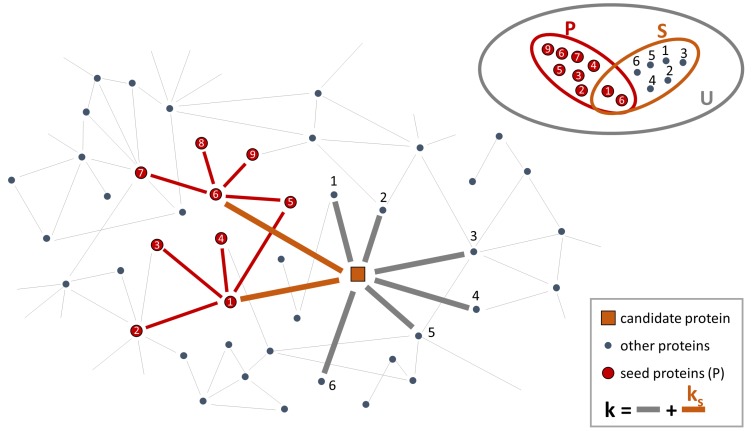
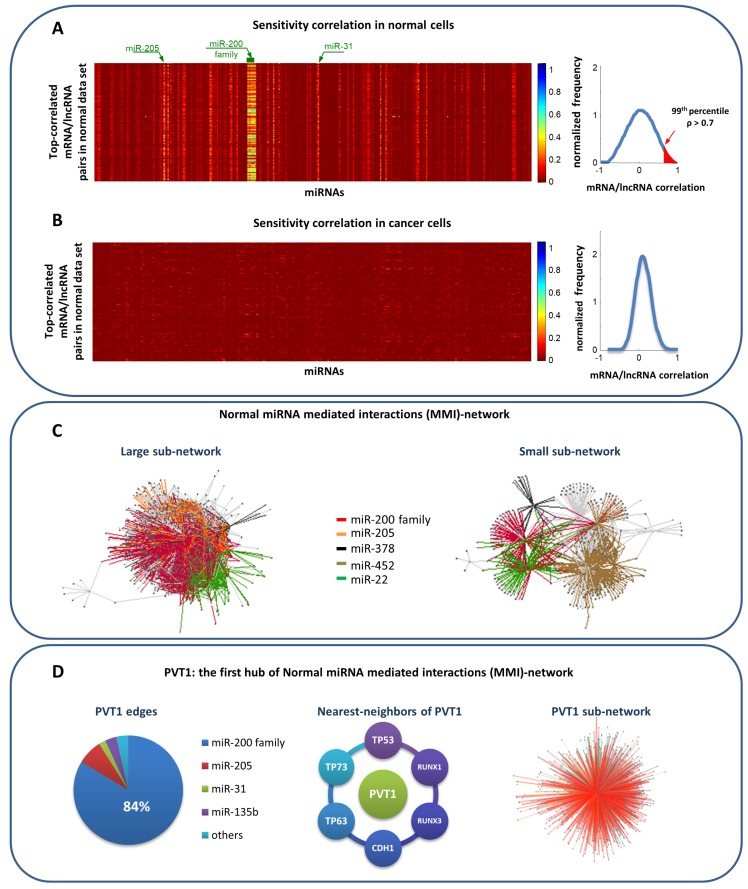
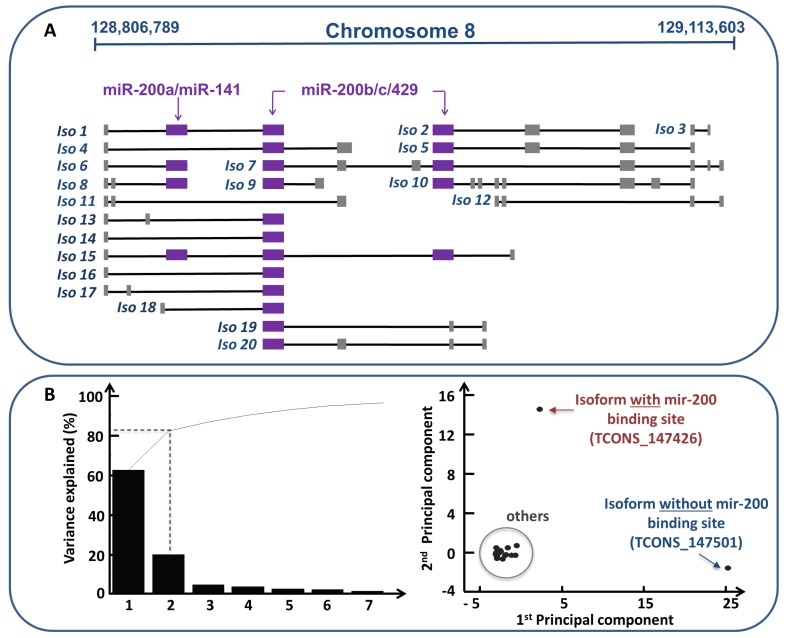
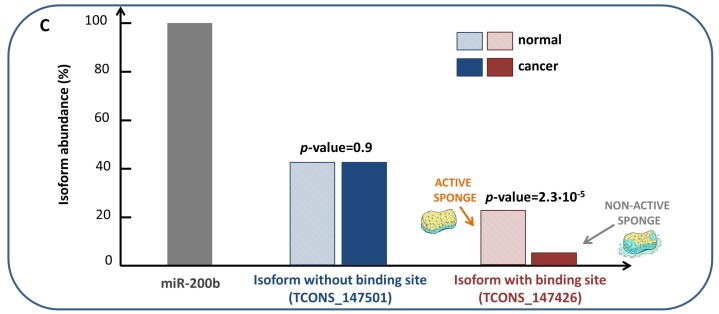
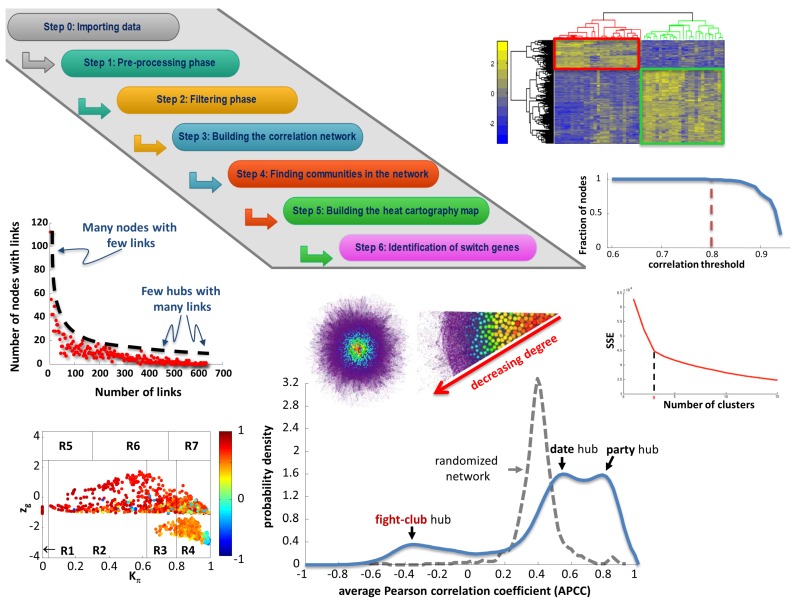
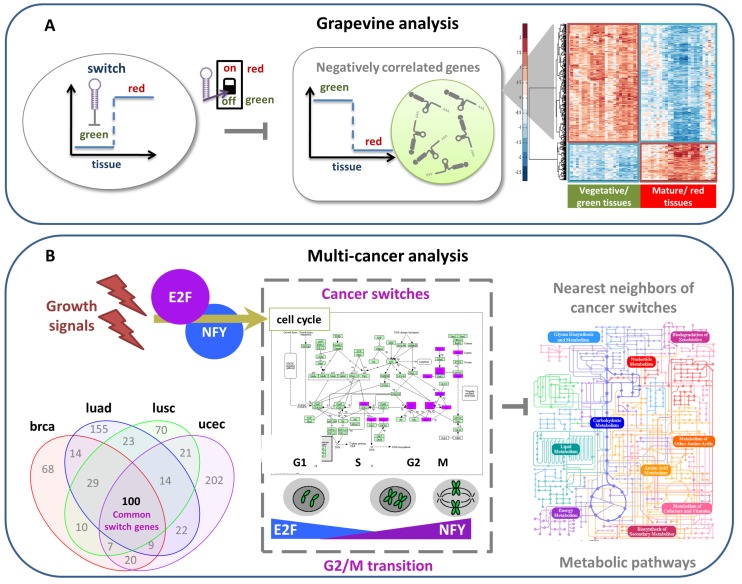
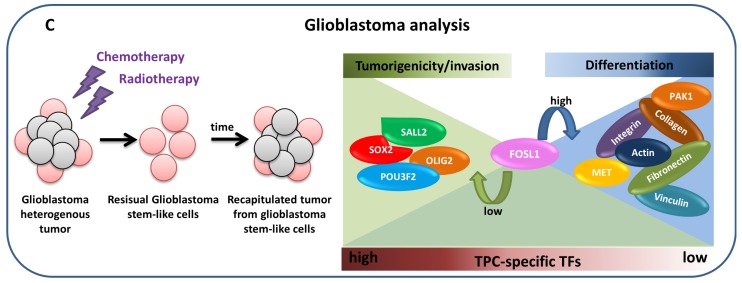
Network medicine relies on different types of networks: from the molecular level of protein⁻protein interactions to gene regulatory network and correlation studies of gene expression. Among network approaches based on the analysis of the topological properties of protein⁻protein interaction (PPI) networks, we discuss the widespread DIAMOnD (disease module detection) algorithm. Starting from the assumption that PPI networks can be viewed as maps where diseases can be identified with localized perturbation within a specific neighborhood (i.e., disease modules), DIAMOnD performs a systematic analysis of the human PPI network to uncover new disease-associated genes by exploiting the connectivity significance instead of connection density. The past few years have witnessed the increasing interest in understanding the molecular mechanism of post-transcriptional regulation with a special emphasis on non-coding RNAs since they are emerging as key regulators of many cellular processes in both physiological and pathological states. Recent findings show that coding genes are not the only targets that microRNAs interact with. In fact, there is a pool of different RNAs-including long non-coding RNAs (lncRNAs) -competing with each other to attract microRNAs for interactions, thus acting as competing endogenous RNAs (ceRNAs). The framework of regulatory networks provides a powerful tool to gather new insights into ceRNA regulatory mechanisms. Here, we describe a data-driven model recently developed to explore the lncRNA-associated ceRNA activity in breast invasive carcinoma. On the other hand, a very promising example of the co-expression network is the one implemented by the software SWIM (switch miner), which combines topological properties of correlation networks with gene expression data in order to identify a small pool of genes-called switch genes-critically associated with drastic changes in cell phenotype. Here, we describe SWIM tool along with its applications to cancer research and compare its predictions with DIAMOnD disease genes.

Keywords: PPI network; bioinformatics; ceRNA; gene co-expression network; network medicine; regulatory network.


Conflict of interest statement

The authors declare no conflict of interest.

Figures

Figure 1
Figure 1
Number of 2012–2018 publications related to network-based approaches to medicine. The figure shows the number of articles published by year obtained by searching the following specific keywords in Pubmed: network-based approach, network medicine, biological network.
Figure 2
Figure 2
Sketch of step 1 of DIAMOnD. The network corresponds to the interactome where the red balls are the seed proteins, the orange square is the protein to test with k connections (orange and grey thick links) including ks links to seed proteins (orange thick links), the grey balls refer to other proteins in the PPI-network. The sets at top-right correspond to: U is the ensemble of the total number of nodes in the PPI-network, S is the ensemble of the draw of k proteins, including ks seed proteins (ks=2 in this example), P is the ensemble of the seed proteins.
Figure 3
Figure 3
Results of Paci et al. model to predict miRNA sponge interactions in breast invasive carcinoma [25]. (A) Heatmap showing the sensitivity correlation for the top-correlated mRNA/lncRNA pairs (e.g., pairs for which the Pearson correlation between their expression profiles exceeds the 99th percentile of the overall correlation distribution) in normal breast tissues. Red color corresponds to zero sensitivity correlation, meaning that the interaction between the selected RNA pairs is direct and not mediated by miRNAs. Light vertical stripes point to miRNAs that are mediating the interaction, suggesting putative competing endogenous RNAs. (B) The same as in panel (A) but using data from breast cancer tissues. (C) The normal MMI-network (1738 nodes and 32,375 edges) built starting from the expression data of normal breast tissues. Nodes represent both mRNAs and lncRNAs; edges represent miRNAs that are mediating their interactions. Each pair of linked nodes fulfills two requirements: (i) sensitivity correlation > 0.3 and (ii) one or more shared MREs, for each miRNA linking them. Colors correspond to different miRNAs. (D) PVT1 subnetwork analysis. From left to right: the percentage of the miRNAs sponged by PVT1 with respect to all of its; some nearest neighbors of PVT1 that are well-known cancer genes; the sponge interactions sub-network of PVT1 (753 nodes and 2169 edges).
Figure 4
Figure 4
Analysis of PVT1 isoforms [27]. (A) Sketch of PVT1 genomic locus as reconstructed by Cufflinks spans across a genome interval of over 300 kb (i.e., 128,806,789-129,113,603 bases within the February 2009 human genome build GRCh37/hg19) on the forward strand of chromosome 8. PVT1 locus gives rise to 91 different variants according to raw RNA-seq data of TCGA (The Cancer Genome Atlas) for breast invasive carcinoma. The isoform names correspond to an increasing symbolic numbering and not to the actual nomenclature of the PVT1 variants. Lines represent introns and boxes (violet and grey) represent exons. Violet boxes correspond to the binding sites for the miR-200 family members. Note that some isoforms lack such binding sites (e.g., Iso11 and Iso12). (B) (Left) The percent variability explained by each principal component (PC) shown by the Pareto chart. This chart contains both bars and a line graph, where individual values are represented in descending order by bars, and the line represents the cumulative total value. The y-axis represents the percentage of the data variance explained by each PC, whereas the x-axis represents the principal components that are able to explain the first 100% of the cumulative distribution. PCA is performed using the variations of all the isoforms between normal and cancer tissues. (Right) The scatter plot of the projection of the original data (i.e., the variations of all the isoforms between normal and cancer tissues) onto the first two PCs; the x-axis contains the first PC while the y-axis contains the second PC. In this plot, it is possible to group isoforms in three classes: the isoform missing the binding site for the miR-200 family members (blue isoform, TCONS_147501), the isoform with the seed match for the miR-200b/200c/429 cluster (red isoform, TCONS_147426), and all the others. The first PC is able to separate the variation of the blue isoform from the others; the second PC is able to separate the variation of the red isoform from the others. (C) The ratio between the abundance of the red isoform (TCONS_147426, with the binding site for the miR-200b/200c/429 cluster) and blue isoform (TCONS_147501, without the binding site) with respect to the miR-200b in both normal (striped rectangle) and cancer tissues (full boxes). In the normal tissues only the isoform of PVT1 gene harboring the binding site for the miR-200b/200c/429 cluster acts as a sponge regulator of the miR-200 family members. In cancer tissues, it stops working as a sponge since its concentration is much lower than the concentration of the miR-200 family members.
Figure 4
Figure 4
Analysis of PVT1 isoforms [27]. (A) Sketch of PVT1 genomic locus as reconstructed by Cufflinks spans across a genome interval of over 300 kb (i.e., 128,806,789-129,113,603 bases within the February 2009 human genome build GRCh37/hg19) on the forward strand of chromosome 8. PVT1 locus gives rise to 91 different variants according to raw RNA-seq data of TCGA (The Cancer Genome Atlas) for breast invasive carcinoma. The isoform names correspond to an increasing symbolic numbering and not to the actual nomenclature of the PVT1 variants. Lines represent introns and boxes (violet and grey) represent exons. Violet boxes correspond to the binding sites for the miR-200 family members. Note that some isoforms lack such binding sites (e.g., Iso11 and Iso12). (B) (Left) The percent variability explained by each principal component (PC) shown by the Pareto chart. This chart contains both bars and a line graph, where individual values are represented in descending order by bars, and the line represents the cumulative total value. The y-axis represents the percentage of the data variance explained by each PC, whereas the x-axis represents the principal components that are able to explain the first 100% of the cumulative distribution. PCA is performed using the variations of all the isoforms between normal and cancer tissues. (Right) The scatter plot of the projection of the original data (i.e., the variations of all the isoforms between normal and cancer tissues) onto the first two PCs; the x-axis contains the first PC while the y-axis contains the second PC. In this plot, it is possible to group isoforms in three classes: the isoform missing the binding site for the miR-200 family members (blue isoform, TCONS_147501), the isoform with the seed match for the miR-200b/200c/429 cluster (red isoform, TCONS_147426), and all the others. The first PC is able to separate the variation of the blue isoform from the others; the second PC is able to separate the variation of the red isoform from the others. (C) The ratio between the abundance of the red isoform (TCONS_147426, with the binding site for the miR-200b/200c/429 cluster) and blue isoform (TCONS_147501, without the binding site) with respect to the miR-200b in both normal (striped rectangle) and cancer tissues (full boxes). In the normal tissues only the isoform of PVT1 gene harboring the binding site for the miR-200b/200c/429 cluster acts as a sponge regulator of the miR-200 family members. In cancer tissues, it stops working as a sponge since its concentration is much lower than the concentration of the miR-200 family members.
Figure 5
Figure 5
SWIM flowchart. The figure depicts the steps performed by SWIM [28] and shows some examples of outputs obtained by running SWIM on the grapevine dataset [29].
Figure 6
Figure 6
SWIM applications in (A) grapevine analysis [29], (B) multi-cancers analysis [28], and (C) glioblastoma analysis [30]. (A) A sketch of the switch gene regulation mechanism in grapevine. During the vegetative/green phase of organ development, switch genes are repressed by miRNAs and vegetative genes are expressed. In the transition to the mature/red phase, these miRNAs are deactivated, the switch genes are expressed and their anti-correlated vegetative genes are turned off. The heat map shows the transcription level of positively and negatively correlated genes with a typical switch, where expression values increase from blue to red. (B) A sketch of the switch gene regulation mechanism in human cancers. SWIM extracted a set of 100 cancer-recurrent switch genes across four tumors—breast invasive carcinoma (brca), lung squamous cell carcinoma (lusc), lung adenocarcinoma (luad), uterine corpus endometrial carcinoma (ucec)—that showed a marked functional enrichment in cell cycle and specifically on the regulation of the G2-to-M transition. The promoter motif analysis suggested that two major transcription factors (namely E2F and NFY) lead to the activation of the switch gene layer of gene regulation. Activation of switch genes in these cancers seems to predominantly repress several metabolic pathways, possibly leading to the well-known metabolic rewiring characterizing cancer cells. (C) A sketch of the switch gene regulation mechanism in human glioblastoma. Glioblastoma subpopulation of self-renewing, stem-like cells has been shown to be responsible for tumor initiation, progression, resistance to treatment, and relapse. Among switch genes identified by SWIM involved in the transition from a stem-like to a differentiated phenotype of glioblastoma cells, FOSL1 stands out as a promising candidate to trigger the differentiation. On one hand, it has been found positively correlated with genes encoding proteins linked to the focal adhesion complex and extracellular matrix (ECM) receptor interaction (e.g., integrins, collagen, and signaling proteins). Conversely, it is negatively regulated with well-known neurodevelopmental transcription factors (TFs) specific of stem-like identity, including the core set of OLIG2, POU3F2, SALL2, SOX2 [70]. Thus, it could be considered as putative controller of stem-like cell differentiation process by repressing the core set of neurodevelopmental TFs and by modulating the equilibrium between cell adhesion and migration.
Figure 6
Figure 6
SWIM applications in (A) grapevine analysis [29], (B) multi-cancers analysis [28], and (C) glioblastoma analysis [30]. (A) A sketch of the switch gene regulation mechanism in grapevine. During the vegetative/green phase of organ development, switch genes are repressed by miRNAs and vegetative genes are expressed. In the transition to the mature/red phase, these miRNAs are deactivated, the switch genes are expressed and their anti-correlated vegetative genes are turned off. The heat map shows the transcription level of positively and negatively correlated genes with a typical switch, where expression values increase from blue to red. (B) A sketch of the switch gene regulation mechanism in human cancers. SWIM extracted a set of 100 cancer-recurrent switch genes across four tumors—breast invasive carcinoma (brca), lung squamous cell carcinoma (lusc), lung adenocarcinoma (luad), uterine corpus endometrial carcinoma (ucec)—that showed a marked functional enrichment in cell cycle and specifically on the regulation of the G2-to-M transition. The promoter motif analysis suggested that two major transcription factors (namely E2F and NFY) lead to the activation of the switch gene layer of gene regulation. Activation of switch genes in these cancers seems to predominantly repress several metabolic pathways, possibly leading to the well-known metabolic rewiring characterizing cancer cells. (C) A sketch of the switch gene regulation mechanism in human glioblastoma. Glioblastoma subpopulation of self-renewing, stem-like cells has been shown to be responsible for tumor initiation, progression, resistance to treatment, and relapse. Among switch genes identified by SWIM involved in the transition from a stem-like to a differentiated phenotype of glioblastoma cells, FOSL1 stands out as a promising candidate to trigger the differentiation. On one hand, it has been found positively correlated with genes encoding proteins linked to the focal adhesion complex and extracellular matrix (ECM) receptor interaction (e.g., integrins, collagen, and signaling proteins). Conversely, it is negatively regulated with well-known neurodevelopmental transcription factors (TFs) specific of stem-like identity, including the core set of OLIG2, POU3F2, SALL2, SOX2 [70]. Thus, it could be considered as putative controller of stem-like cell differentiation process by repressing the core set of neurodevelopmental TFs and by modulating the equilibrium between cell adhesion and migration.
Figure 7
Figure 7
Comparative analysis of miRNAs acting as switch genes in the large panel of TCGA cancer datasets. (A) miRNA-diseasome. The bipartite network is composed of two disjoint sets of nodes with different size: the larger ones correspond to the analyzed human cancer types from TCGA, whereas the smaller ones correspond to all miRNAs acting as switch genes. A link occurs between a tumor type and a miRNA if the miRNA acts as switch gene for that tumor. Different colors are associated to different tumor types. miRNAs are colored based on the tumor type to which they belong. Nodes are light gray if the corresponding miRNAs are associated with more than one tumor type. (B) miRNA-disease network (MDN). The MDN is the projection of the miRNA-diseasome bipartite network, in which nodes correspond to tumor types (diseases) and two diseases are connected if there is at least one miRNA that acts as switch gene in both. The width of a link is proportional to the number of miRNAs that are acting as switch genes in both diseases. The size of a node is proportional to the number of microRNAs acting as switch genes for that disease. Different node colors are associated with different diseases. blca: bladder urothelial carcinoma, chol: cholangiocarcinoma, hnsc: head and neck squamous cell carcinoma, kich: kidney chromophobe, kirc: kidney renal clear cell carcinoma, kirp: kidney renal papillary cell carcinoma, lihc: liver hepatocellular carcinoma, prad: prostate adenocarcinoma, thca: thyroid carcinoma.
Figure 8
Figure 8
Comparative analysis of lncRNAs acting as switch genes in the large panel of TCGA cancer datasets. (A) lncRNA-diseasome. The bipartite network is composed of two disjoint sets of nodes with different size: the larger ones correspond to the analyzed human cancer types from TCGA, whereas the smaller ones correspond to all lncRNAs acting as switch genes. A link occurs between a tumor type and a lncRNA if the lncRNA acts as switch gene for that tumor. Different colors are associated to different tumor types. lncRNAs are colored based on the tumor type to which they belong. Nodes are light gray if the corresponding lncRNAs are associated with more than one tumor type. (B) lncRNA-disease network (LDN). The LDN is the projection of the lncRNA-diseasome bipartite network, in which nodes correspond to tumor types (diseases) and two diseases are connected if there is at least one lncRNA that acts as switch gene in both. The width of a link is proportional to the number of lncRNAs that are acting as switch genes in both diseases. The size of a node is proportional to the number of lncRNAs acting as switch genes for that disease. Different node colors are associated with different diseases.
Figure 9
Figure 9
Comparative analysis of protein-coding genes (mRNAs) acting as switch genes in the large panel of TCGA cancer datasets. (A) mRNA-diseasome. The bipartite network is composed of two disjoint sets of nodes with different size: the larger ones correspond to the analyzed human cancer types from TCGA, whereas the smaller ones correspond to all protein coding genes acting as switch genes. A link occurs between a tumor type and a mRNA if the mRNA acts as switch gene for that tumor. Different colors are associated to different tumor types. mRNAs are colored based on the tumor type to which they belong. Nodes are light gray if the corresponding miRNAs are associated with more than one tumor type. (B) mRNA-disease network (MRDN). The MRDN is the projection of the mRNA-diseasome bipartite network, in which nodes correspond to tumor types (diseases) and two diseases are connected if there is at least one mRNA that acts as switch gene in both. The width of a link is proportional to the number of mRNAs that are acting as switch genes in both diseases. The size of a node is proportional to the number of mRNAs acting as switch genes for that disease. Different node colors are associated with different diseases.
Figure 10
Figure 10
Performance of SWIM in human breast invasive carcinoma. (A) Enrichment p-values of switch genes in seed genes obtained by running SWIM for breast invasive carcinoma. (B) Enrichment p-values for a subset of genes drawn randomly from the network in seed genes.

Similar articles

Cited by

References

    1. Barabási A.L., Gulbahce N., Loscalzo J. Network Medicine: A Network-based approach to human disease. Nat. Rev. Genet. 2011;12:56. doi: 10.1038/nrg2918. - DOI - PMC - PubMed
    1. Goh K.I., Cusick M.E., Valle D., Childs B., Vidal M., Barabási A.L. The human disease network. Proc. Natl. Acad. Sci. USA. 2007;104:8685–8690. doi: 10.1073/pnas.0701361104. - DOI - PMC - PubMed
    1. Rual J.F., Venkatesan K., Hao T., Hirozane-Kishikawa T., Dricot A., Li N., Berriz G.F., Gibbons F.D., Dreze M., Ayivi-Guedehoussou N., et al. Towards a proteome-scale map of the human protein–protein interaction network. Nature. 2005;437:1173–1178. doi: 10.1038/nature04209. - DOI - PubMed
    1. Stelzl U., Worm U., Lalowski M., Haenig C., Brembeck F.H., Goehler H., Stroedicke M., Zenkner M., Schoenherr A., Koeppen S., et al. A human protein–protein interaction network: A resource for annotating the proteome. Cell. 2005;122:957–968. doi: 10.1016/j.cell.2005.08.029. - DOI - PubMed
    1. Carninci P., Kasukawa T., Katayama S., Gough J., Frith M.C., Maeda N., Oyama R., Ravasi T., Lenhard B., Wells C., et al. The transcriptional landscape of the mammalian genome. Science. 2005;309:1559–1563. doi: 10.1126/science.1112014. - DOI - PubMed

LinkOut - more resources